GMS location: 374
Random forest results
| names |
period |
power |
significance |
meanSquareError |
absError |
maxError |
CRPS |
IGN |
| baseline |
winter 2016 |
0.995 |
0.000e+00 |
0.422 |
0.503 |
1.816 |
NaN |
NaN |
| forest |
winter 2016 |
1.000 |
0.050 |
0.309 |
0.422 |
1.783 |
0.414 |
2.997 |
| baseline |
winter 2017 |
0.952 |
0.069 |
0.529 |
0.553 |
2.472 |
NaN |
NaN |
| forest |
winter 2017 |
0.968 |
0.069 |
0.321 |
0.435 |
1.683 |
0.422 |
3.144 |
| baseline |
winter 2018 |
0.983 |
0.056 |
0.406 |
0.484 |
1.950 |
NaN |
NaN |
| forest |
winter 2018 |
0.983 |
0.056 |
0.322 |
0.439 |
1.846 |
0.424 |
2.962 |
| baseline |
winter 2019 |
0.993 |
0.056 |
0.349 |
0.449 |
1.889 |
NaN |
NaN |
| forest |
winter 2019 |
0.993 |
0.111 |
0.314 |
0.421 |
1.925 |
0.410 |
2.131 |
| baseline |
all |
0.982 |
0.047 |
0.426 |
0.498 |
2.472 |
NaN |
NaN |
| forest |
all |
0.988 |
0.071 |
0.316 |
0.428 |
1.925 |
0.417 |
2.815 |
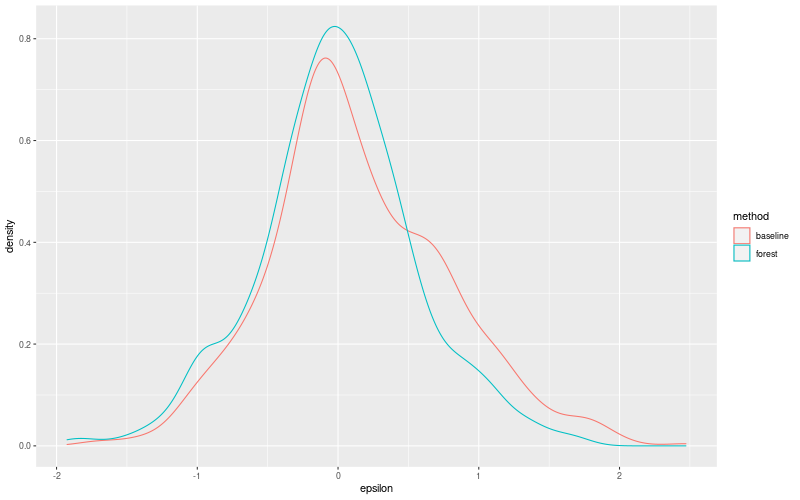
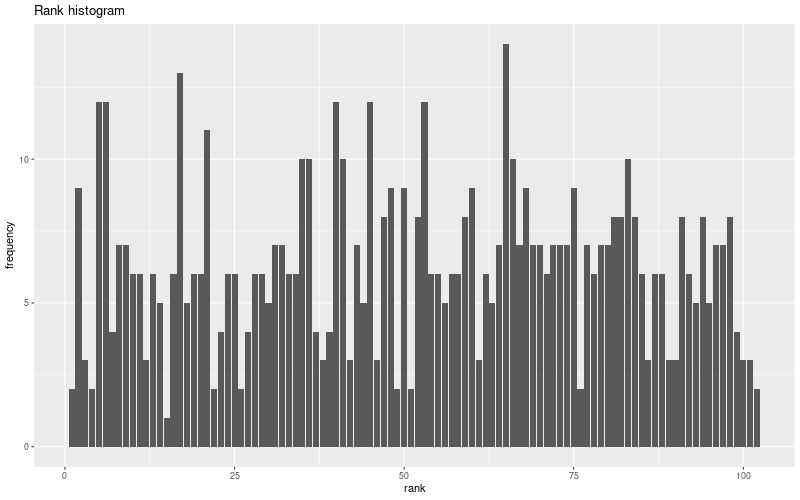
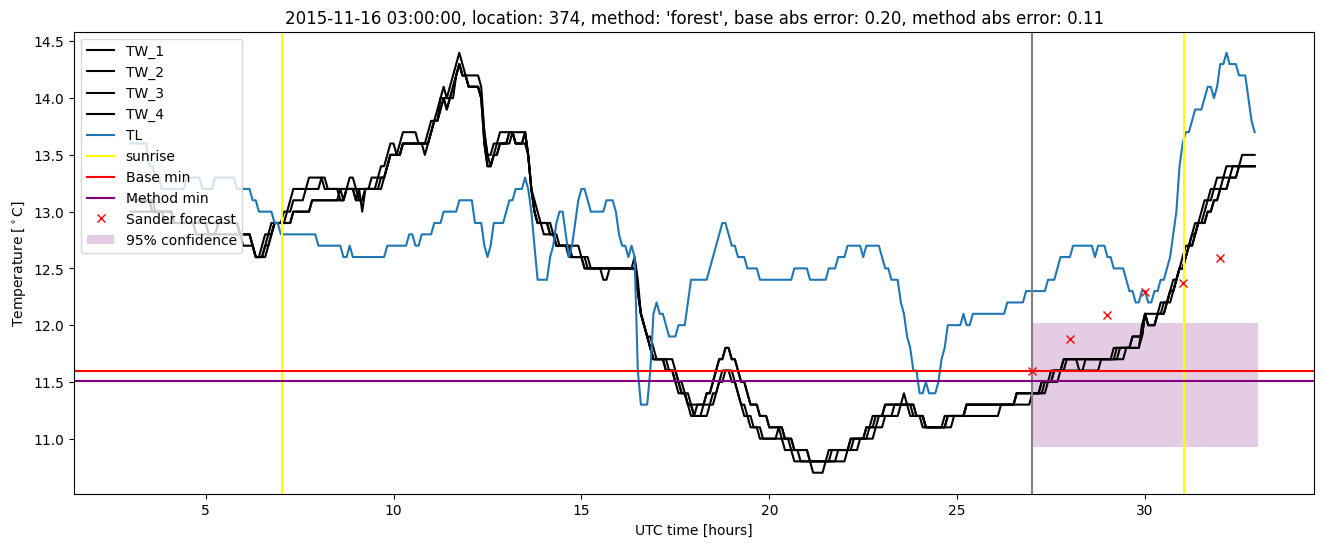
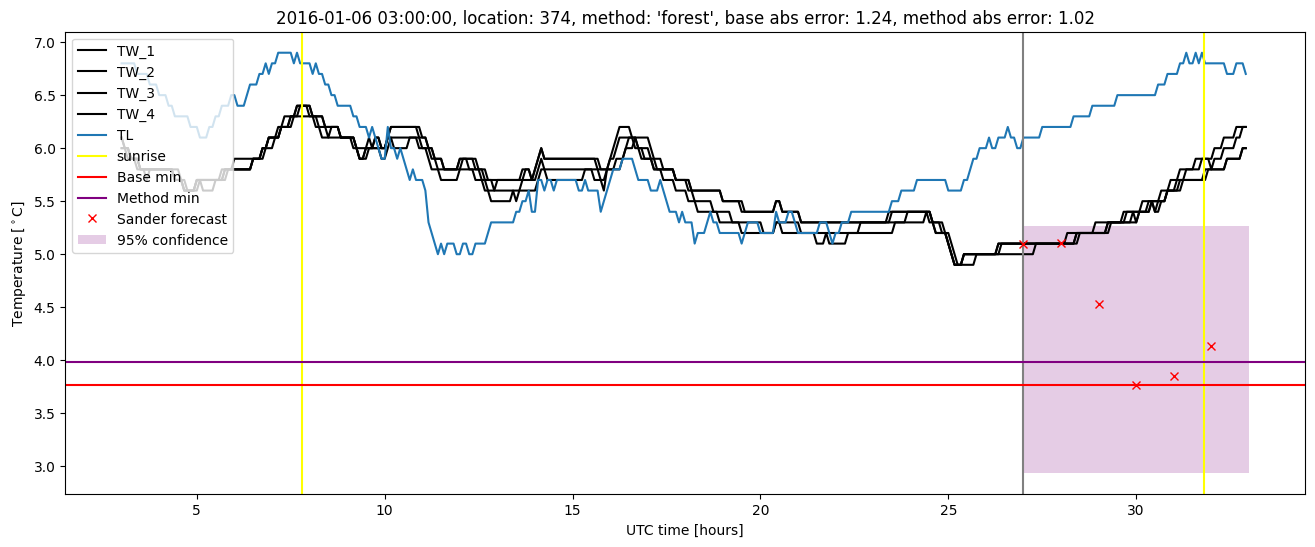
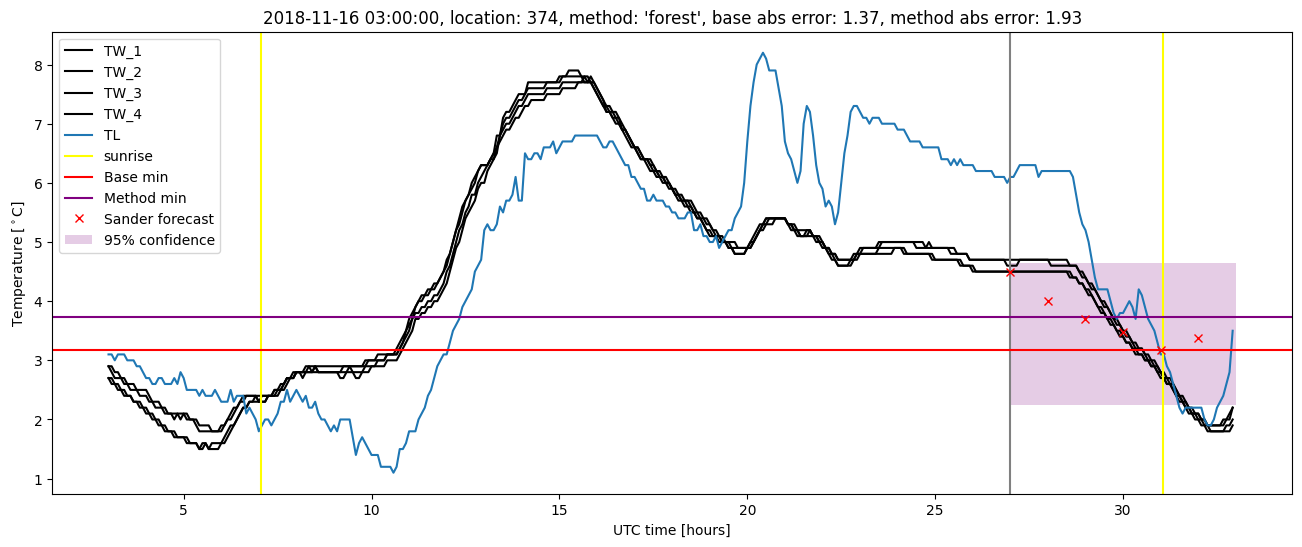
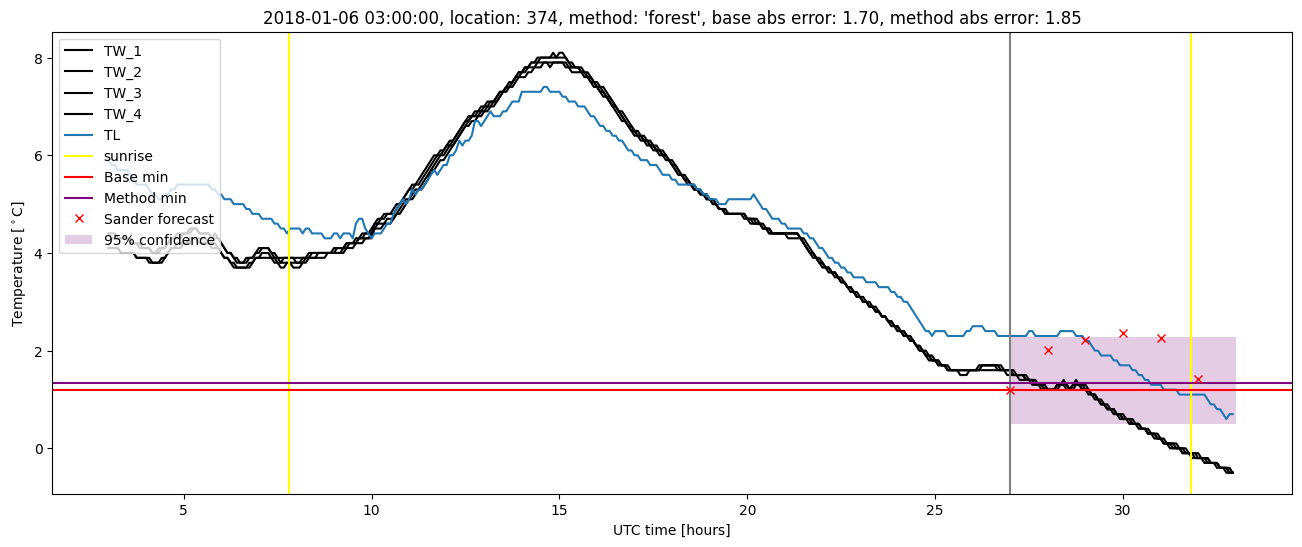
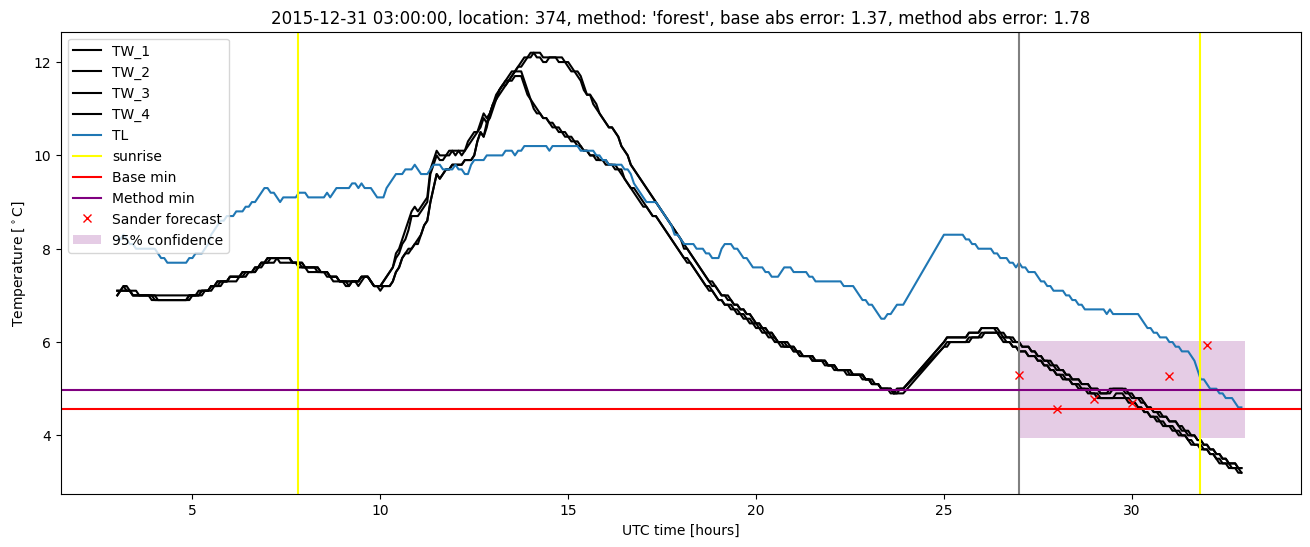
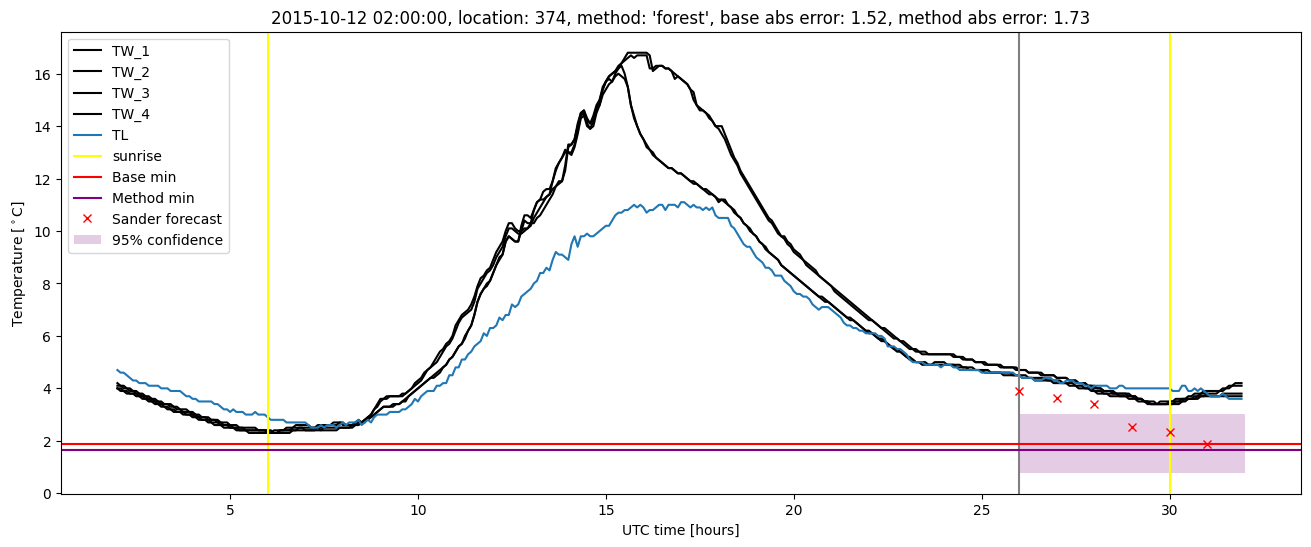
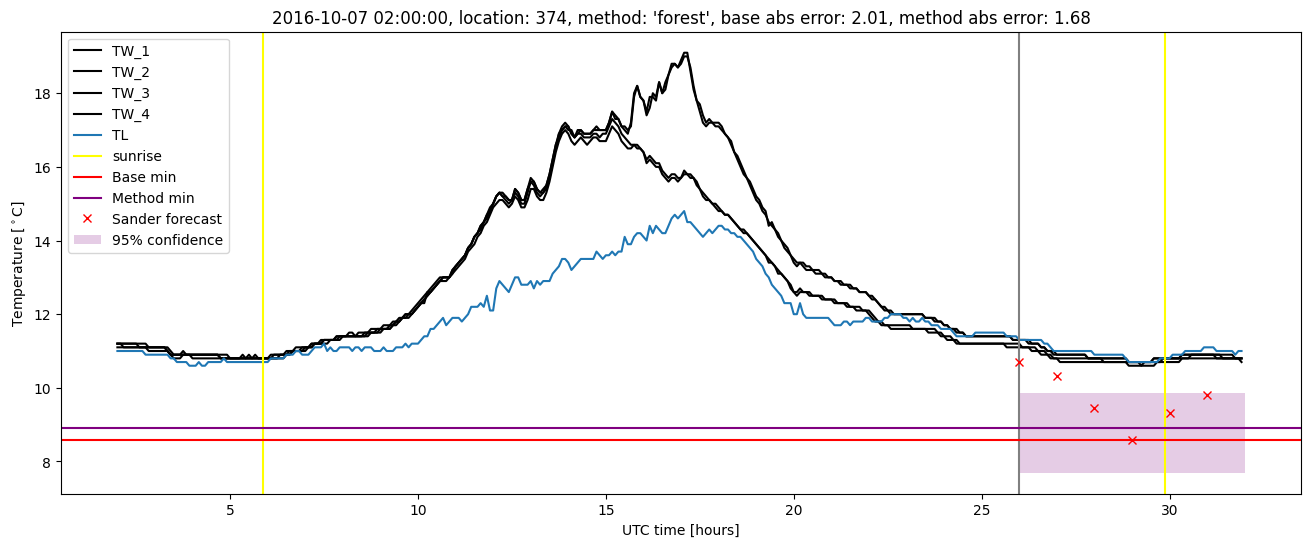
Random forest plots

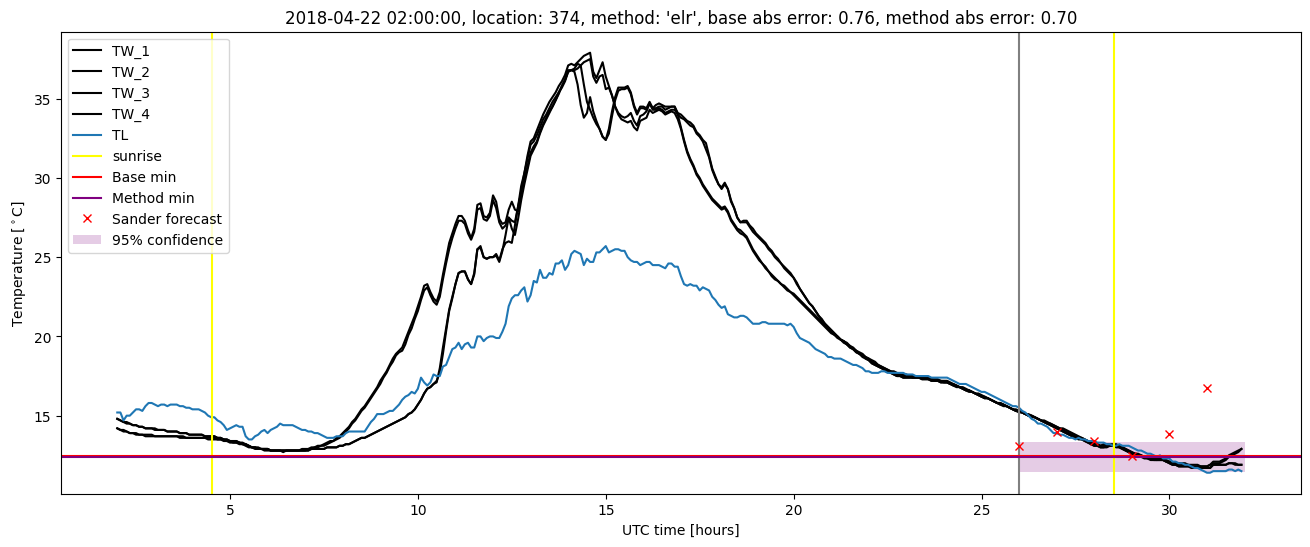
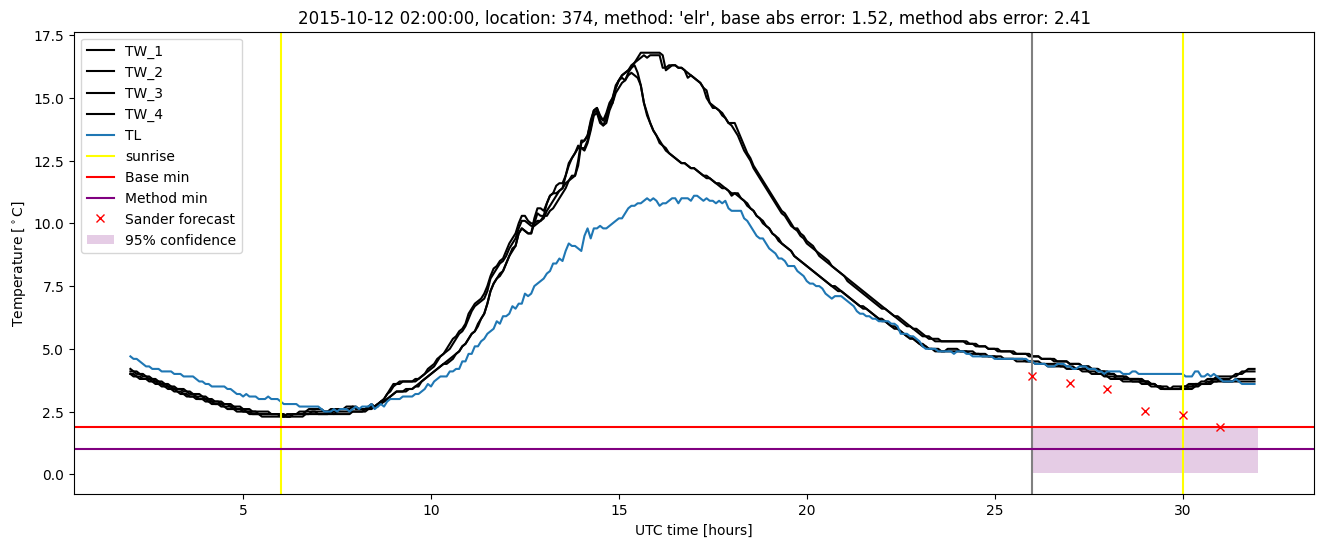
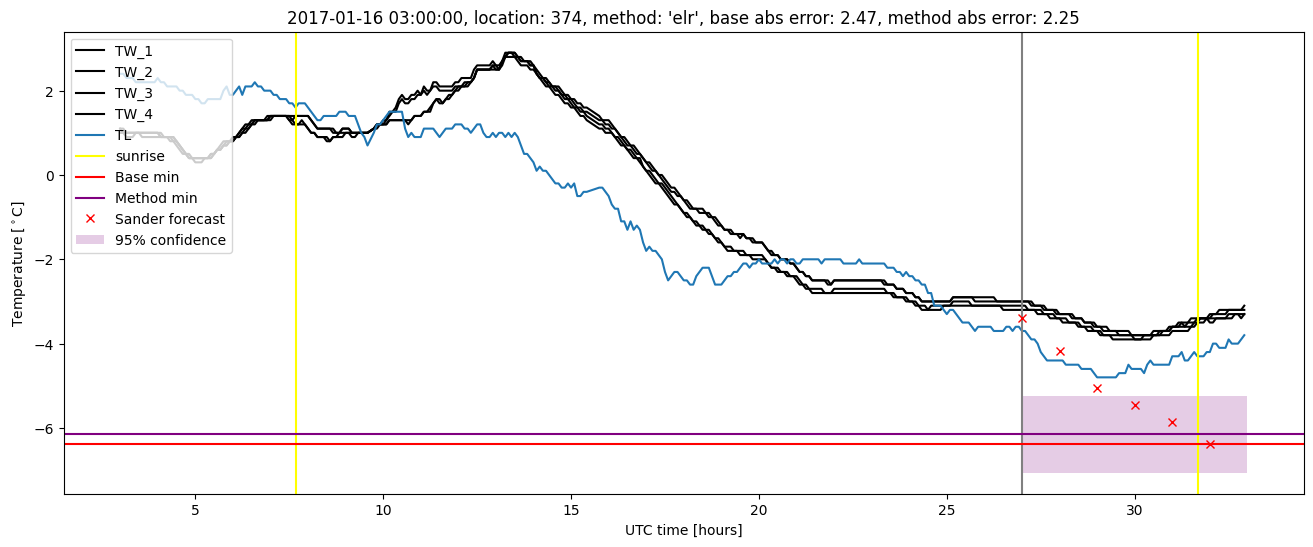
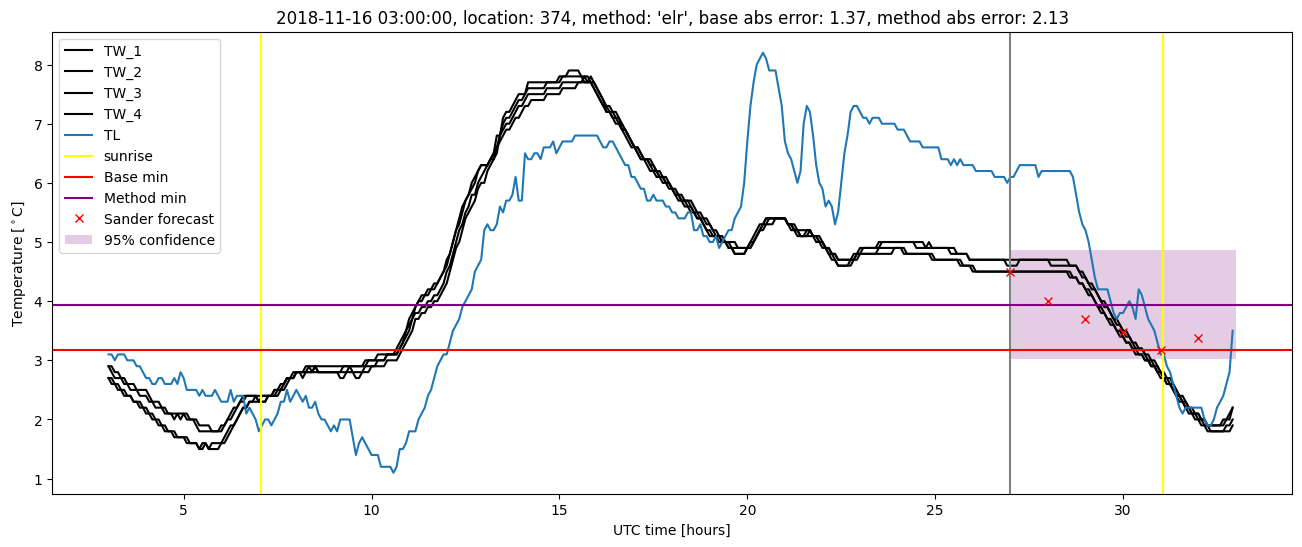
Extended logistic regression results
| names |
period |
power |
significance |
meanSquareError |
absError |
maxError |
CRPS |
IGN |
| baseline |
winter 2016 |
0.995 |
0.000e+00 |
0.422 |
0.503 |
1.816 |
NaN |
NaN |
| elr |
winter 2016 |
1.000 |
0.050 |
0.349 |
0.451 |
2.409 |
0.500 |
3.229 |
| baseline |
winter 2017 |
0.952 |
0.069 |
0.529 |
0.553 |
2.472 |
NaN |
NaN |
| elr |
winter 2017 |
0.968 |
0.069 |
0.403 |
0.466 |
2.253 |
0.451 |
2.727 |
| baseline |
winter 2018 |
0.983 |
0.056 |
0.406 |
0.484 |
1.950 |
NaN |
NaN |
| elr |
winter 2018 |
0.983 |
0.056 |
0.338 |
0.432 |
2.061 |
0.478 |
2.738 |
| baseline |
winter 2019 |
0.993 |
0.056 |
0.349 |
0.449 |
1.889 |
NaN |
NaN |
| elr |
winter 2019 |
0.993 |
0.111 |
0.374 |
0.458 |
2.131 |
0.458 |
2.630 |
| baseline |
all |
0.982 |
0.047 |
0.426 |
0.498 |
2.472 |
NaN |
NaN |
| elr |
all |
0.988 |
0.071 |
0.365 |
0.452 |
2.409 |
0.474 |
2.862 |
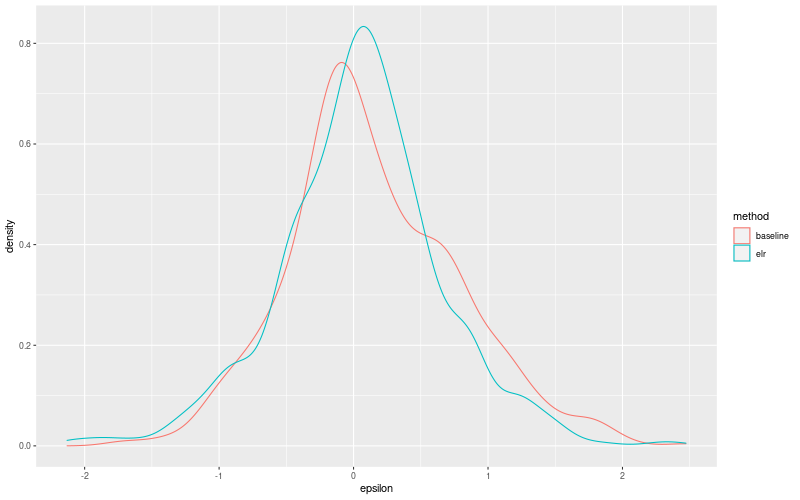
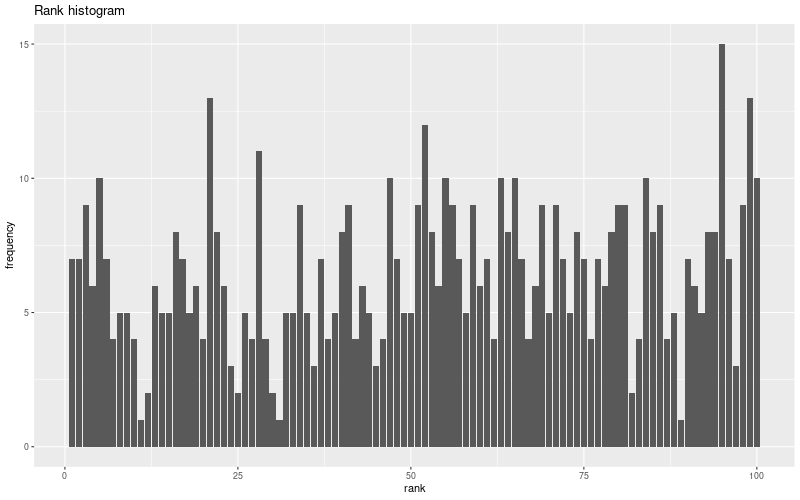
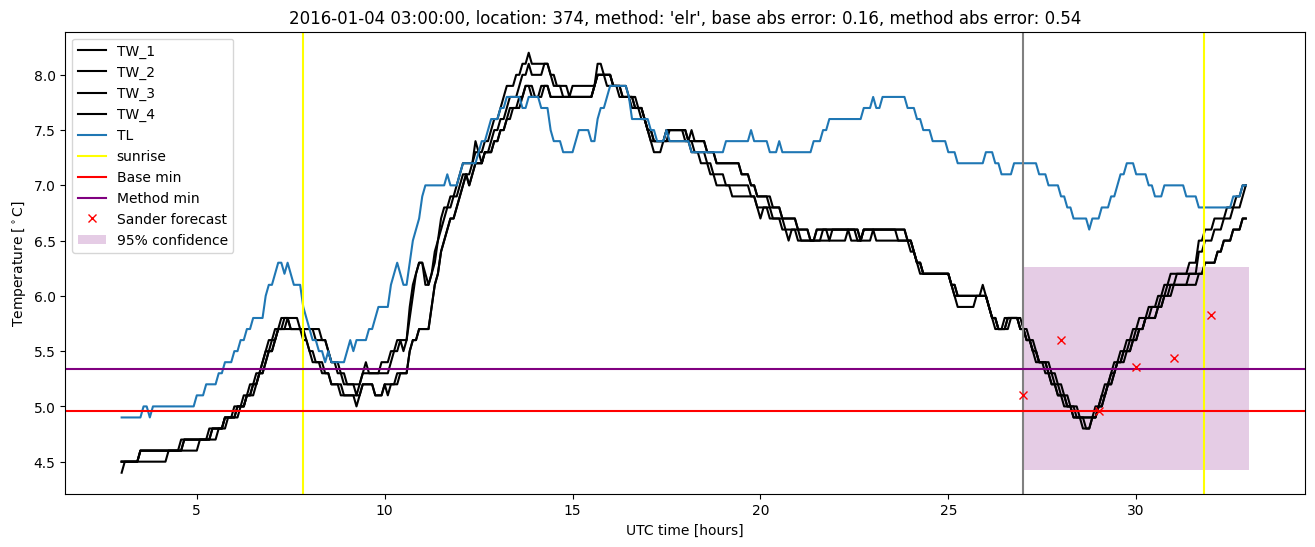
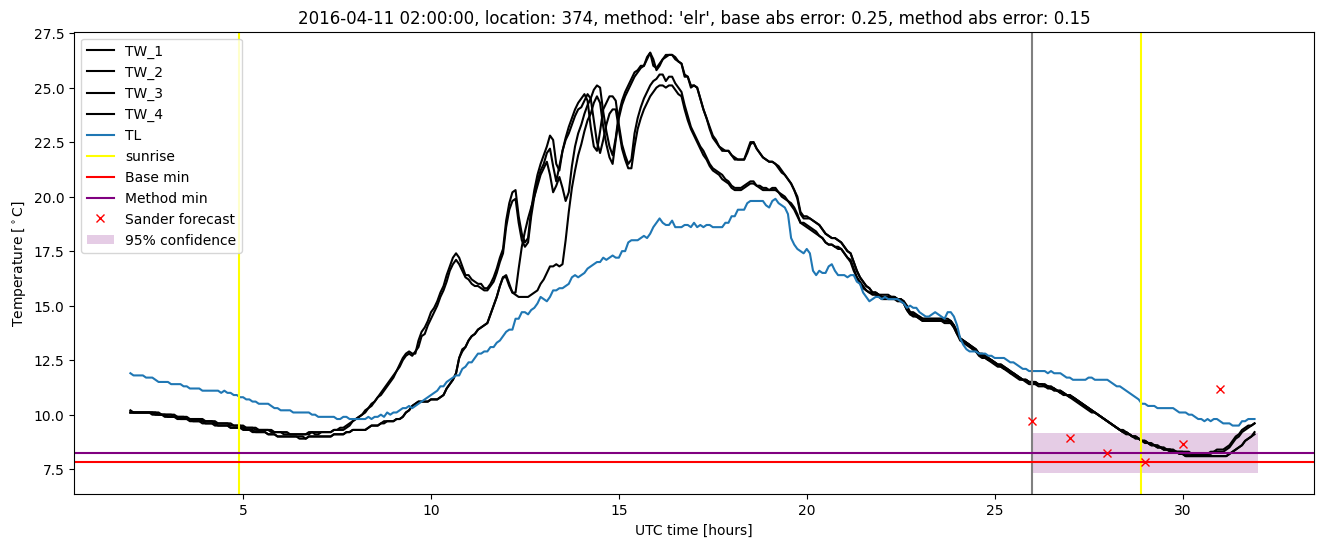
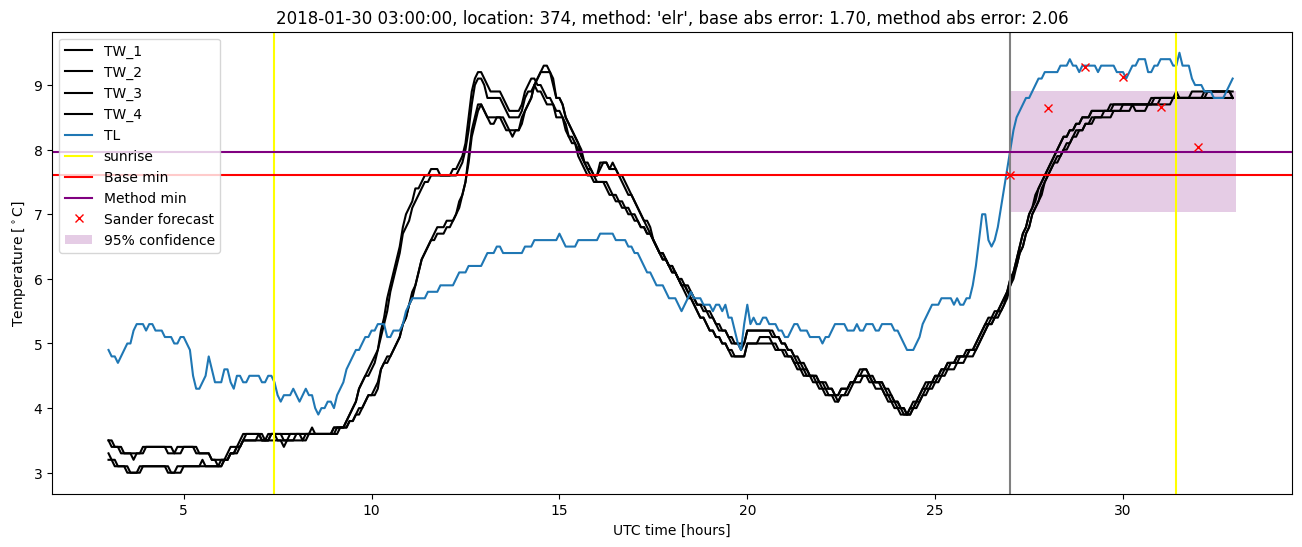
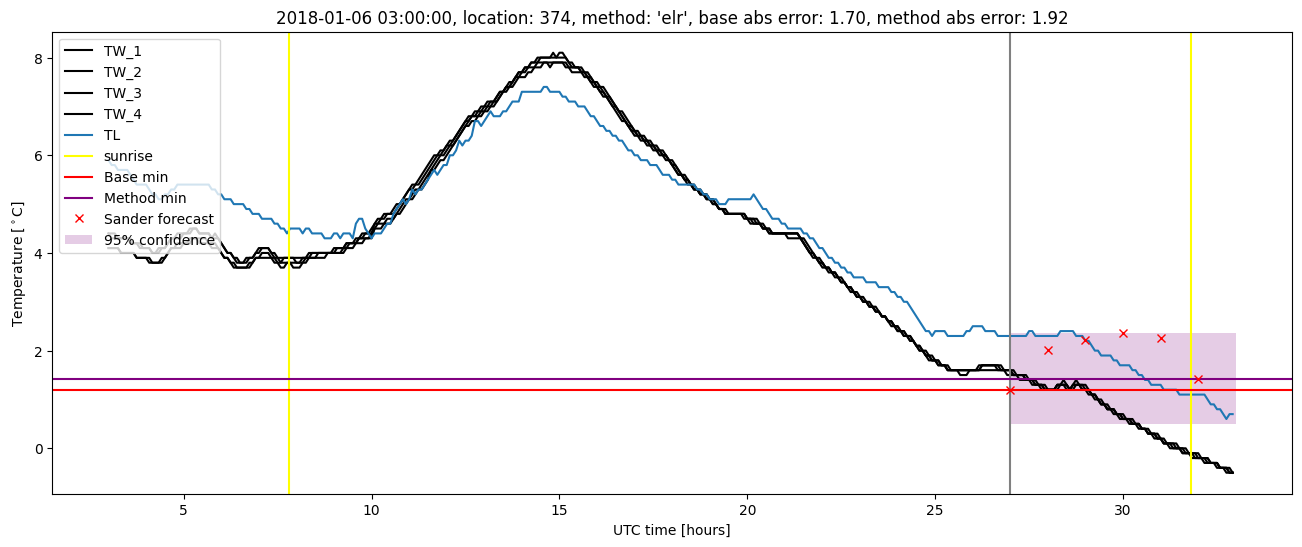
Extended logistic regression plots