GMS location: 373
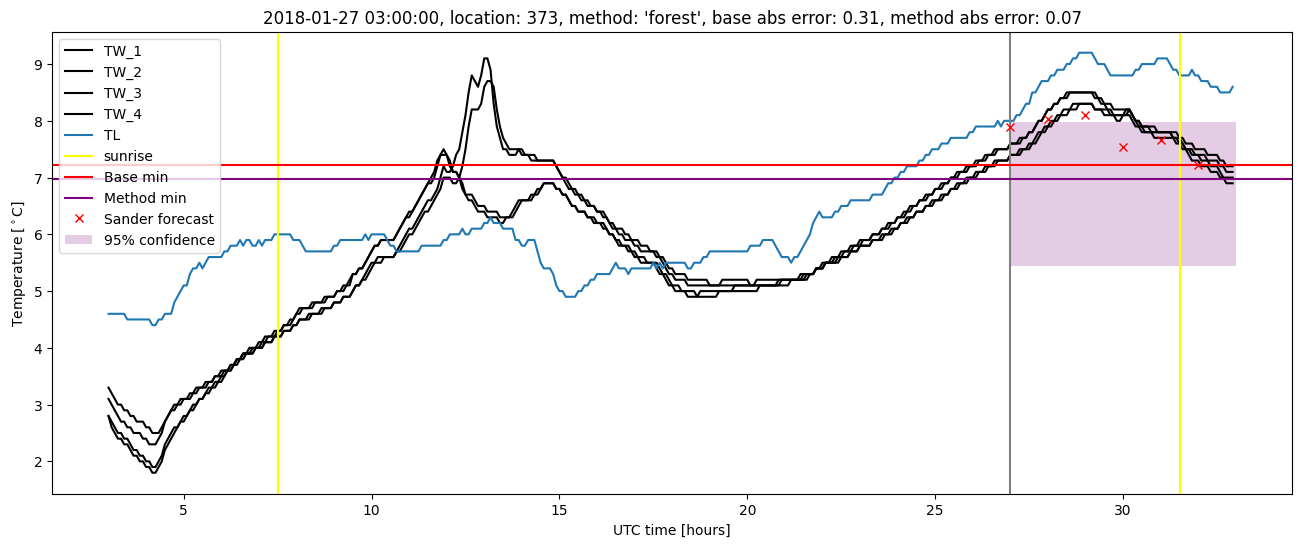
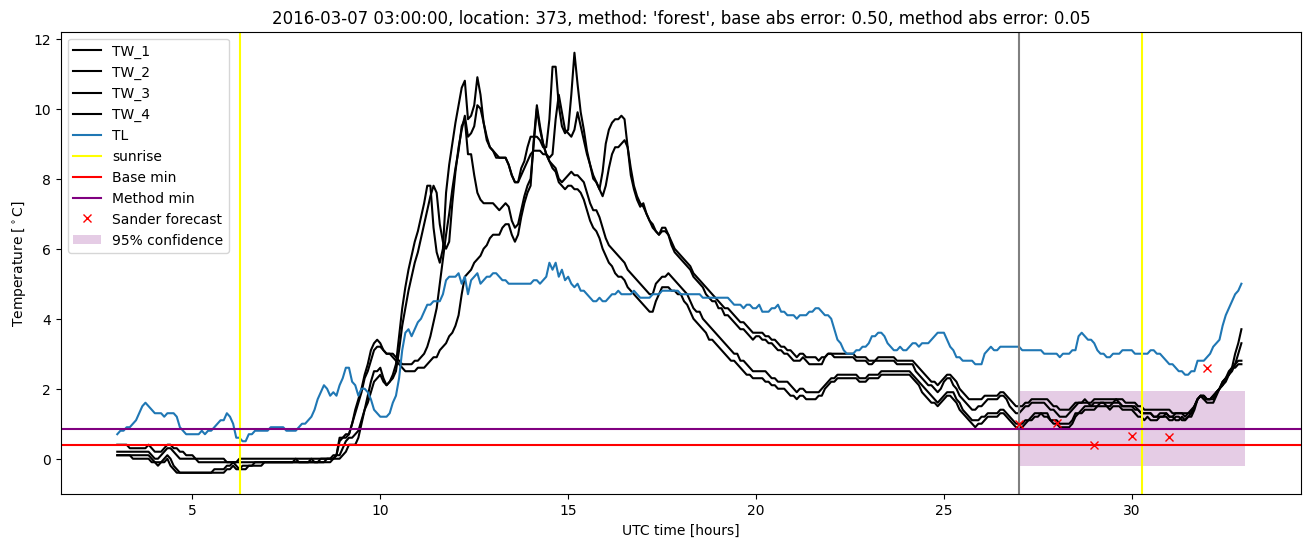
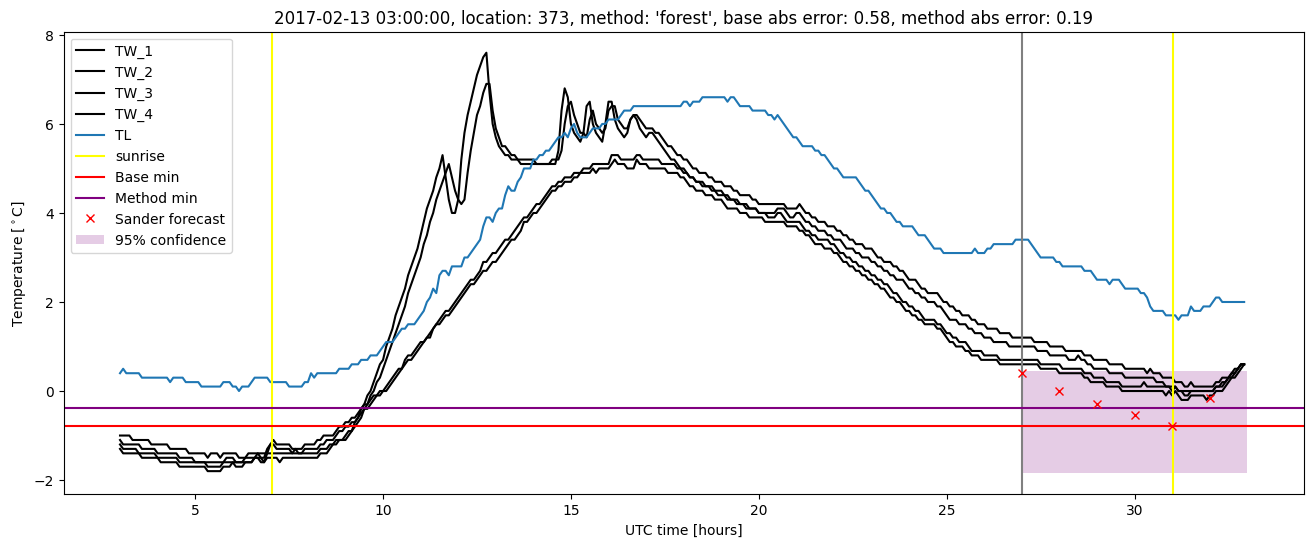
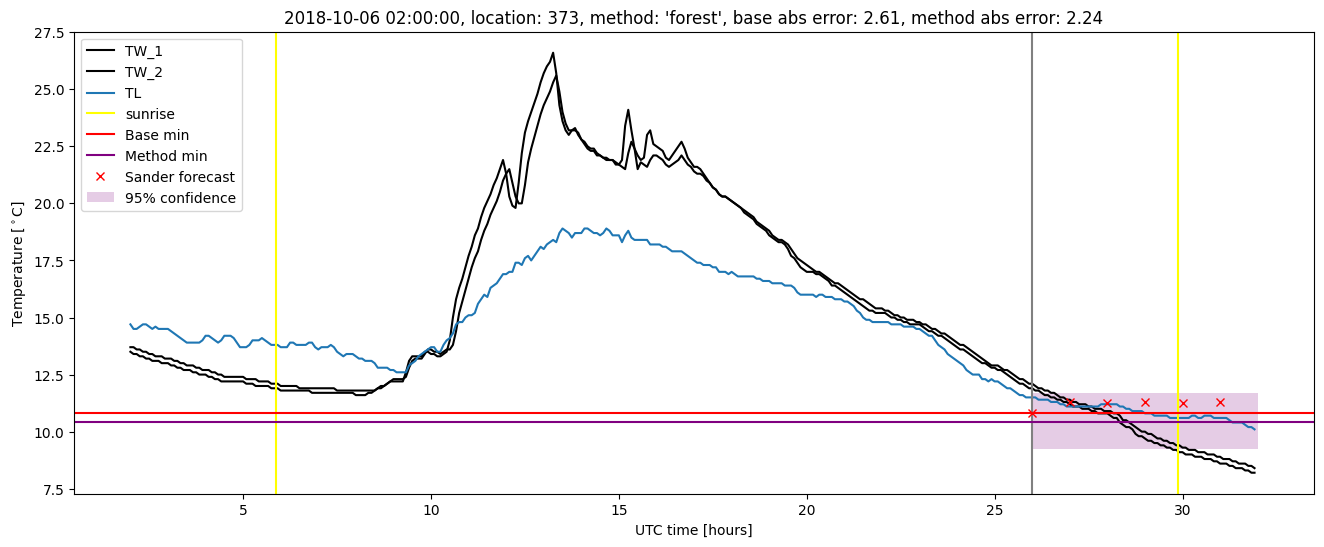
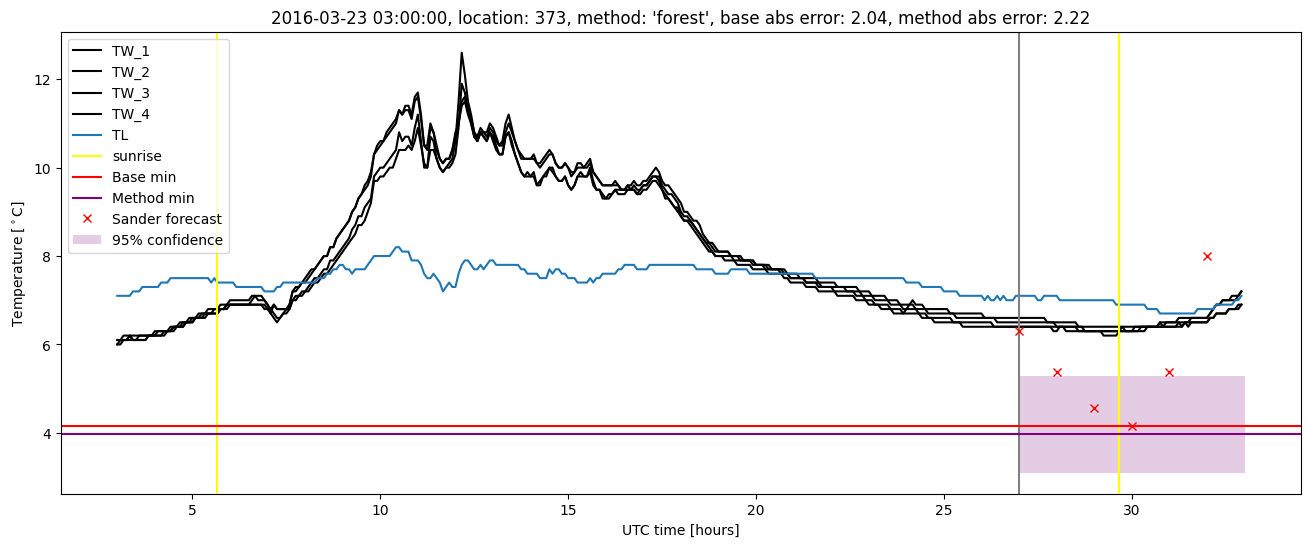
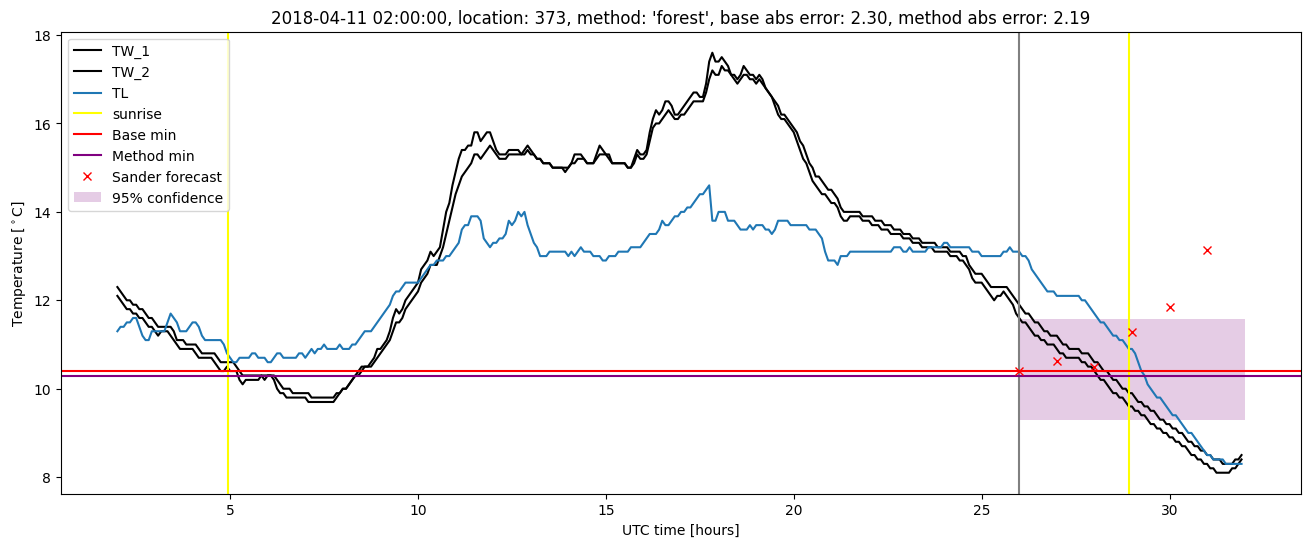
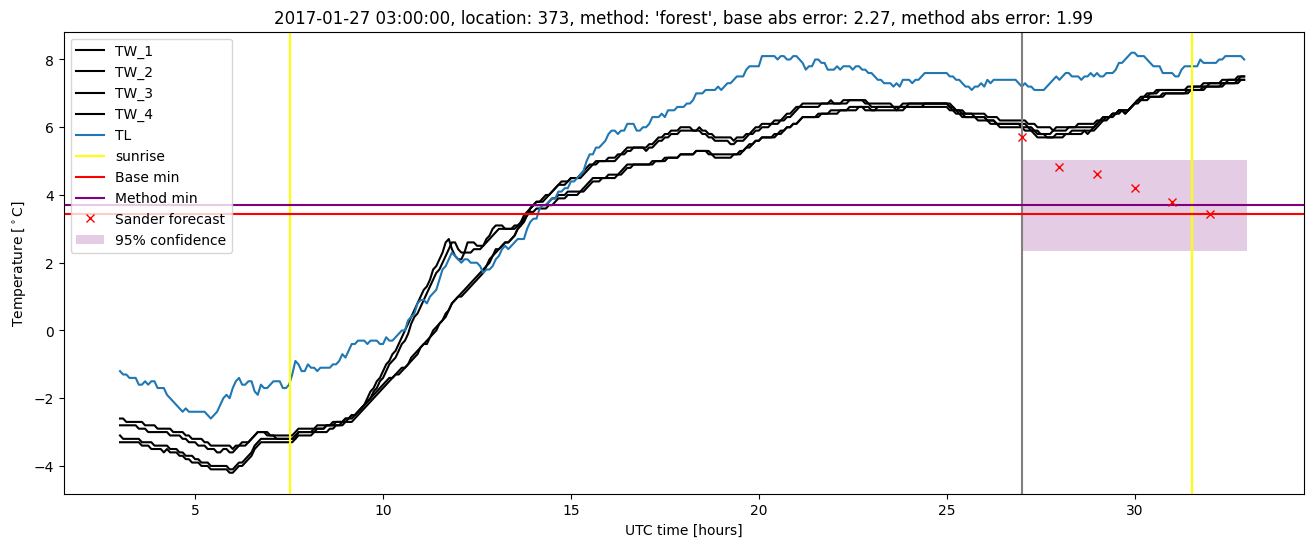
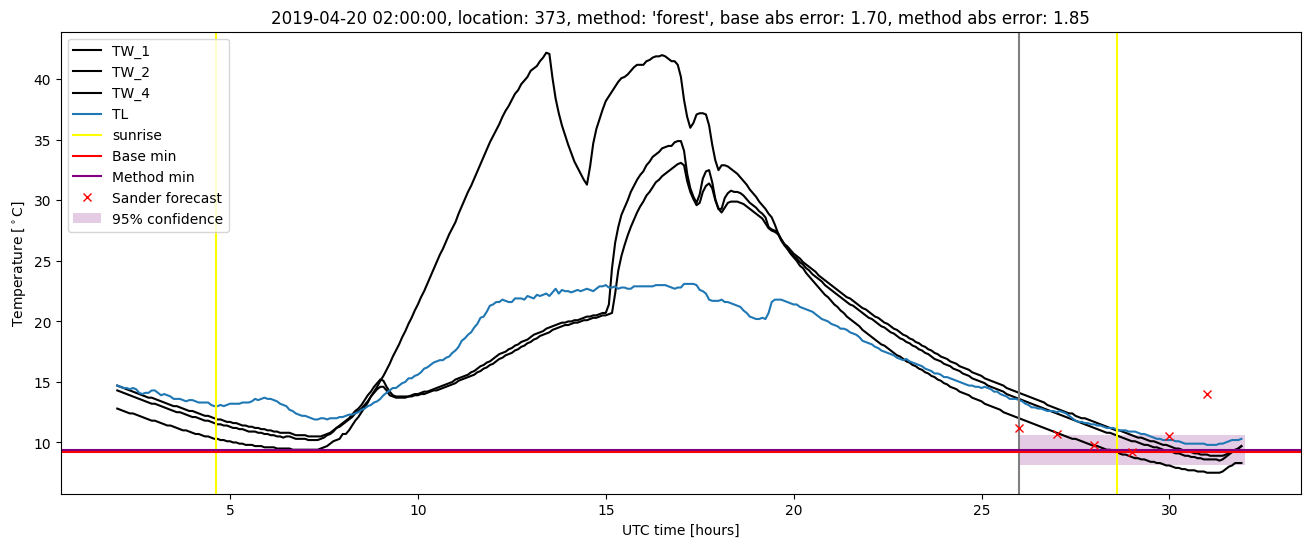
Random forest results
| names |
period |
power |
significance |
meanSquareError |
absError |
maxError |
CRPS |
IGN |
| baseline |
winter 2016 |
1.000 |
0.045 |
0.402 |
0.478 |
2.043 |
NaN |
NaN |
| forest |
winter 2016 |
1.000 |
0.091 |
0.369 |
0.458 |
2.224 |
0.470 |
2.901 |
| baseline |
winter 2017 |
0.984 |
0.037 |
0.462 |
0.512 |
2.269 |
NaN |
NaN |
| forest |
winter 2017 |
0.984 |
0.037 |
0.345 |
0.444 |
1.985 |
0.458 |
2.375 |
| baseline |
winter 2018 |
0.987 |
0.059 |
0.347 |
0.438 |
2.300 |
NaN |
NaN |
| forest |
winter 2018 |
0.994 |
0.059 |
0.281 |
0.389 |
2.193 |
0.481 |
2.223 |
| baseline |
winter 2019 |
1.000 |
0.083 |
0.547 |
0.552 |
2.605 |
NaN |
NaN |
| forest |
winter 2019 |
1.000 |
0.083 |
0.468 |
0.500 |
2.236 |
0.462 |
2.544 |
| baseline |
all |
0.993 |
0.051 |
0.435 |
0.492 |
2.605 |
NaN |
NaN |
| forest |
all |
0.995 |
0.064 |
0.364 |
0.447 |
2.236 |
0.468 |
2.533 |
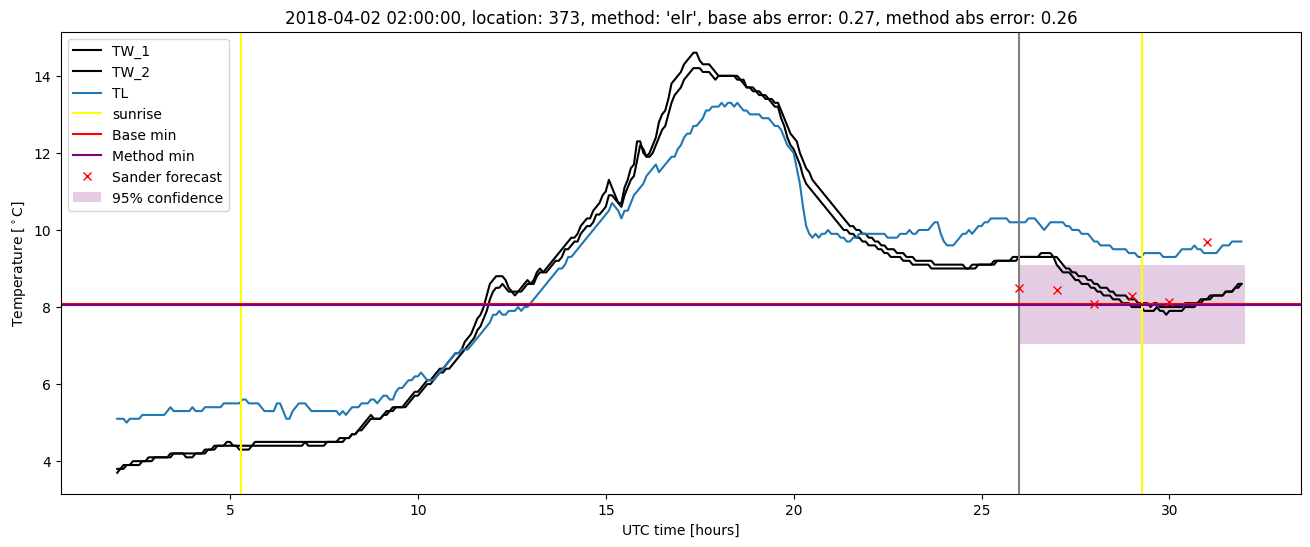
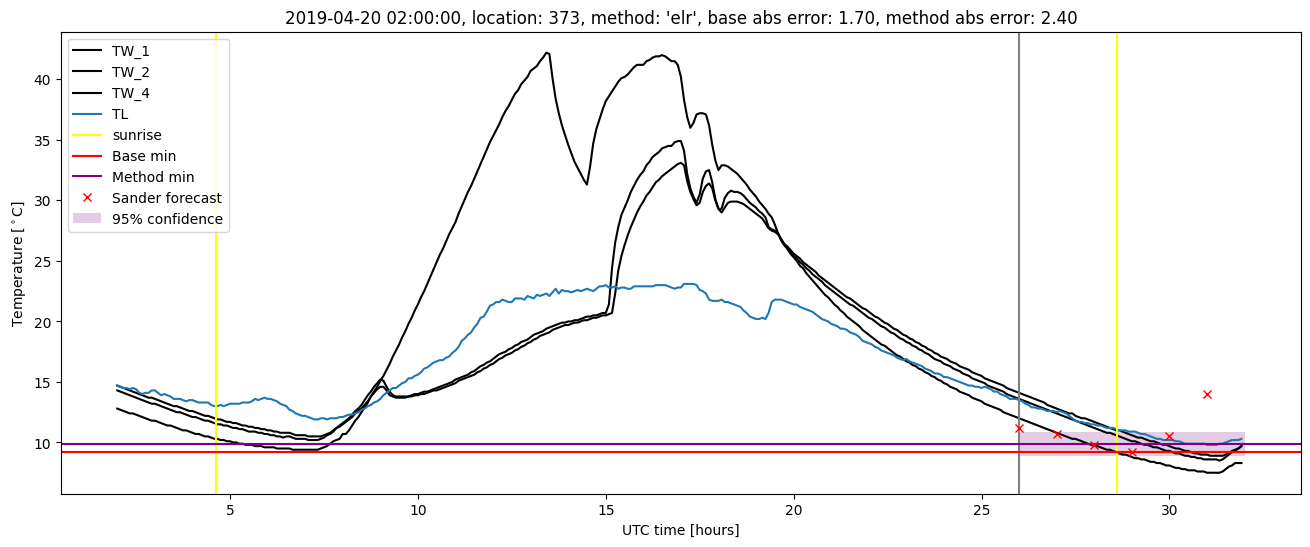
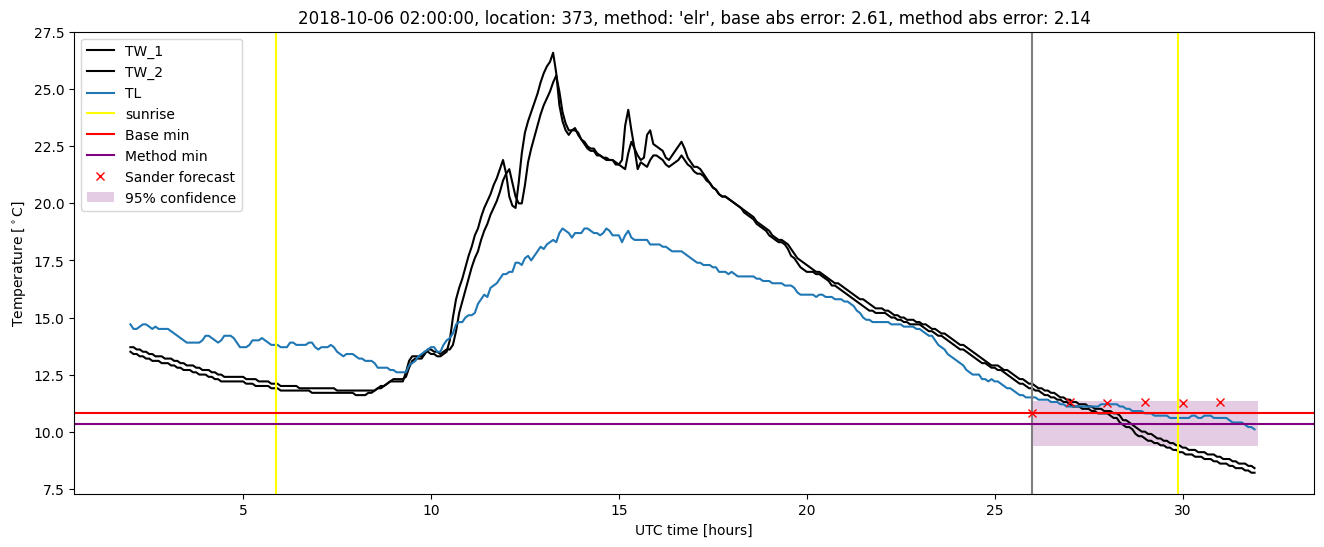
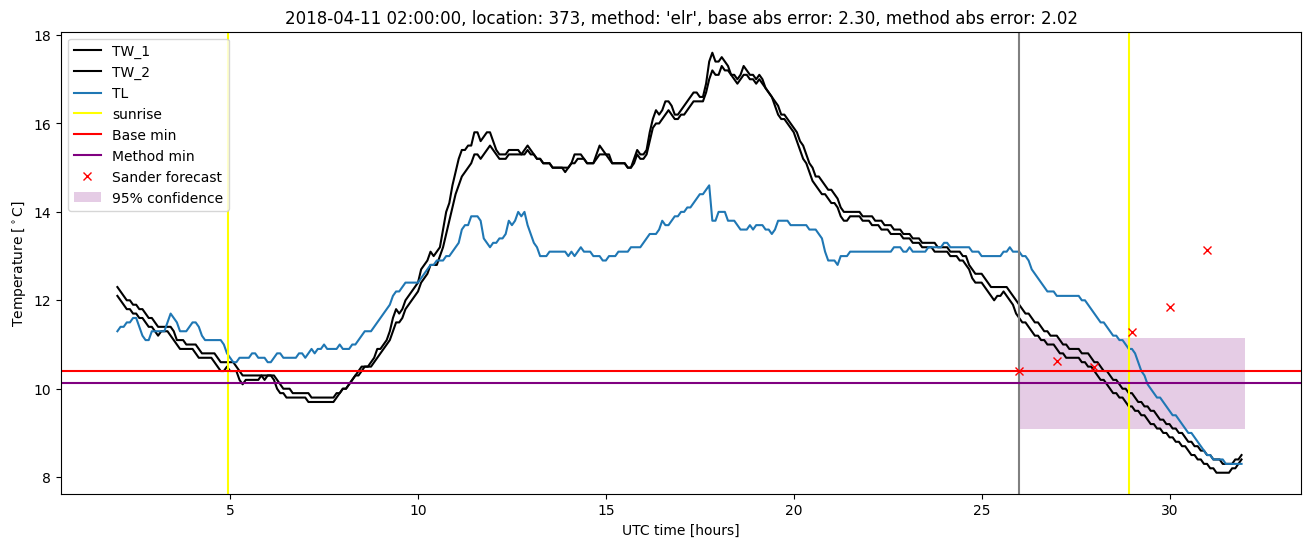
Random forest plots
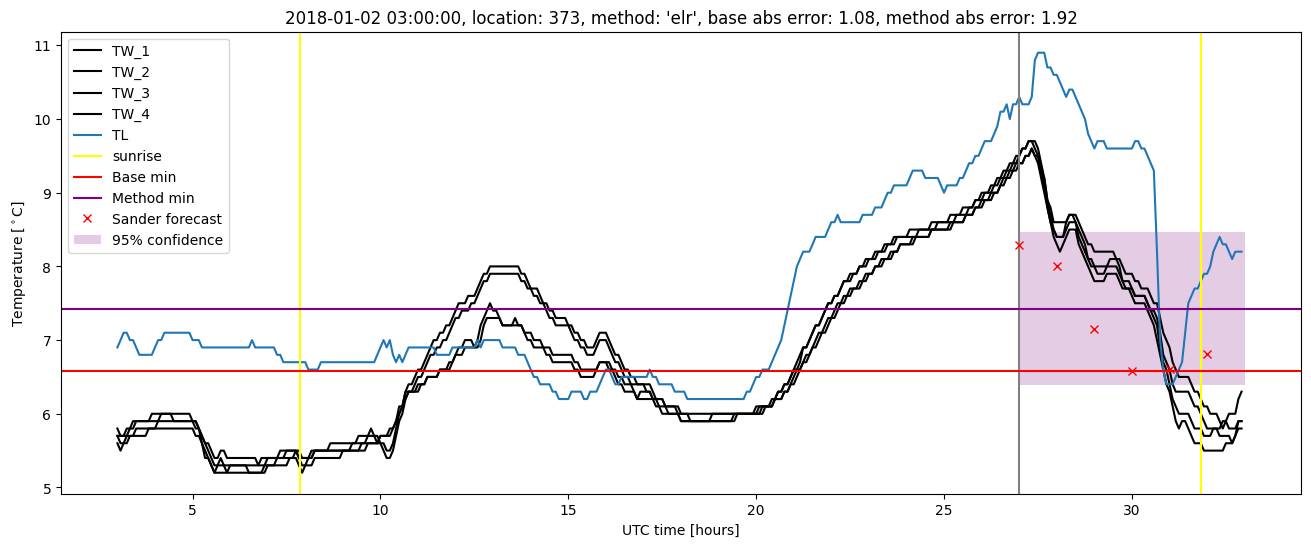
Extended logistic regression results
| names |
period |
power |
significance |
meanSquareError |
absError |
maxError |
CRPS |
IGN |
| baseline |
winter 2016 |
1.000 |
0.045 |
0.402 |
0.478 |
2.043 |
NaN |
NaN |
| elr |
winter 2016 |
1.000 |
0.091 |
0.429 |
0.500 |
2.042 |
0.535 |
2.534 |
| baseline |
winter 2017 |
0.984 |
0.037 |
0.462 |
0.512 |
2.269 |
NaN |
NaN |
| elr |
winter 2017 |
0.968 |
0.037 |
0.366 |
0.460 |
1.666 |
0.504 |
2.591 |
| baseline |
winter 2018 |
0.987 |
0.059 |
0.347 |
0.438 |
2.300 |
NaN |
NaN |
| elr |
winter 2018 |
0.987 |
0.118 |
0.294 |
0.405 |
2.023 |
0.518 |
2.414 |
| baseline |
winter 2019 |
1.000 |
0.083 |
0.547 |
0.552 |
2.605 |
NaN |
NaN |
| elr |
winter 2019 |
1.000 |
0.250 |
0.551 |
0.546 |
2.400 |
0.486 |
2.421 |
| baseline |
all |
0.993 |
0.051 |
0.435 |
0.492 |
2.605 |
NaN |
NaN |
| elr |
all |
0.990 |
0.103 |
0.409 |
0.478 |
2.400 |
0.513 |
2.491 |
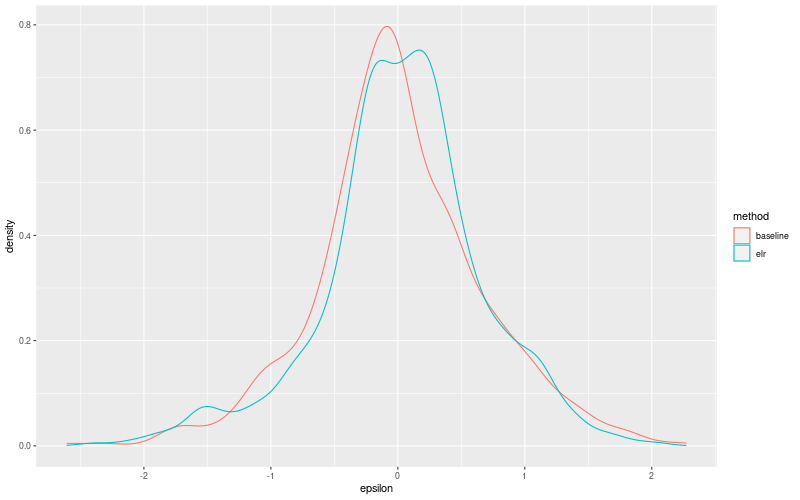
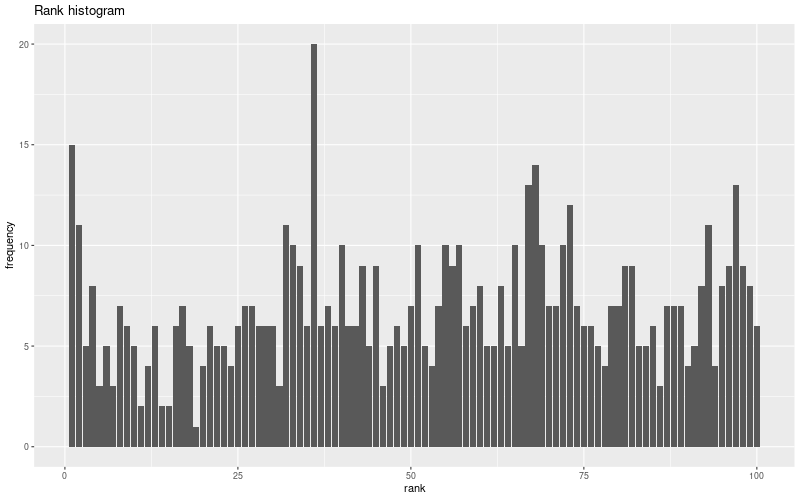
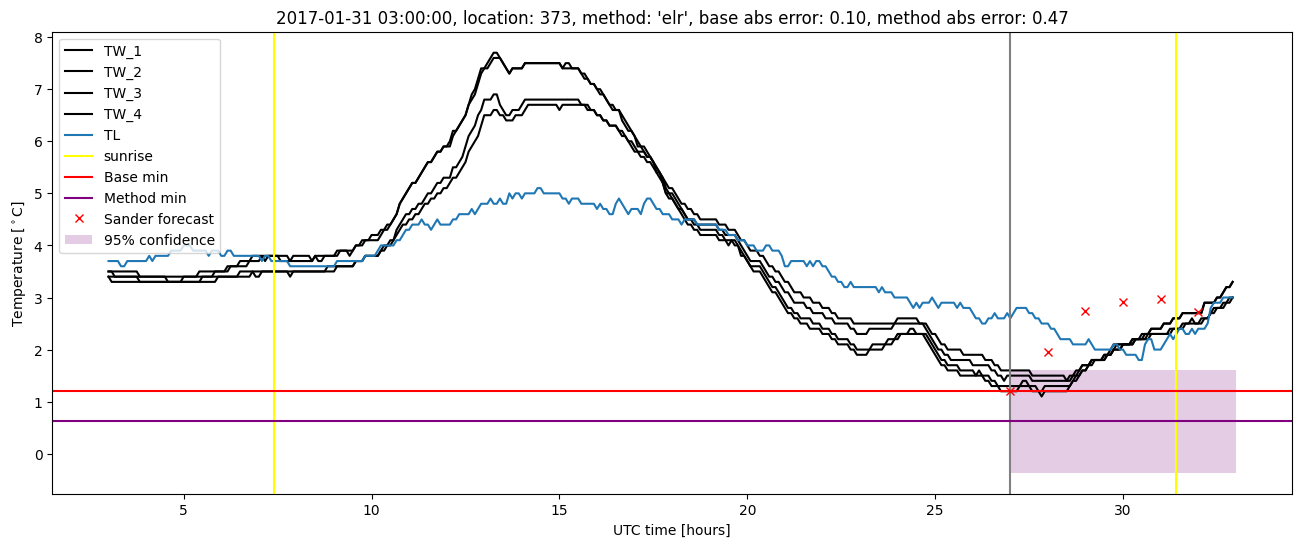
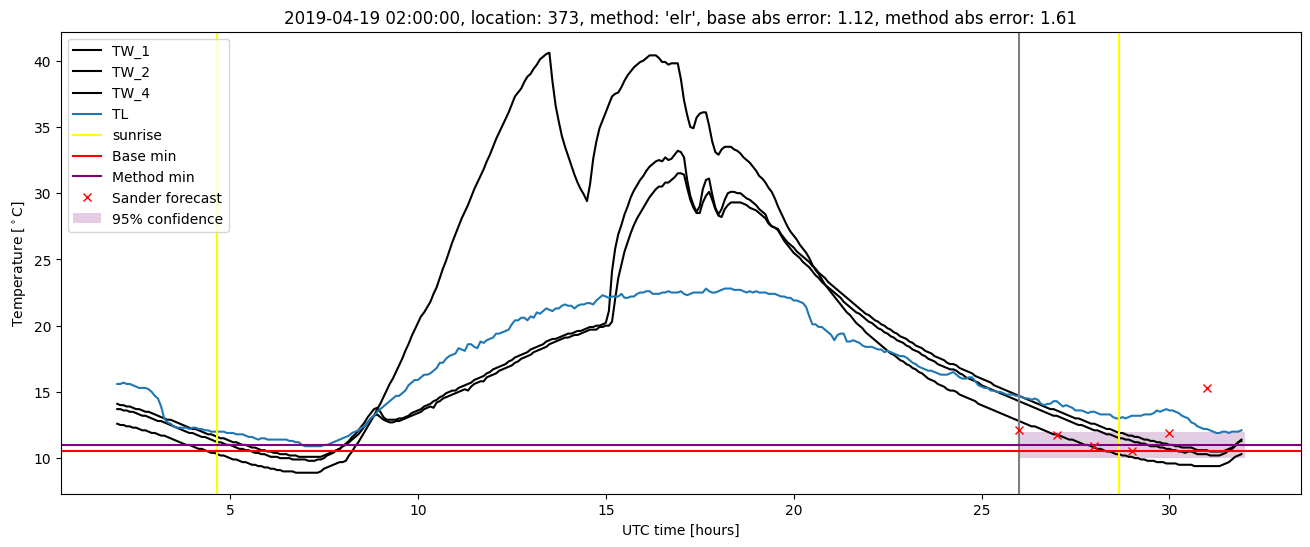
Extended logistic regression plots