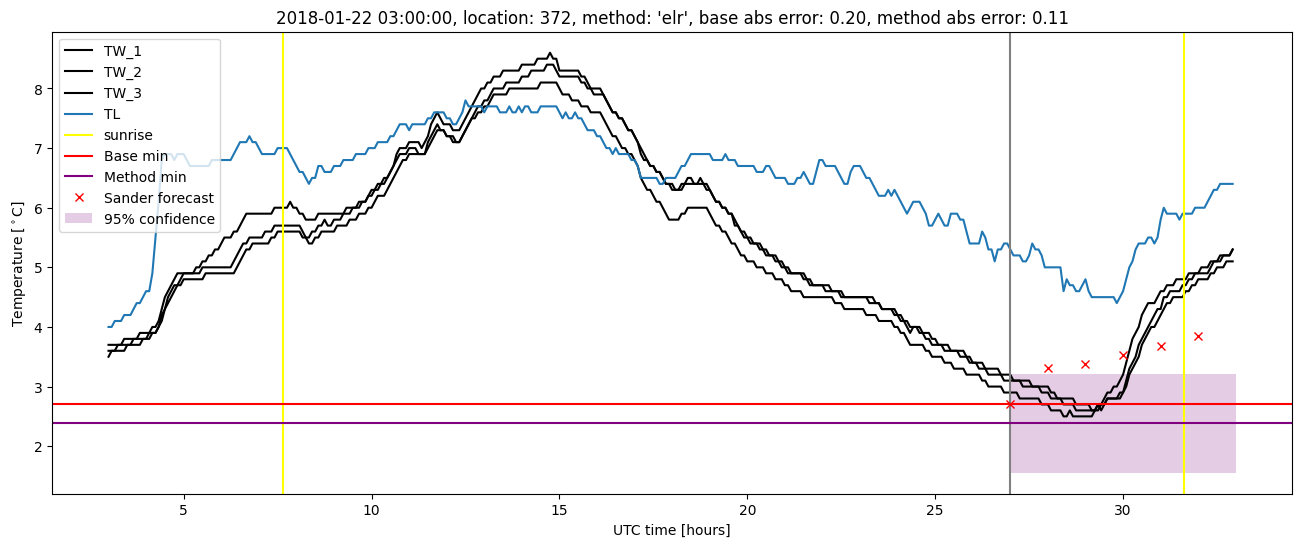
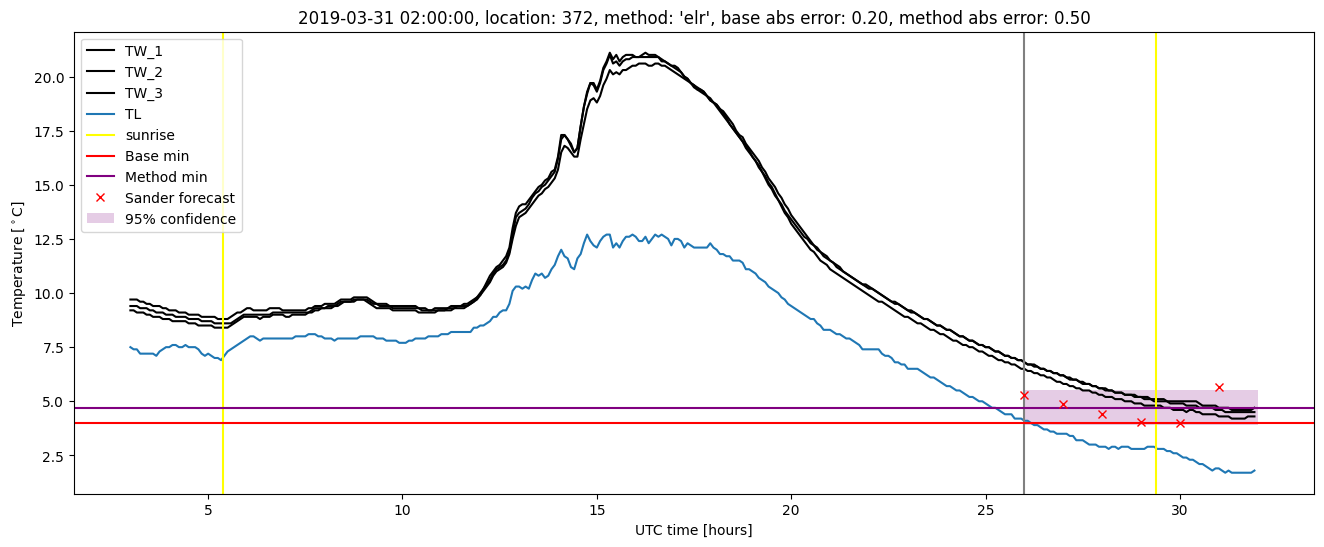
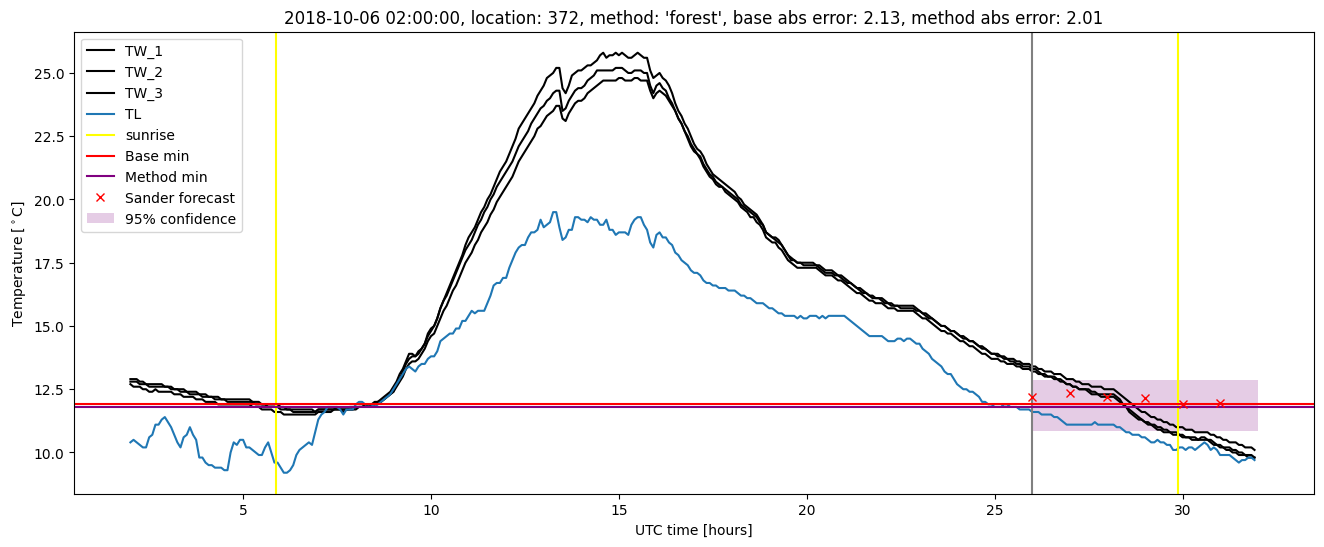
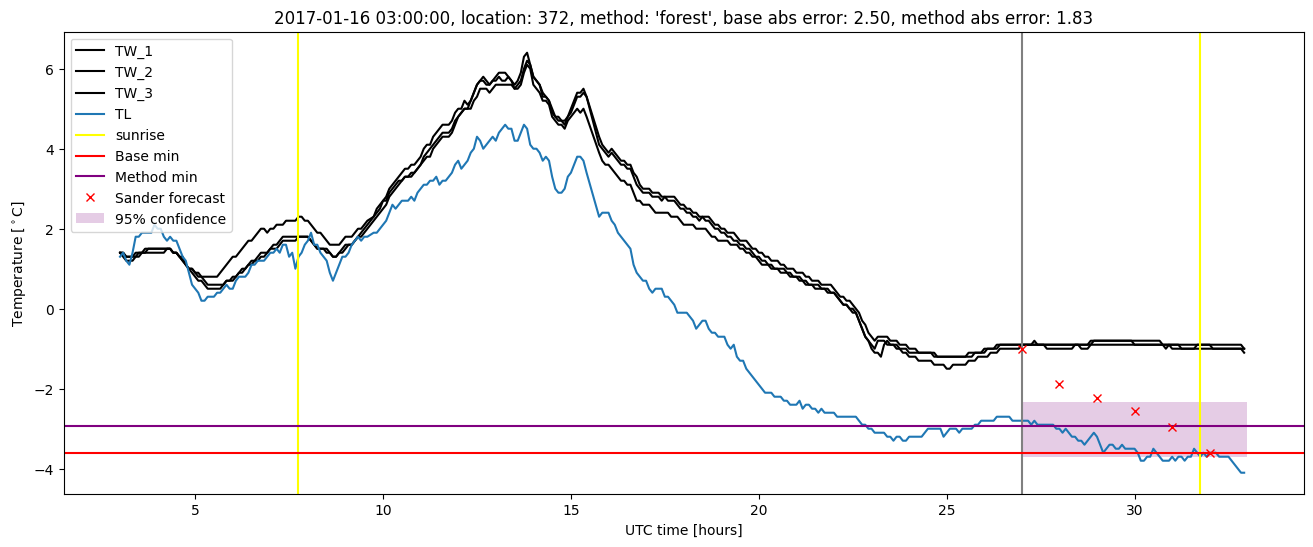
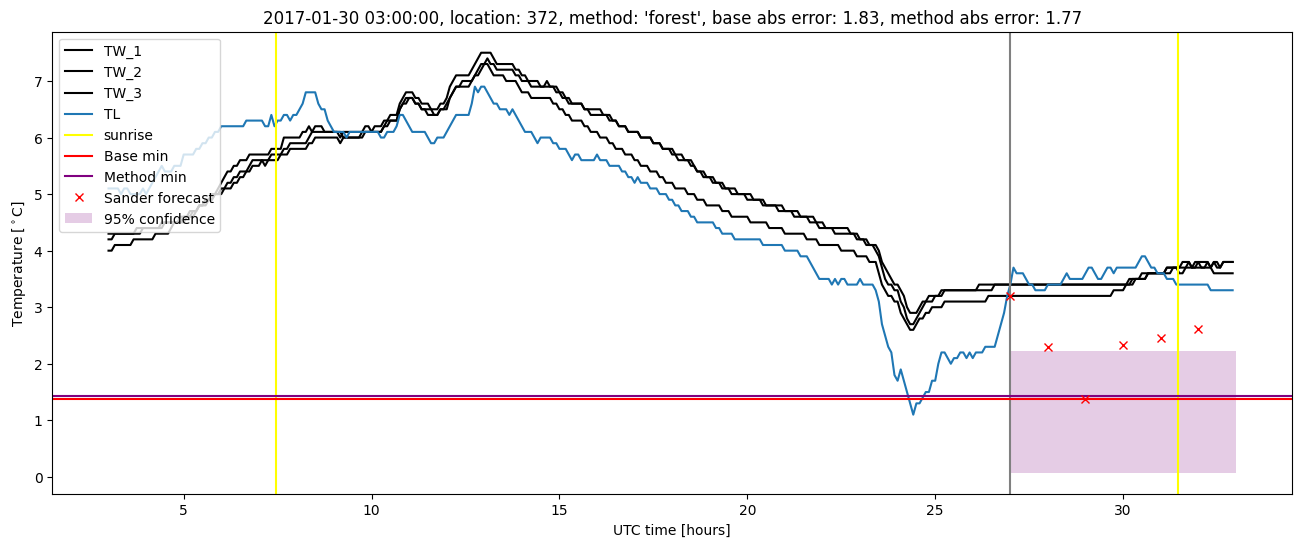
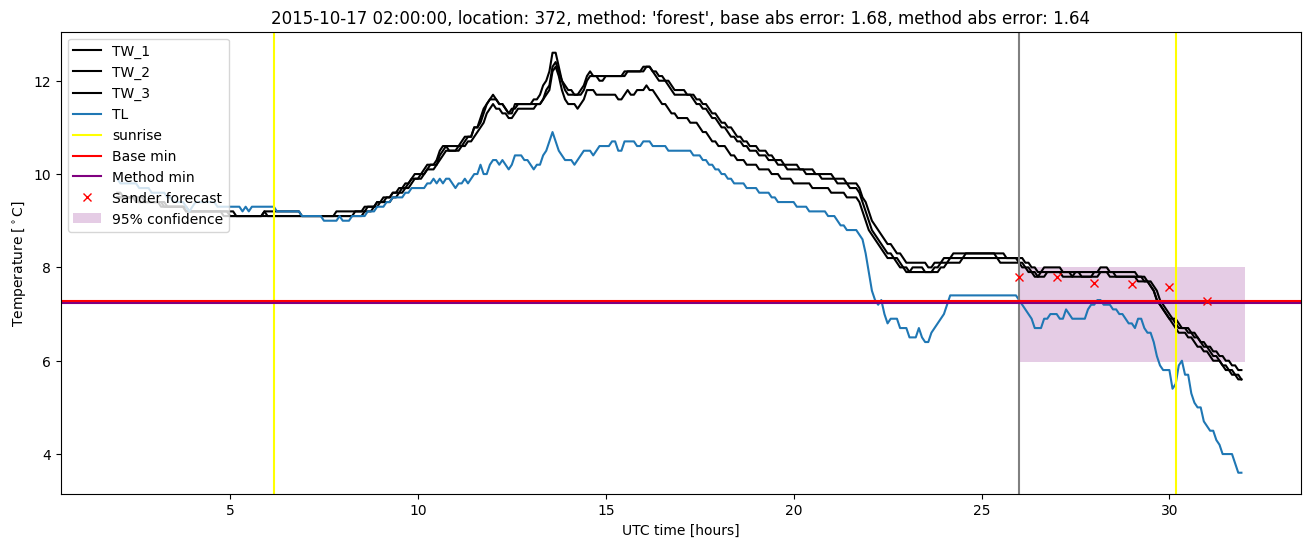
GMS location: 372
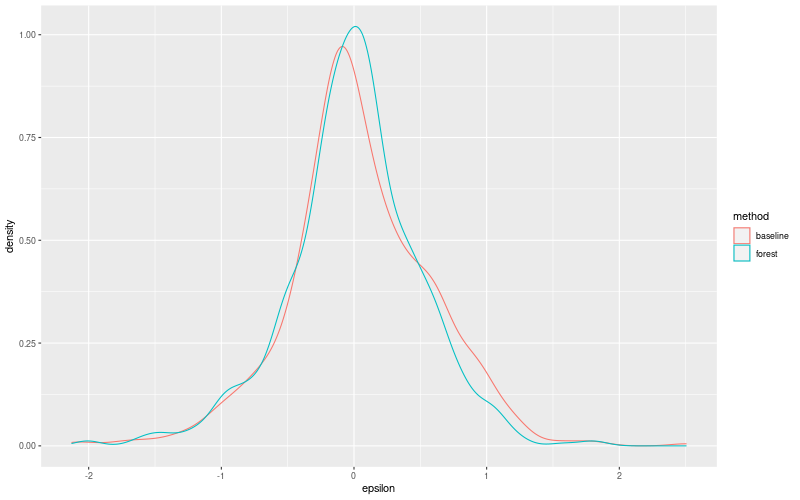
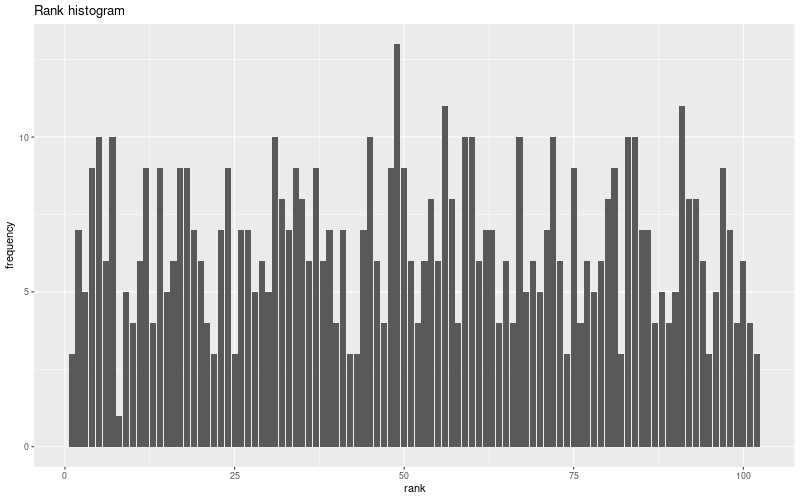
Random forest results
| names |
period |
power |
significance |
meanSquareError |
absError |
maxError |
CRPS |
IGN |
| baseline |
winter 2016 |
0.995 |
0.000e+00 |
0.295 |
0.412 |
2.020 |
NaN |
NaN |
| forest |
winter 2016 |
1.000 |
0.154 |
0.288 |
0.404 |
2.010 |
0.449 |
5.856 |
| baseline |
winter 2017 |
0.962 |
0.000e+00 |
0.364 |
0.434 |
2.504 |
NaN |
NaN |
| forest |
winter 2017 |
0.985 |
0.000e+00 |
0.275 |
0.384 |
1.833 |
0.467 |
4.235 |
| baseline |
winter 2018 |
0.974 |
0.062 |
0.270 |
0.406 |
1.603 |
NaN |
NaN |
| forest |
winter 2018 |
0.974 |
0.125 |
0.214 |
0.350 |
1.572 |
0.477 |
3.767 |
| baseline |
winter 2019 |
0.993 |
0.167 |
0.263 |
0.372 |
2.127 |
NaN |
NaN |
| forest |
winter 2019 |
0.993 |
0.167 |
0.214 |
0.338 |
2.006 |
0.481 |
4.235 |
| baseline |
all |
0.982 |
0.035 |
0.298 |
0.407 |
2.504 |
NaN |
NaN |
| forest |
all |
0.989 |
0.088 |
0.251 |
0.372 |
2.010 |
0.467 |
4.617 |
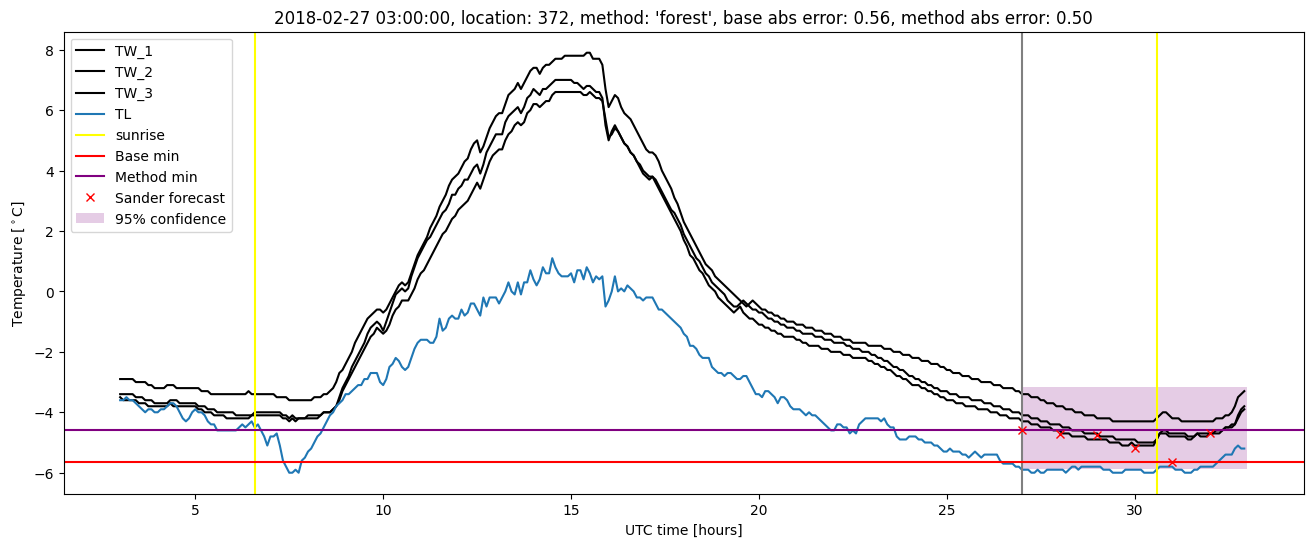
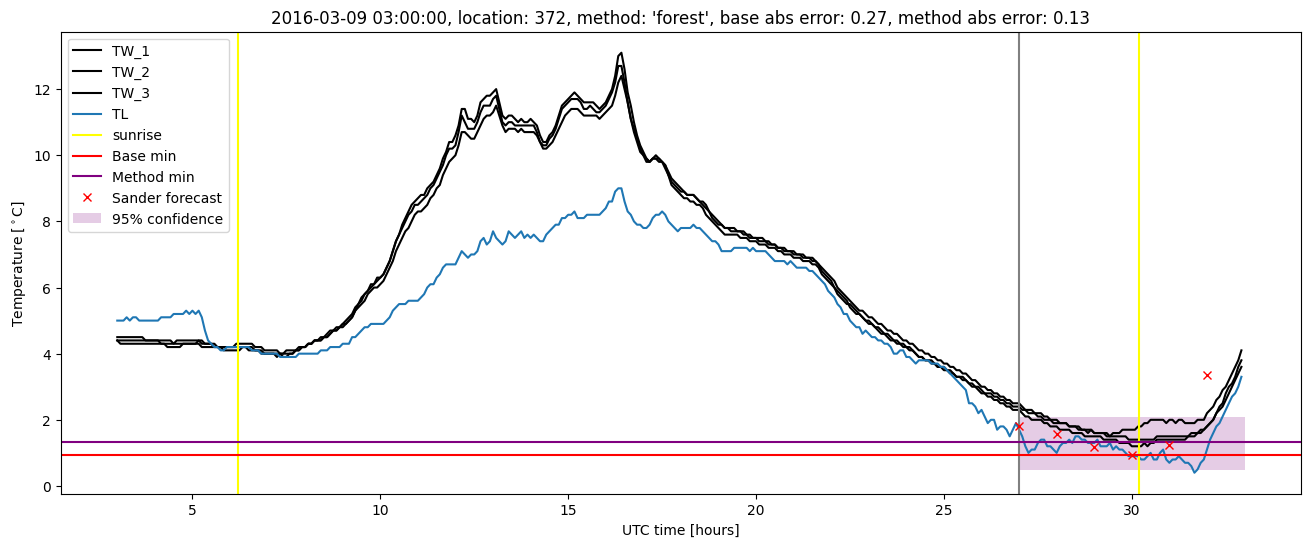
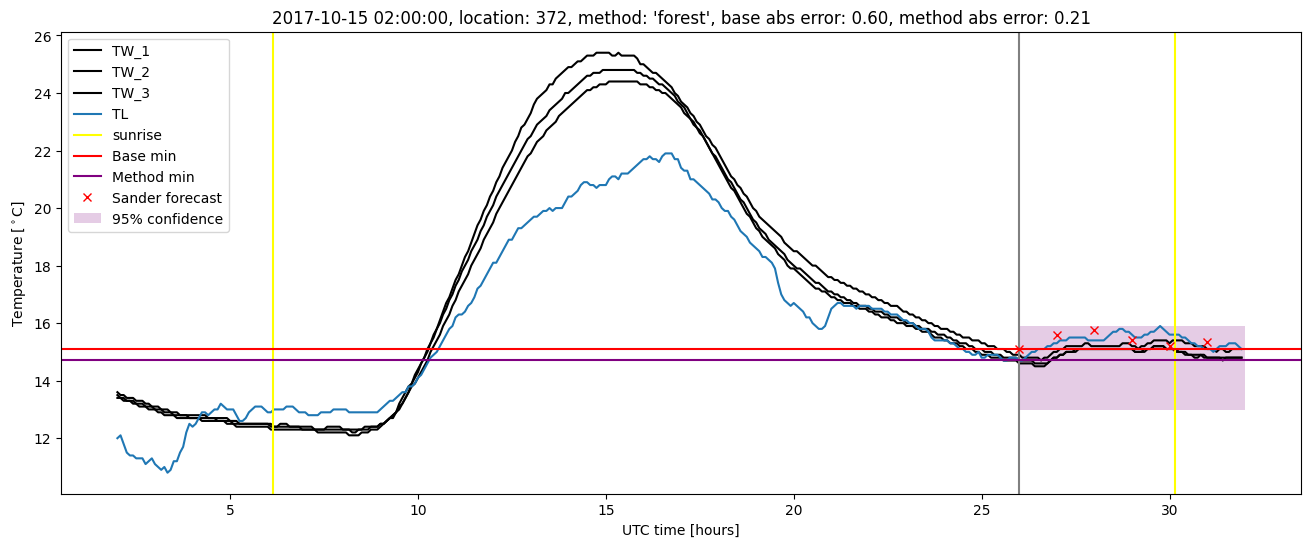
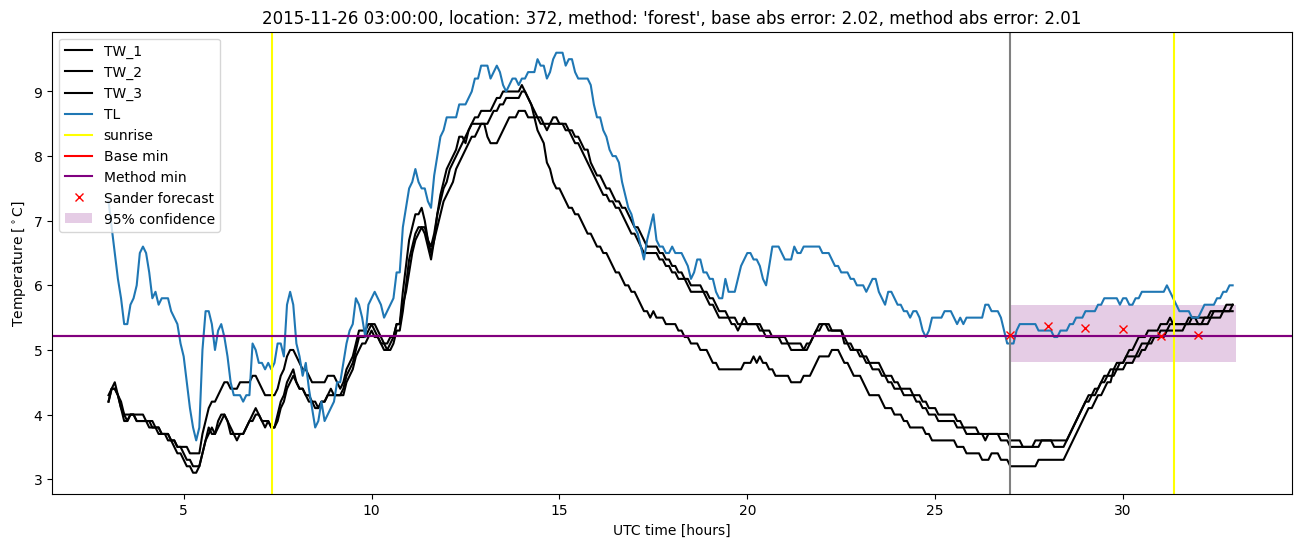
Random forest plots
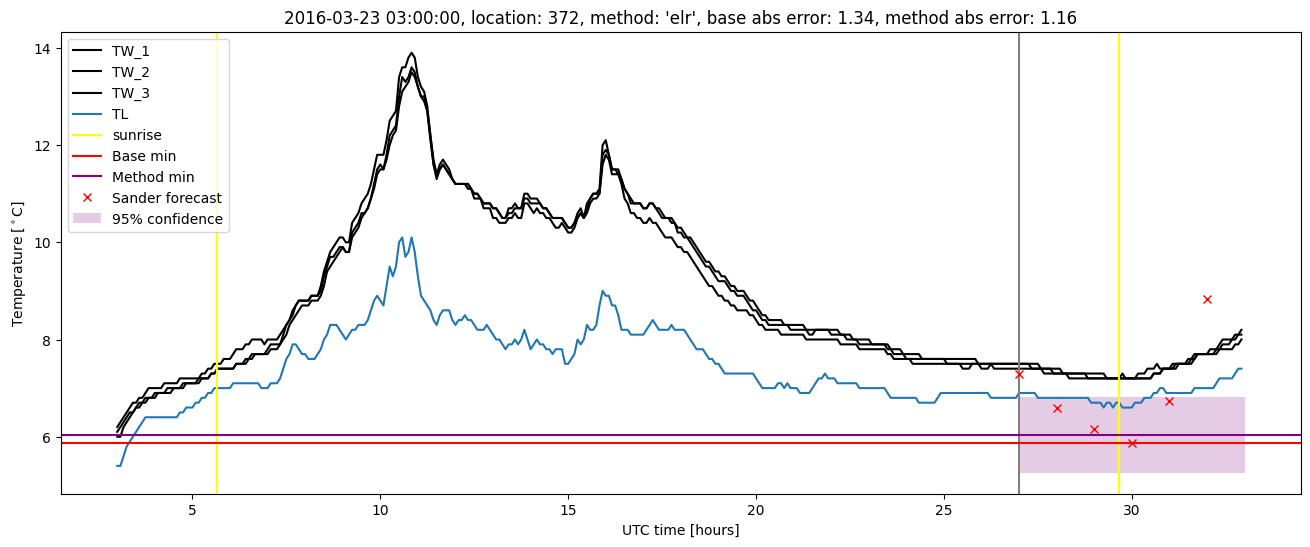
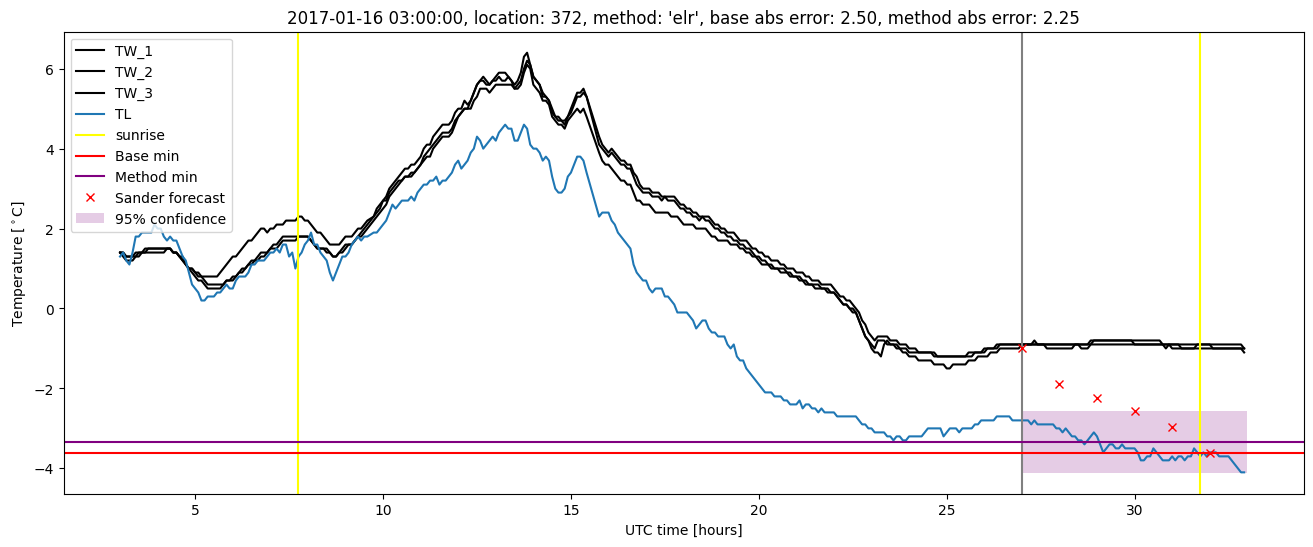
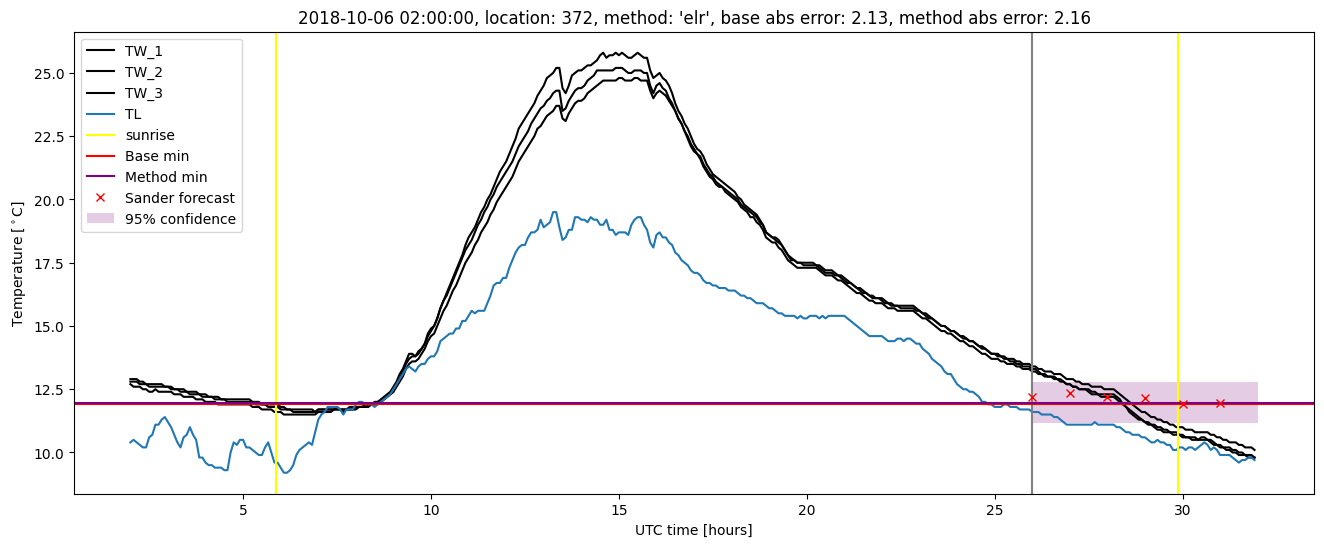
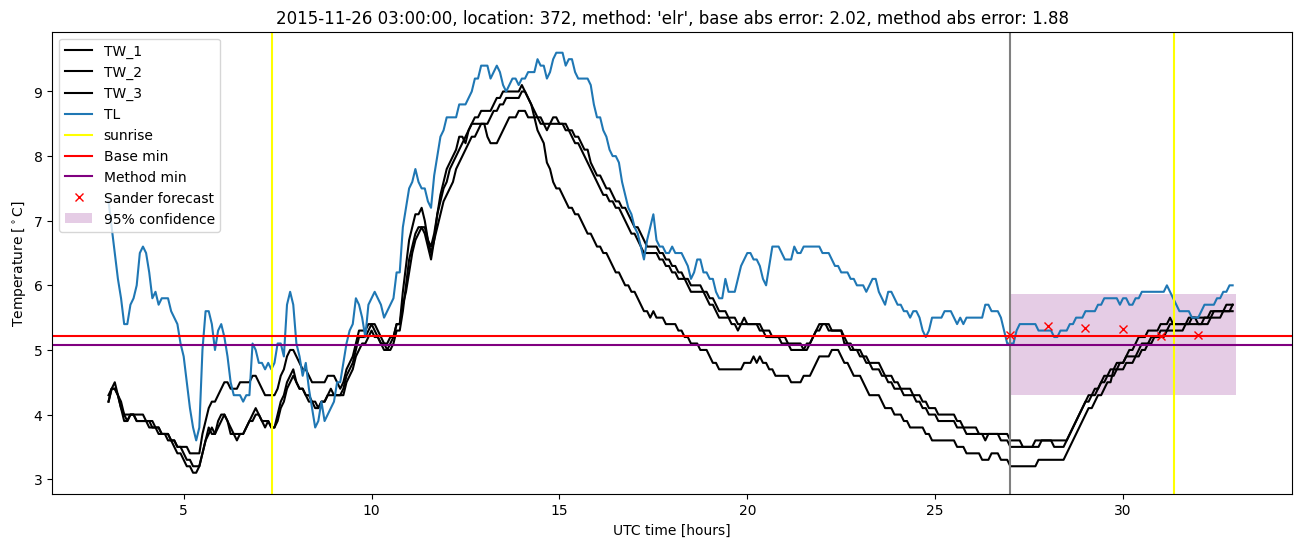
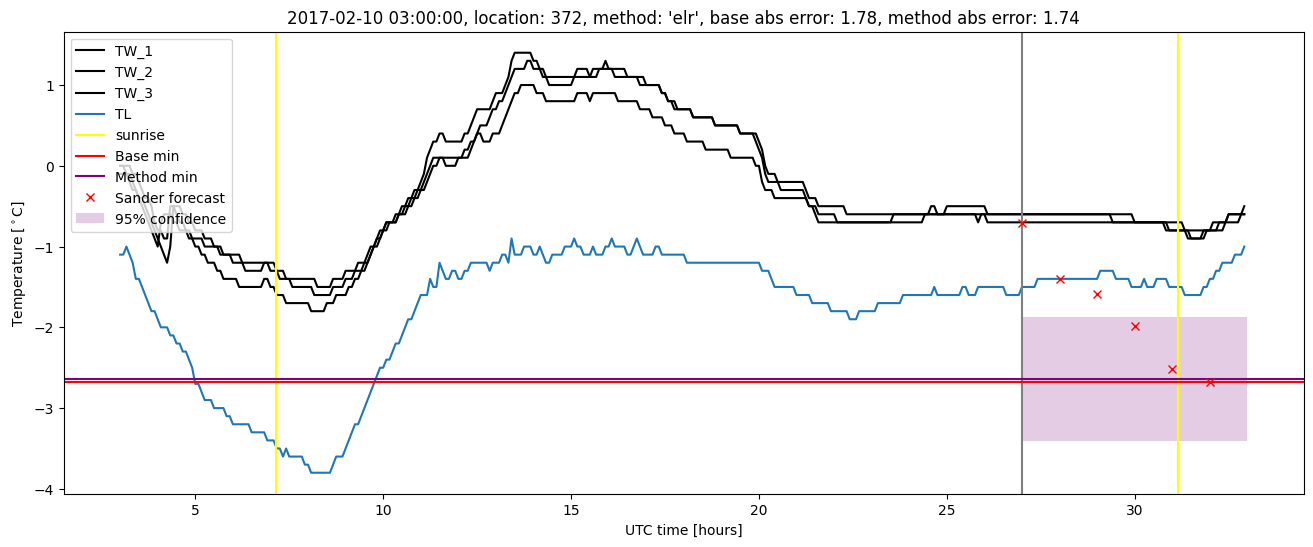
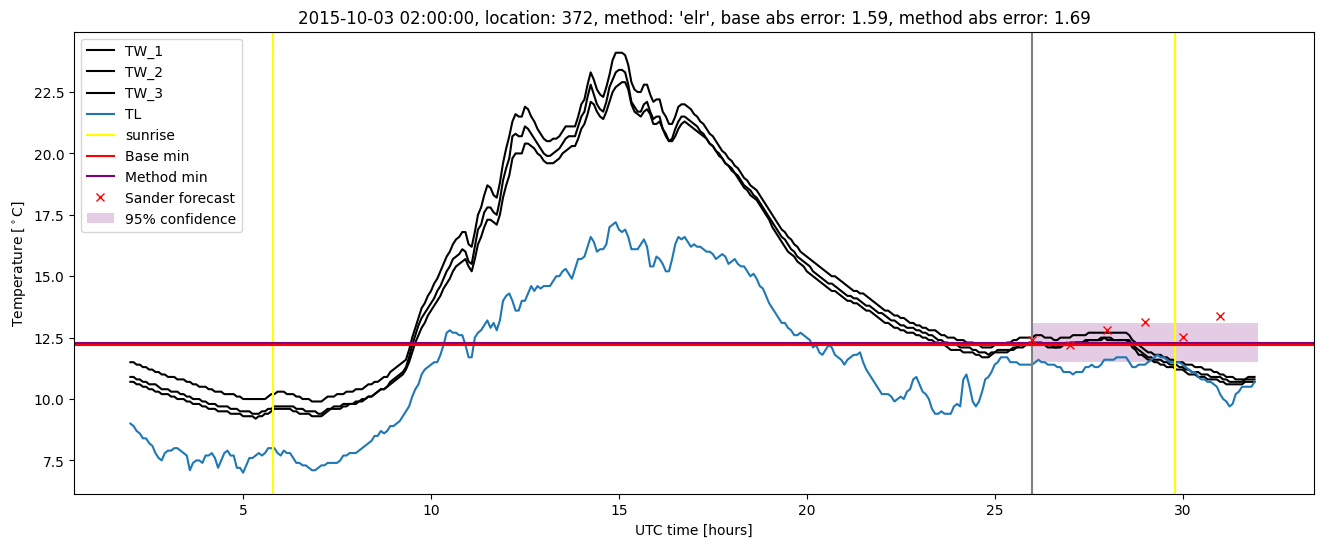
Extended logistic regression results
| names |
period |
power |
significance |
meanSquareError |
absError |
maxError |
CRPS |
IGN |
| baseline |
winter 2016 |
0.995 |
0.000e+00 |
0.295 |
0.412 |
2.020 |
NaN |
NaN |
| elr |
winter 2016 |
1.000 |
0.077 |
0.300 |
0.419 |
1.884 |
0.513 |
5.885 |
| baseline |
winter 2017 |
0.962 |
0.000e+00 |
0.364 |
0.434 |
2.504 |
NaN |
NaN |
| elr |
winter 2017 |
0.970 |
0.000e+00 |
0.334 |
0.432 |
2.246 |
0.549 |
7.454 |
| baseline |
winter 2018 |
0.974 |
0.062 |
0.270 |
0.406 |
1.603 |
NaN |
NaN |
| elr |
winter 2018 |
0.980 |
0.062 |
0.227 |
0.366 |
1.581 |
0.530 |
5.042 |
| baseline |
winter 2019 |
0.993 |
0.167 |
0.263 |
0.372 |
2.127 |
NaN |
NaN |
| elr |
winter 2019 |
0.993 |
0.000e+00 |
0.240 |
0.368 |
2.164 |
0.548 |
5.688 |
| baseline |
all |
0.982 |
0.035 |
0.298 |
0.407 |
2.504 |
NaN |
NaN |
| elr |
all |
0.987 |
0.035 |
0.277 |
0.398 |
2.246 |
0.533 |
5.992 |
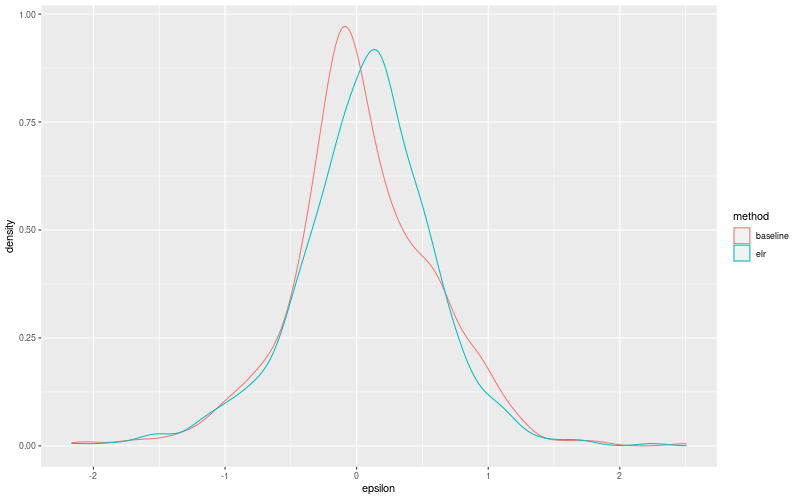
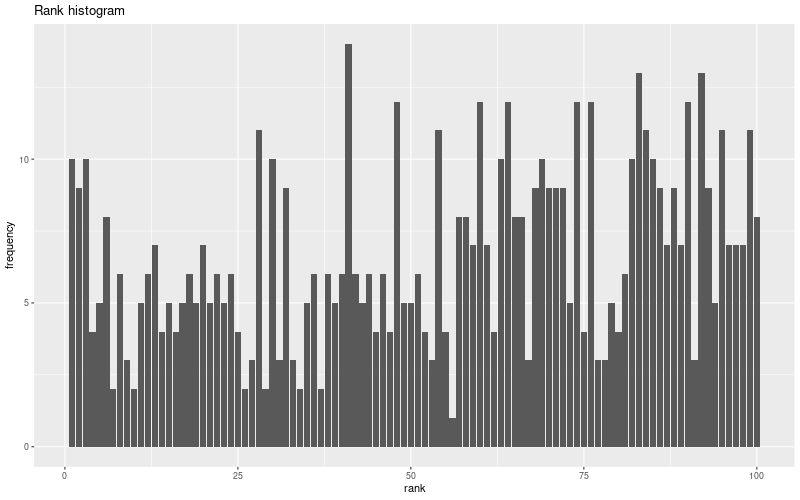
Extended logistic regression plots