GMS location: 371
Random forest results
| names |
period |
power |
significance |
meanSquareError |
absError |
maxError |
CRPS |
IGN |
| baseline |
winter 2016 |
1.000 |
0.182 |
0.275 |
0.402 |
1.644 |
NaN |
NaN |
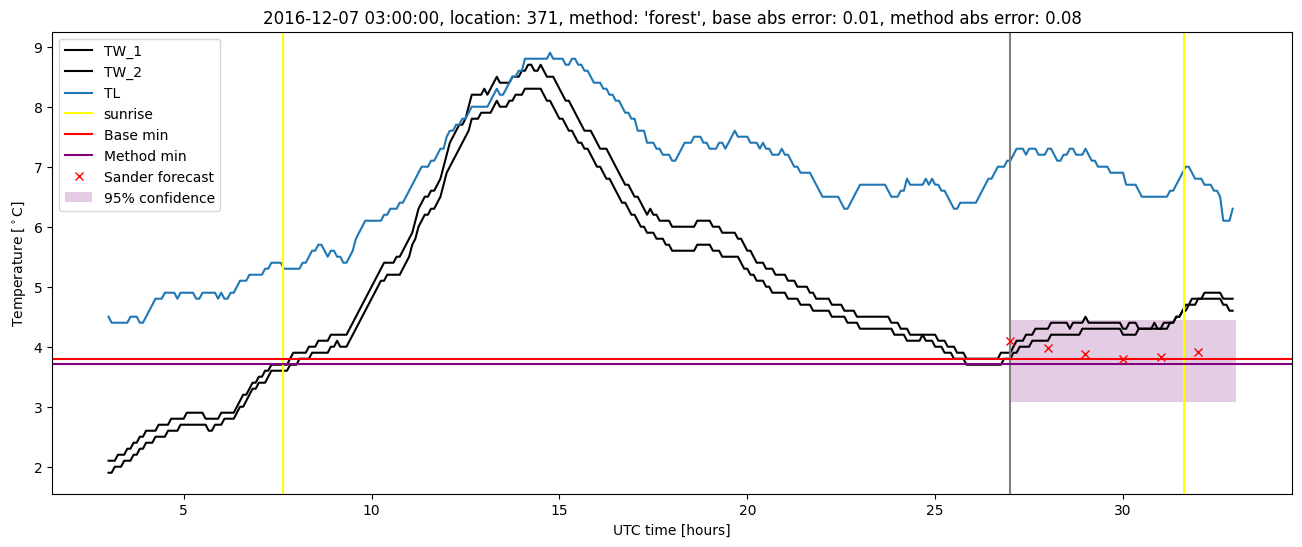
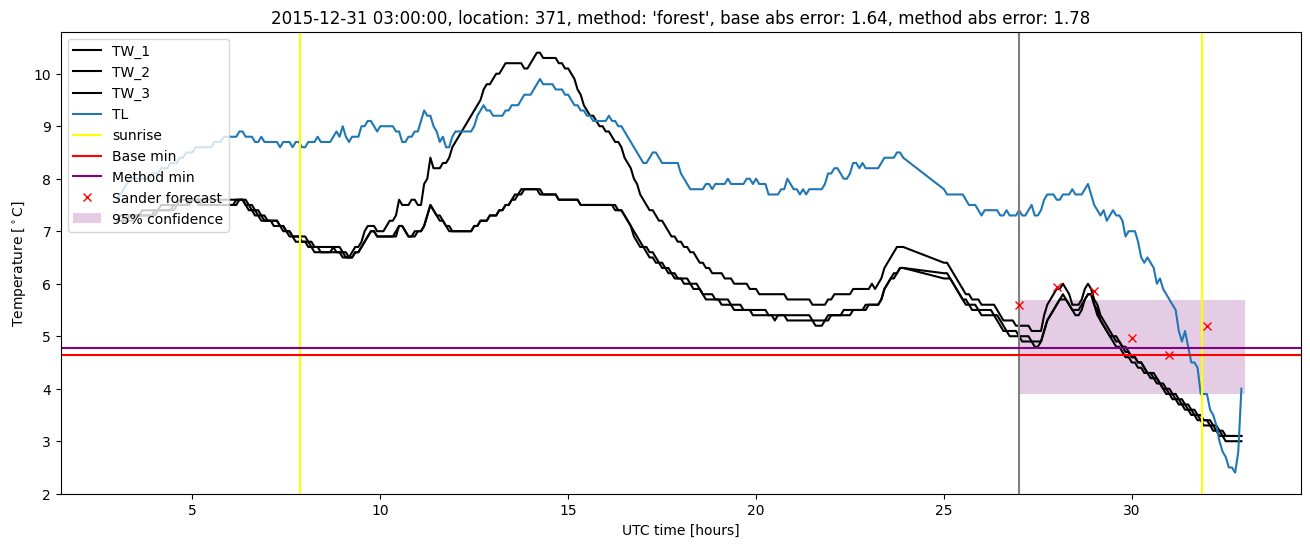
| forest |
winter 2016 |
1.000 |
0.273 |
0.271 |
0.401 |
1.783 |
0.481 |
4.167 |
| baseline |
winter 2017 |
0.970 |
0.056 |
0.484 |
0.501 |
2.228 |
NaN |
NaN |
| forest |
winter 2017 |
0.980 |
0.056 |
0.364 |
0.446 |
1.777 |
0.473 |
4.829 |
| baseline |
winter 2018 |
0.970 |
0.000e+00 |
0.268 |
0.409 |
1.502 |
NaN |
NaN |
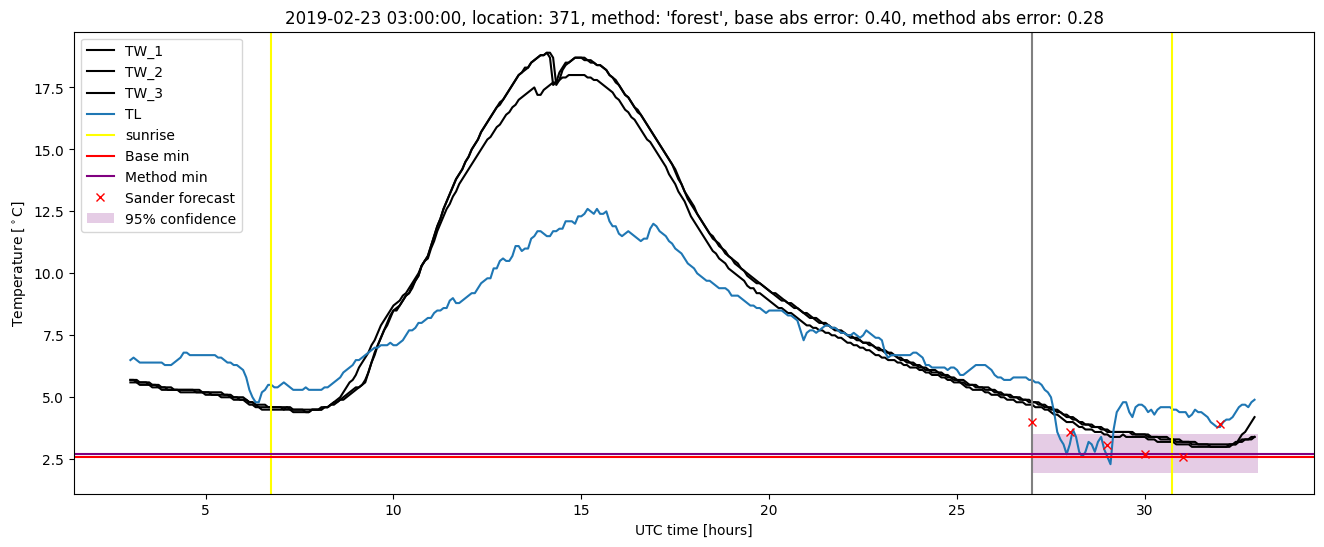
| forest |
winter 2018 |
0.976 |
0.133 |
0.215 |
0.356 |
1.381 |
0.495 |
3.252 |
| baseline |
winter 2019 |
0.987 |
0.000e+00 |
0.248 |
0.362 |
2.004 |
NaN |
NaN |
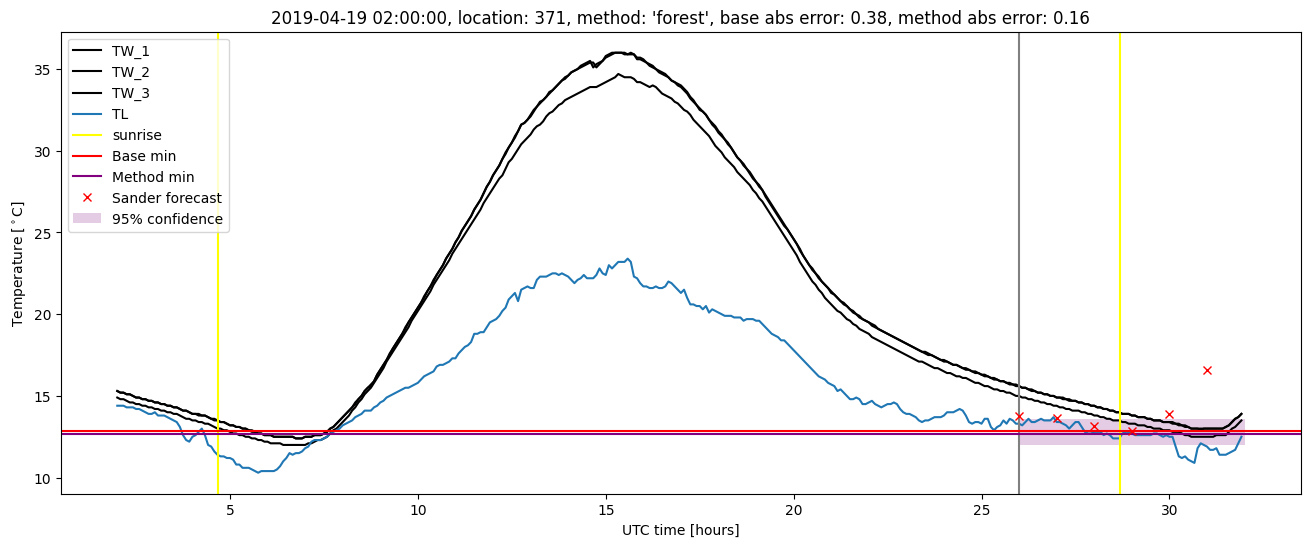
| forest |
winter 2019 |
0.994 |
0.000e+00 |
0.206 |
0.340 |
1.605 |
0.503 |
3.812 |
| baseline |
all |
0.984 |
0.059 |
0.304 |
0.412 |
2.228 |
NaN |
NaN |
| forest |
all |
0.989 |
0.118 |
0.256 |
0.382 |
1.783 |
0.488 |
3.947 |
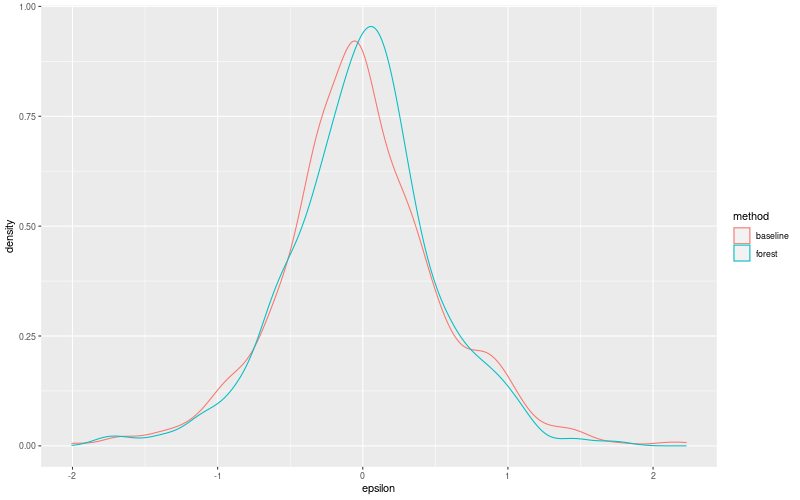
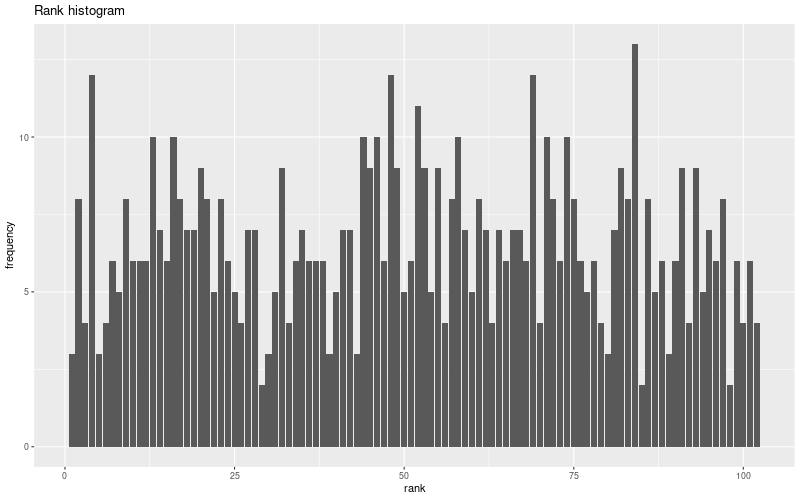
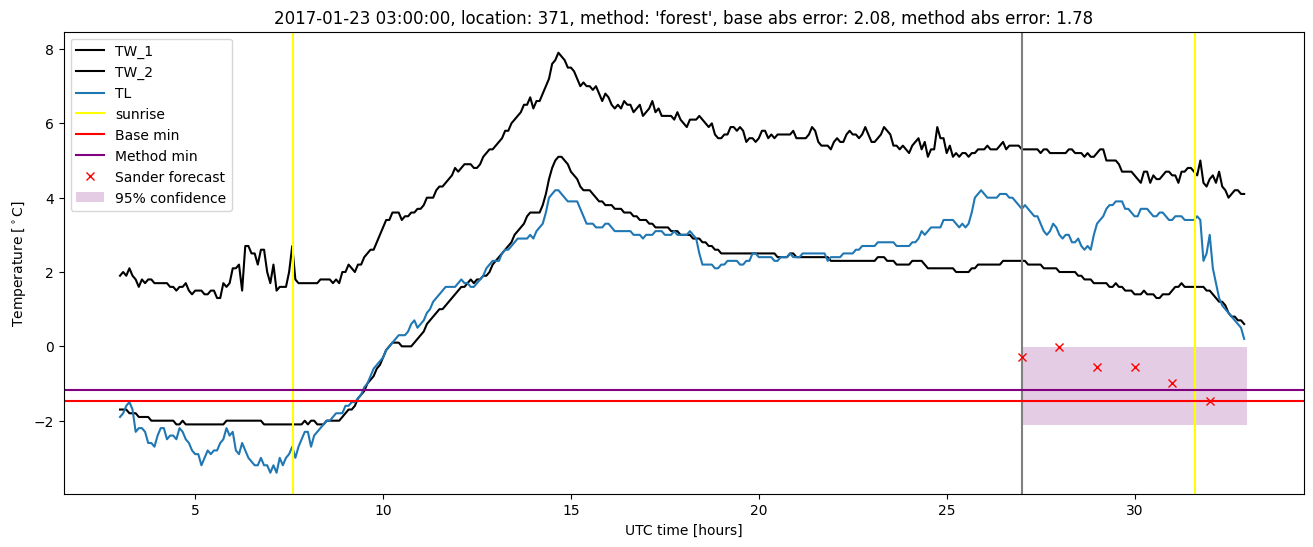
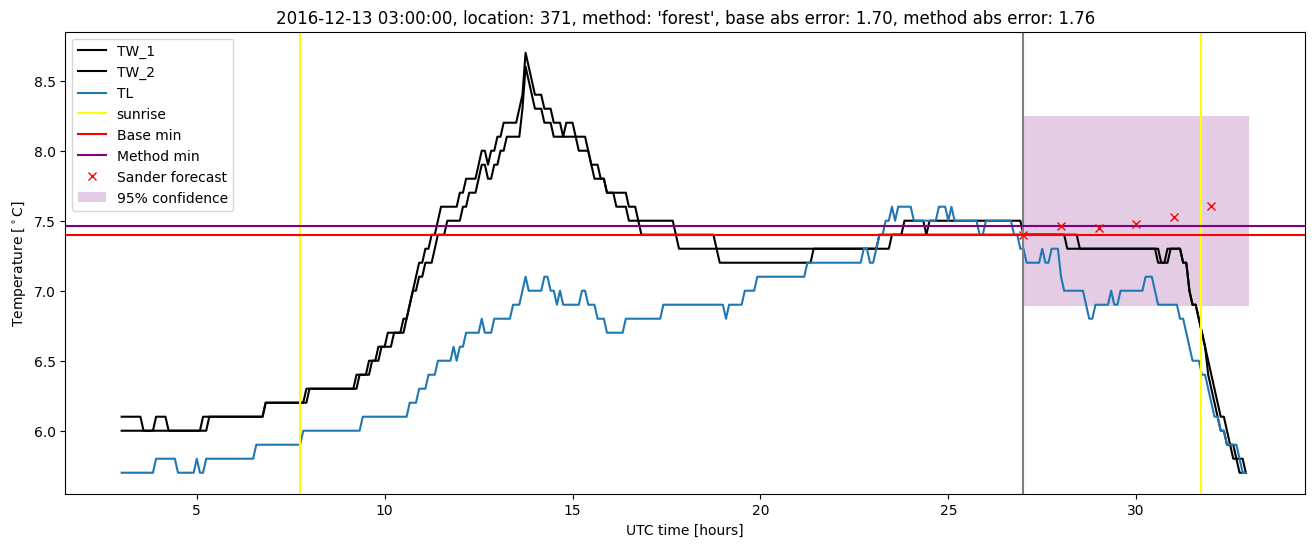
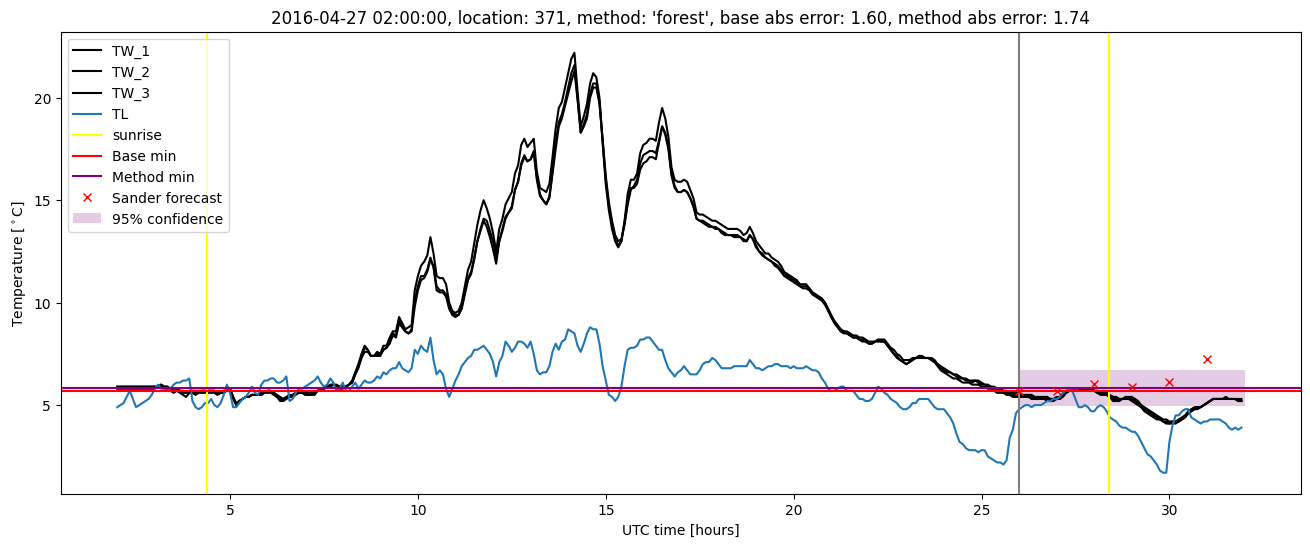
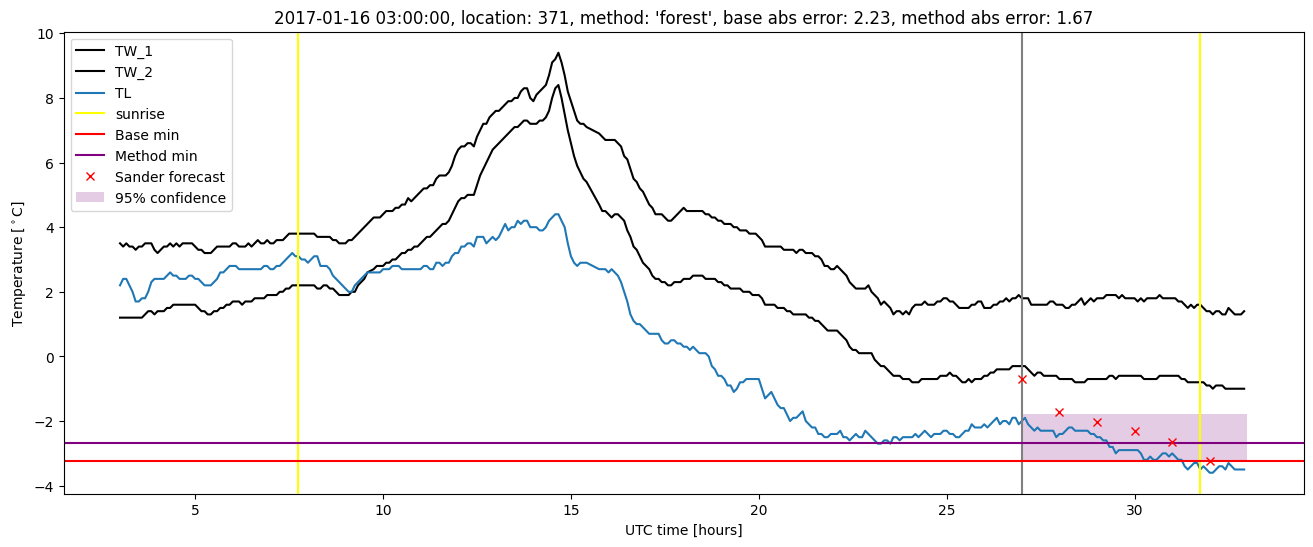
Random forest plots
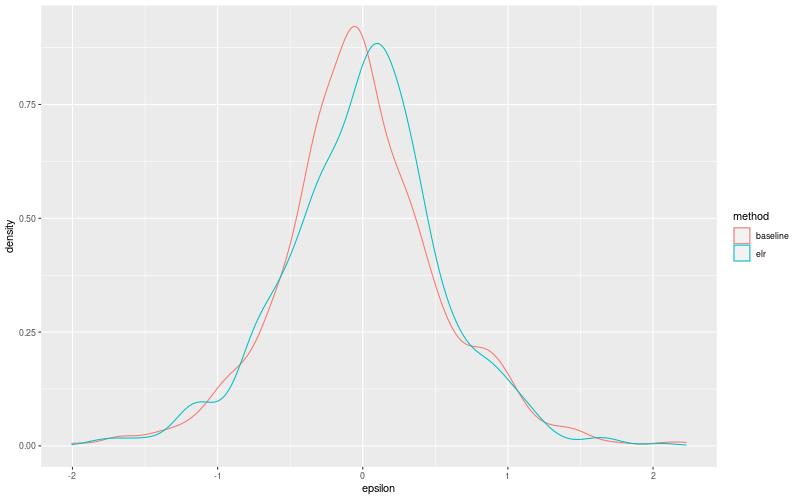
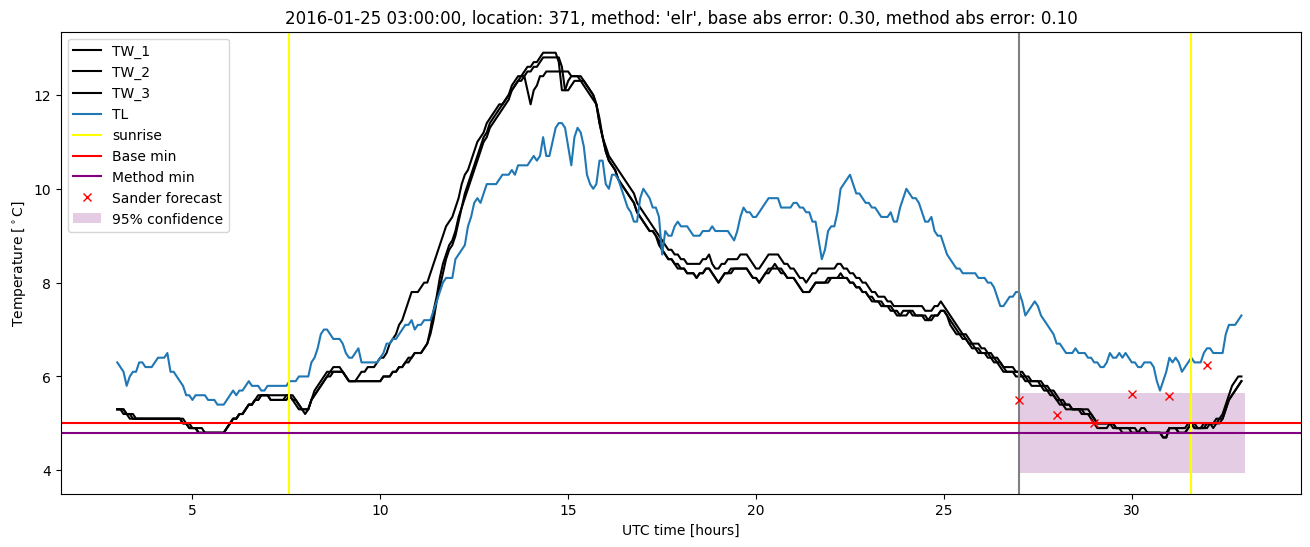
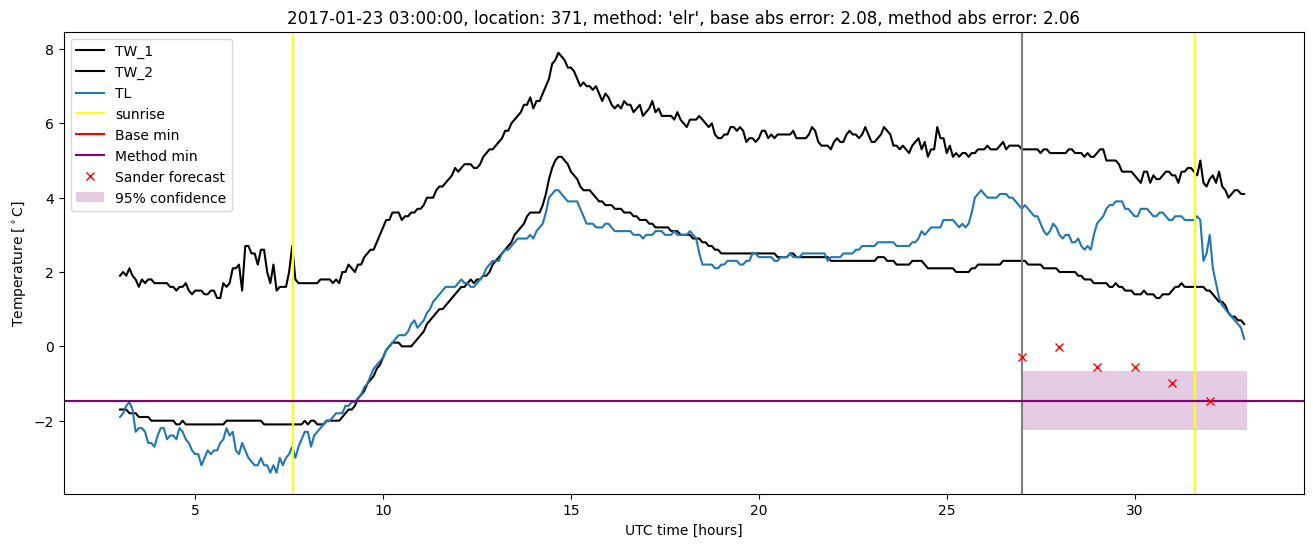
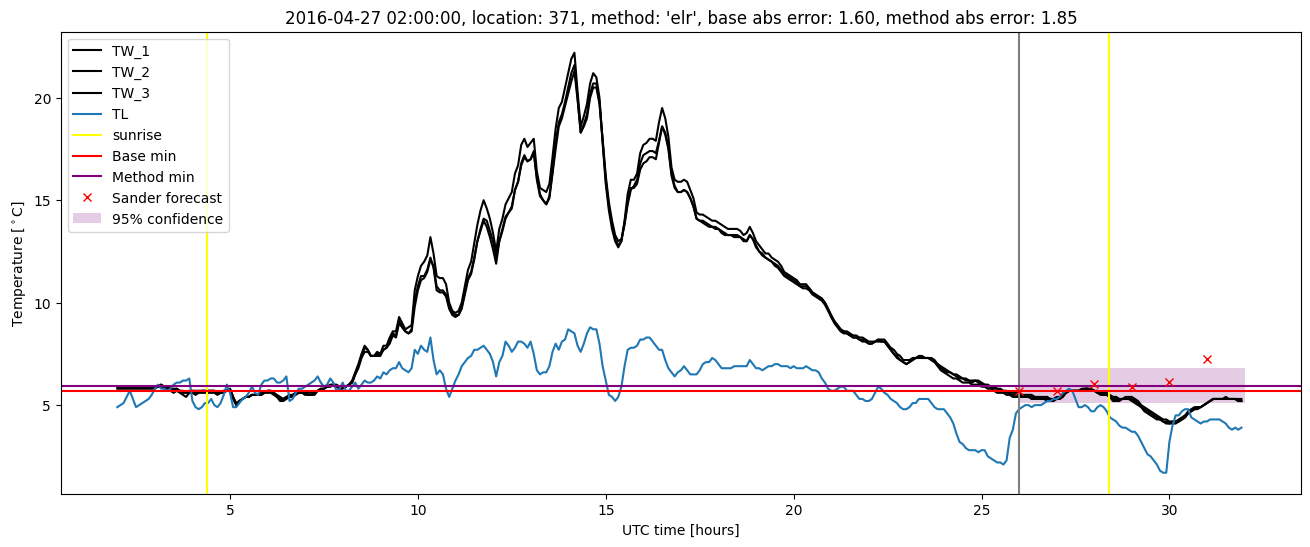
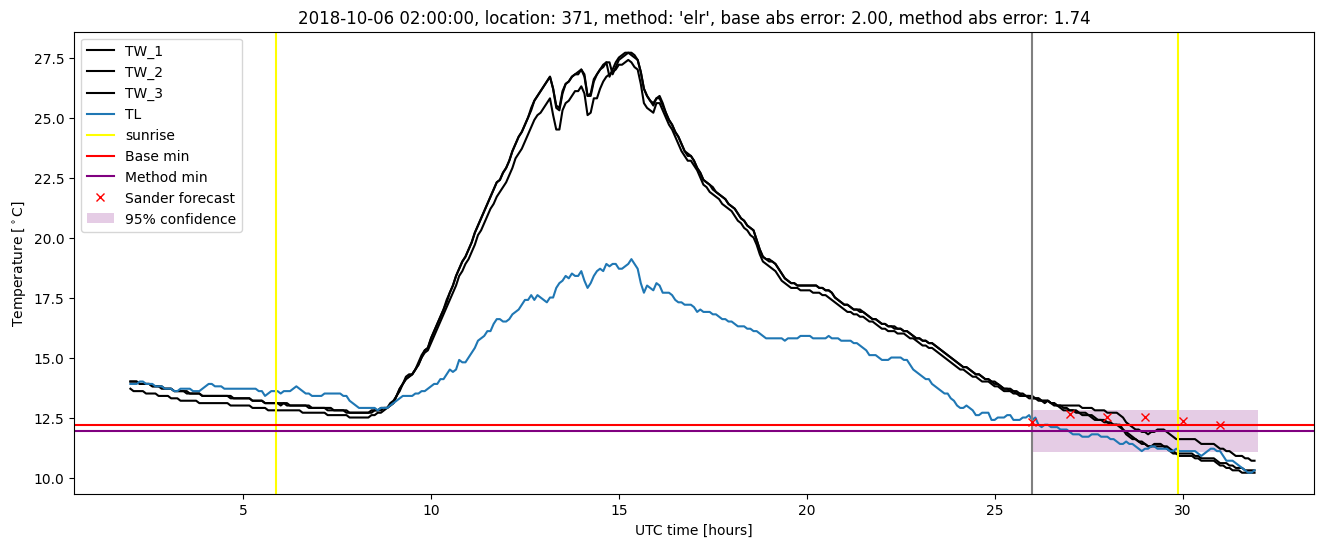
Extended logistic regression results
| names |
period |
power |
significance |
meanSquareError |
absError |
maxError |
CRPS |
IGN |
| baseline |
winter 2016 |
1.000 |
0.182 |
0.275 |
0.402 |
1.644 |
NaN |
NaN |
| elr |
winter 2016 |
1.000 |
0.273 |
0.305 |
0.423 |
1.851 |
0.527 |
4.672 |
| baseline |
winter 2017 |
0.970 |
0.056 |
0.484 |
0.501 |
2.228 |
NaN |
NaN |
| elr |
winter 2017 |
0.970 |
0.000e+00 |
0.412 |
0.473 |
2.060 |
0.491 |
5.308 |
| baseline |
winter 2018 |
0.970 |
0.000e+00 |
0.268 |
0.409 |
1.502 |
NaN |
NaN |
| elr |
winter 2018 |
0.976 |
0.000e+00 |
0.258 |
0.406 |
1.344 |
0.535 |
4.488 |
| baseline |
winter 2019 |
0.987 |
0.000e+00 |
0.248 |
0.362 |
2.004 |
NaN |
NaN |
| elr |
winter 2019 |
0.994 |
0.000e+00 |
0.211 |
0.349 |
1.744 |
0.501 |
3.797 |
| baseline |
all |
0.984 |
0.059 |
0.304 |
0.412 |
2.228 |
NaN |
NaN |
| elr |
all |
0.987 |
0.059 |
0.288 |
0.409 |
2.060 |
0.516 |
4.522 |
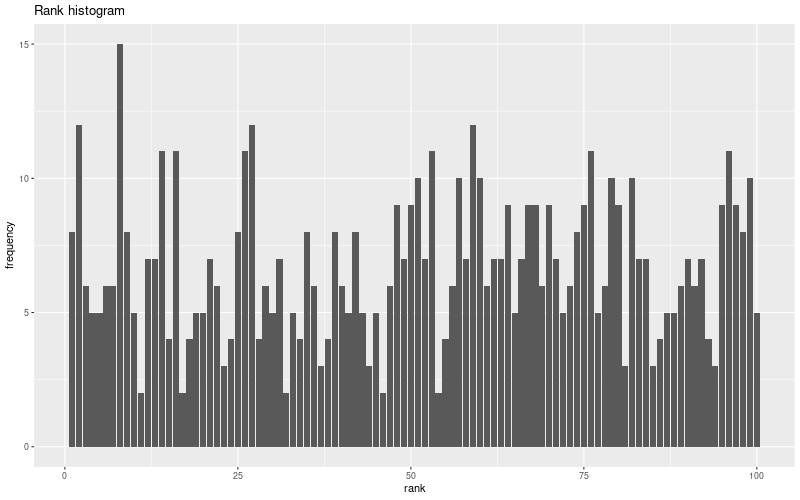
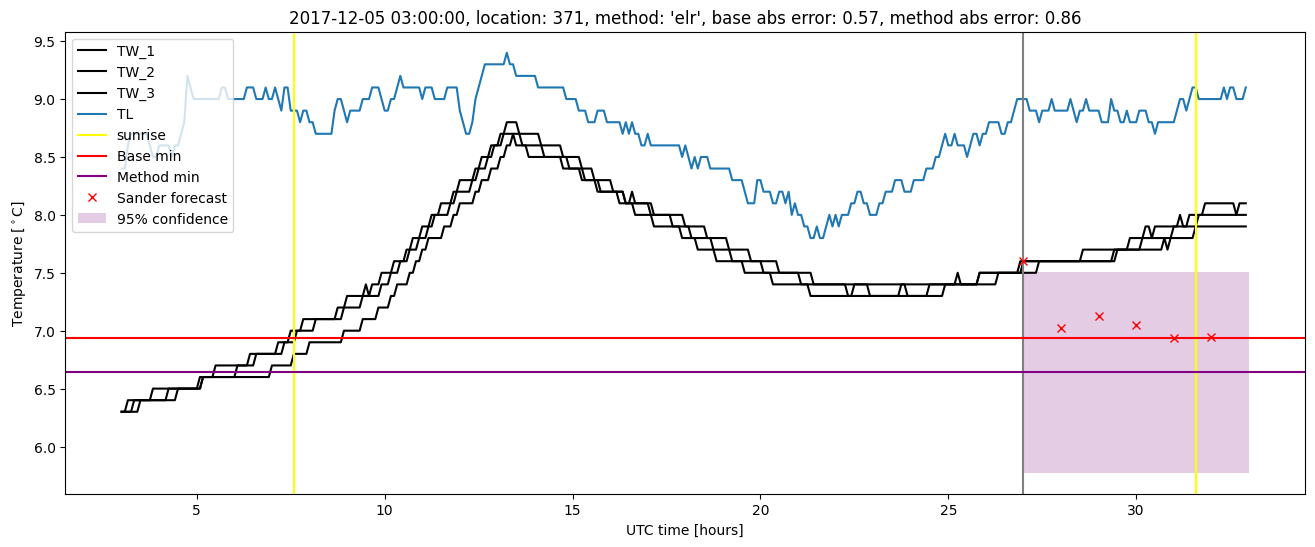
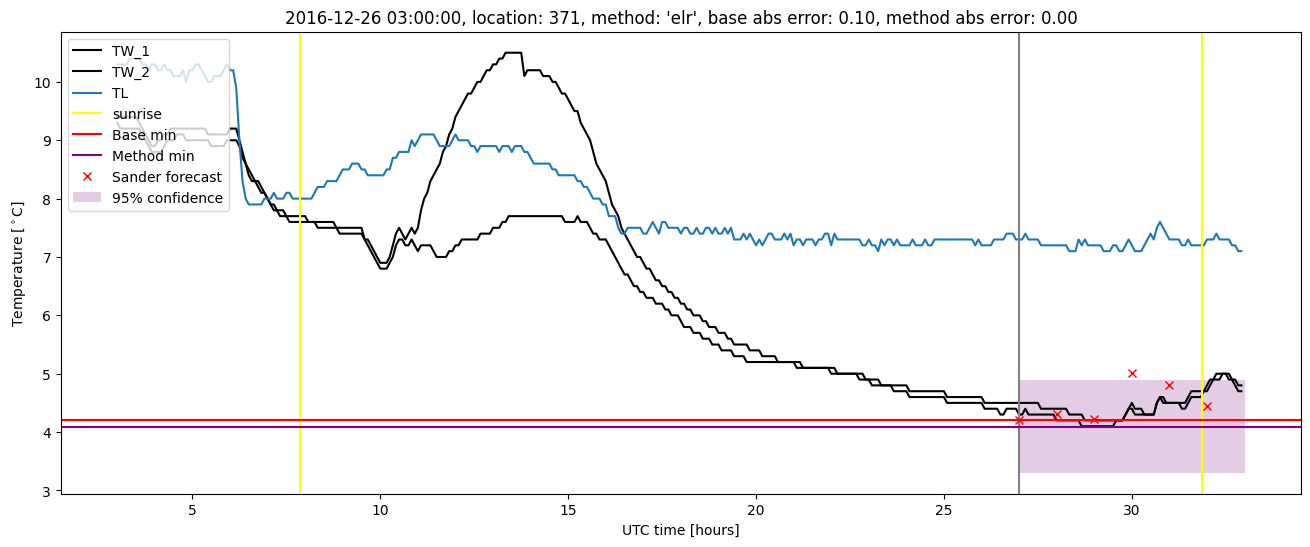
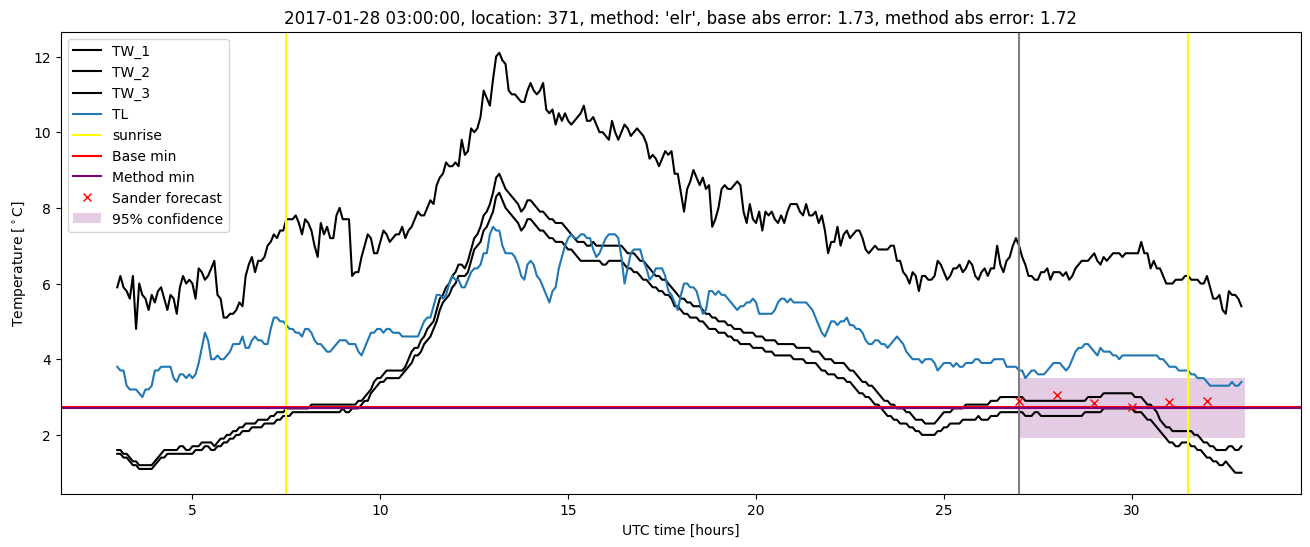
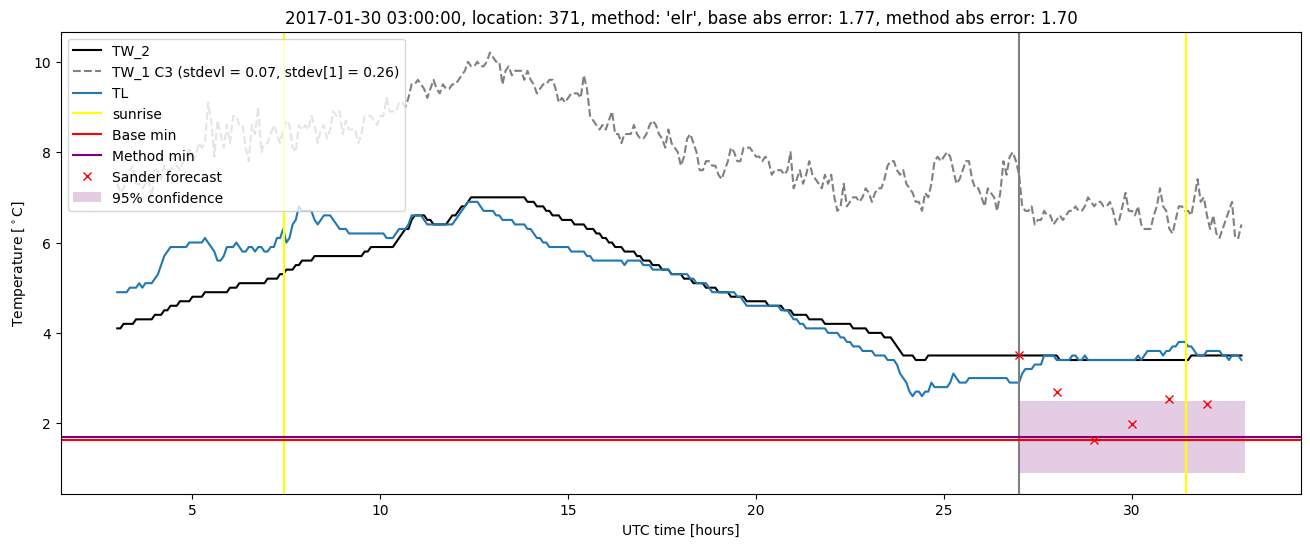
Extended logistic regression plots