GMS location: 364
Random forest results
| names |
period |
power |
significance |
meanSquareError |
absError |
maxError |
CRPS |
IGN |
| baseline |
winter 2016 |
0.991 |
0.000e+00 |
0.289 |
0.424 |
1.339 |
NaN |
NaN |
| forest |
winter 2016 |
0.991 |
0.000e+00 |
0.252 |
0.373 |
1.560 |
0.469 |
4.638 |
| baseline |
winter 2017 |
0.968 |
0.000e+00 |
0.303 |
0.428 |
2.151 |
NaN |
NaN |
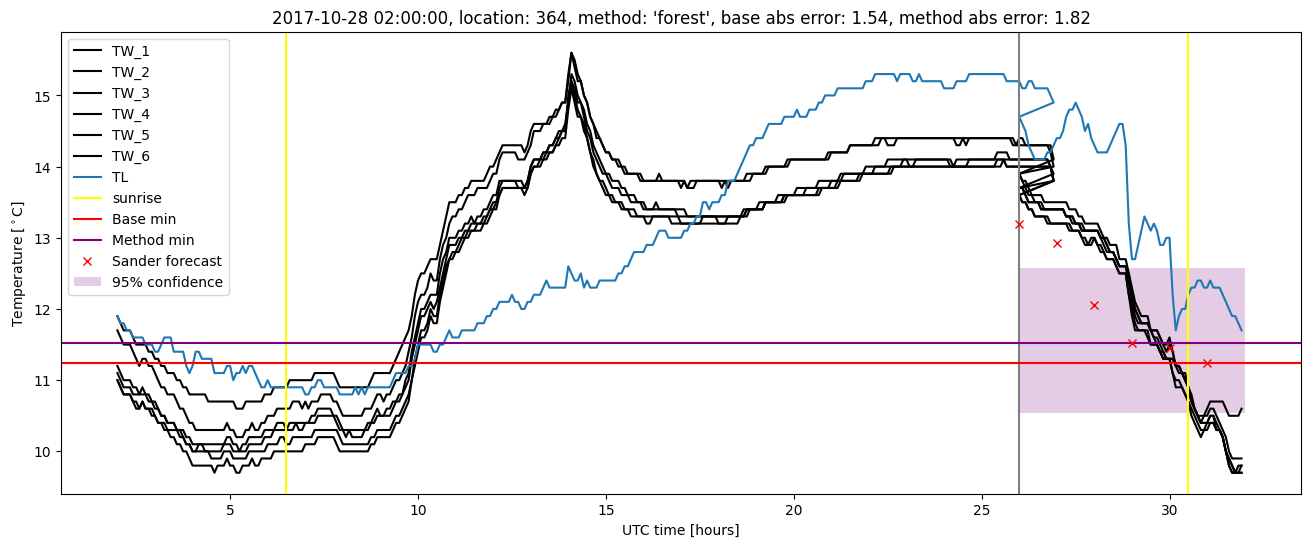
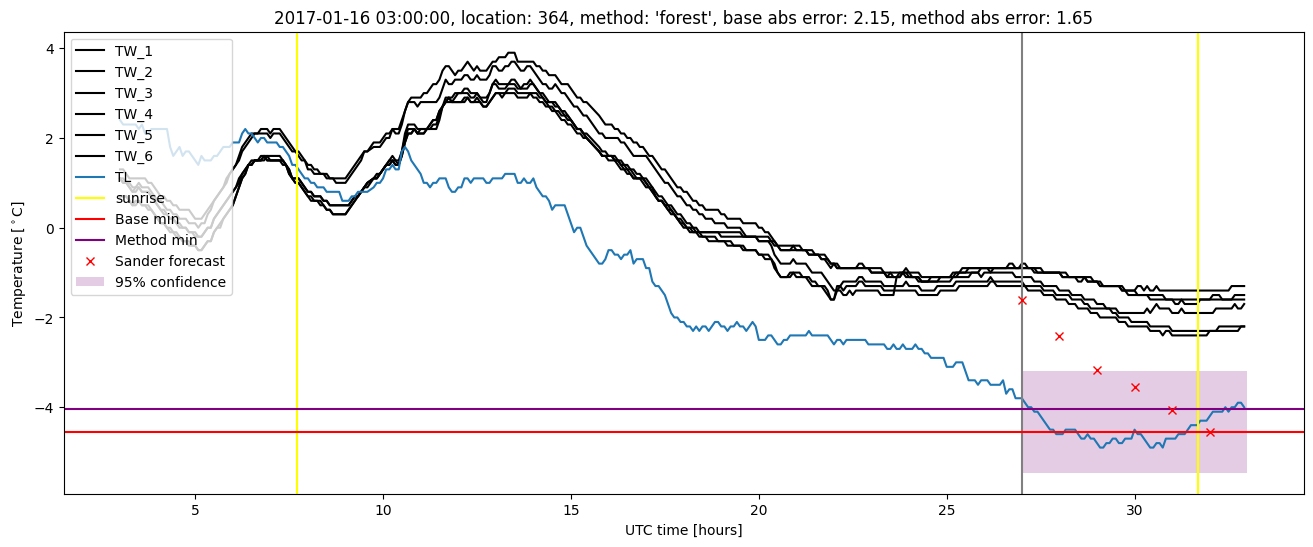
| forest |
winter 2017 |
0.960 |
0.000e+00 |
0.226 |
0.367 |
1.647 |
0.475 |
4.514 |
| baseline |
winter 2018 |
0.985 |
0.191 |
0.356 |
0.449 |
2.438 |
NaN |
NaN |
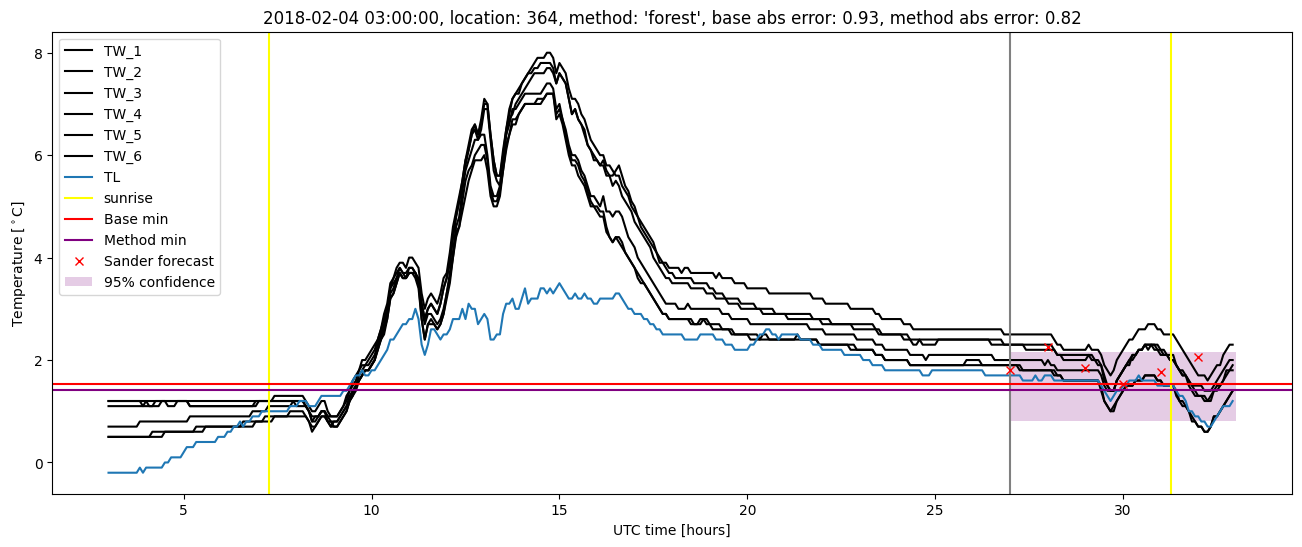
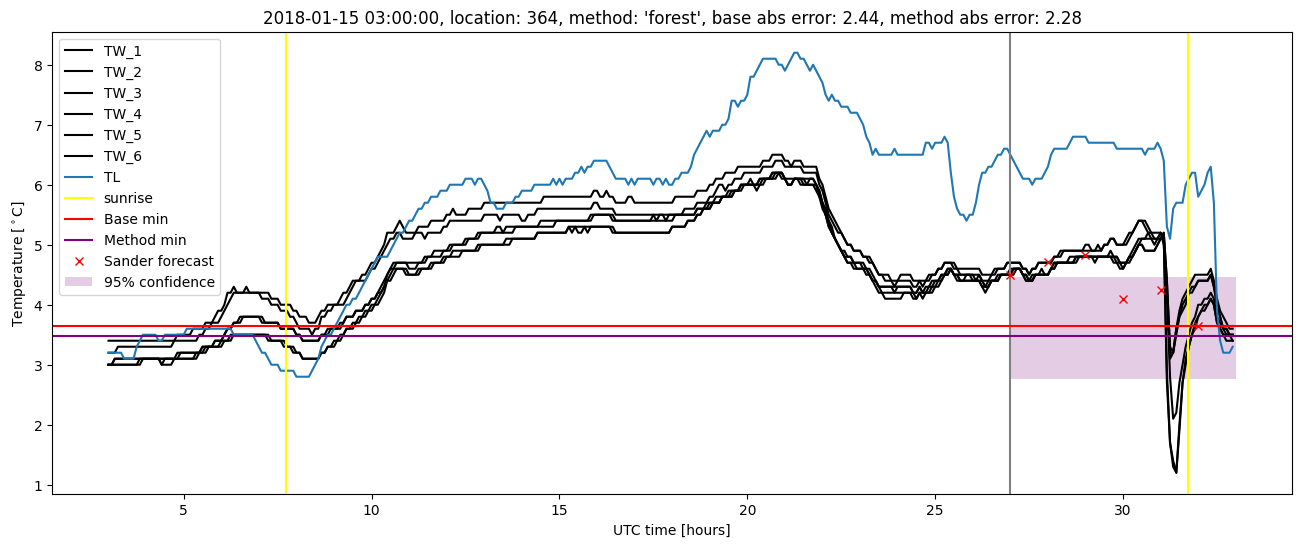
| forest |
winter 2018 |
0.992 |
0.191 |
0.296 |
0.398 |
2.280 |
0.484 |
5.000 |
| baseline |
winter 2019 |
0.992 |
0.167 |
0.240 |
0.376 |
1.349 |
NaN |
NaN |
| forest |
winter 2019 |
0.992 |
0.167 |
0.194 |
0.341 |
1.215 |
0.464 |
3.647 |
| baseline |
all |
0.984 |
0.083 |
0.299 |
0.420 |
2.438 |
NaN |
NaN |
| forest |
all |
0.984 |
0.083 |
0.243 |
0.370 |
2.280 |
0.474 |
4.464 |
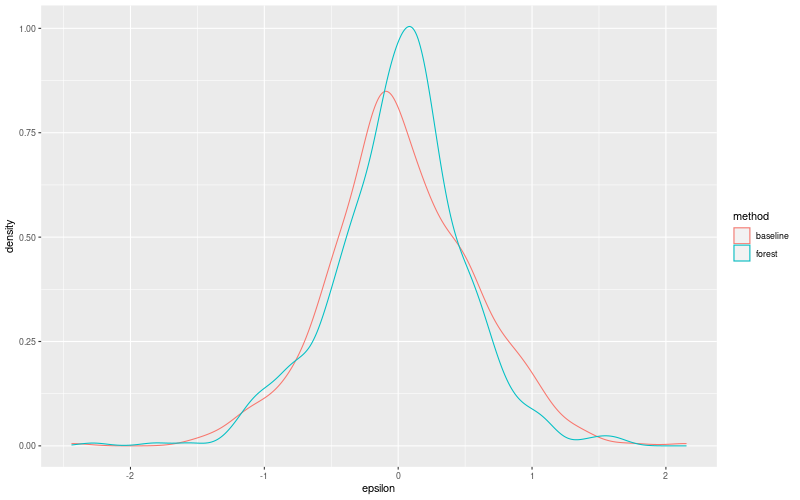
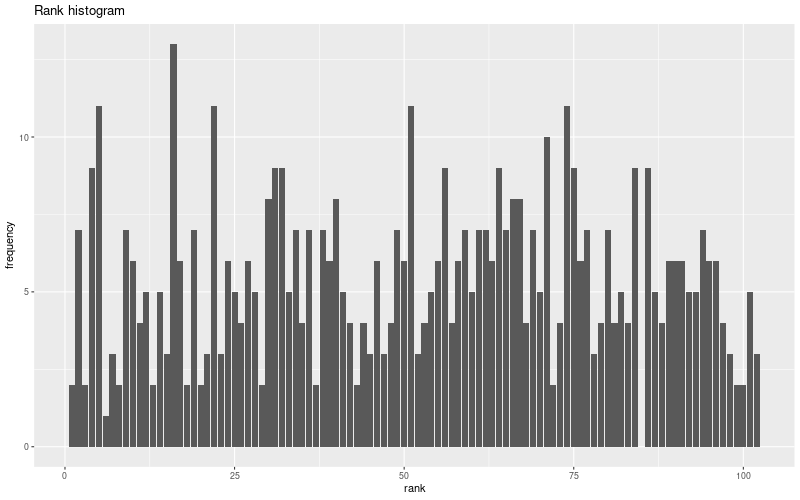
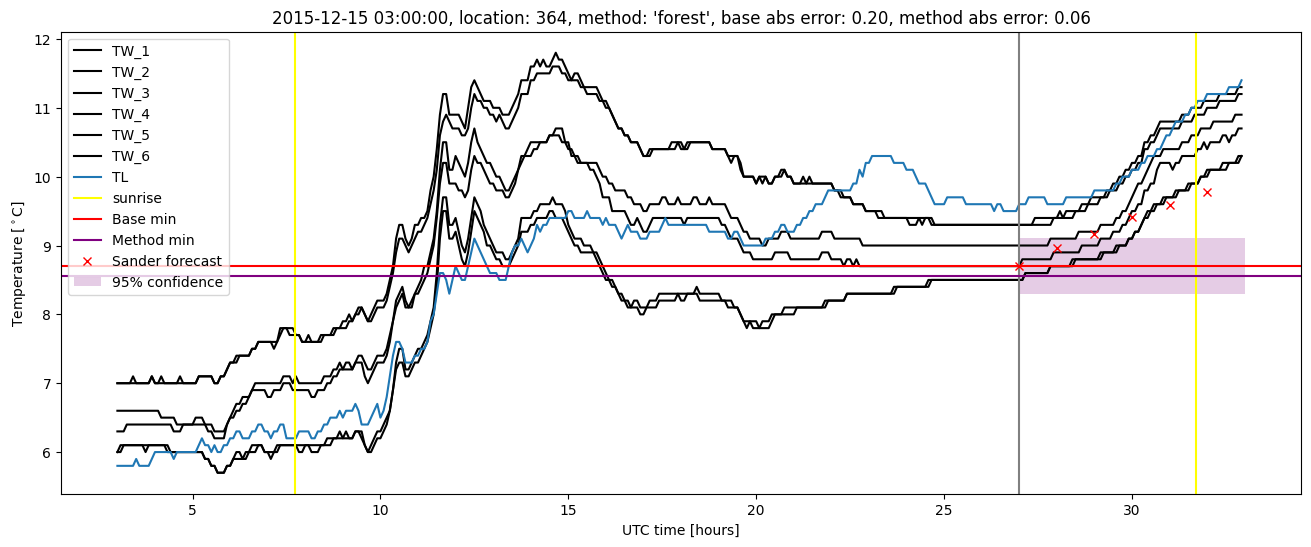
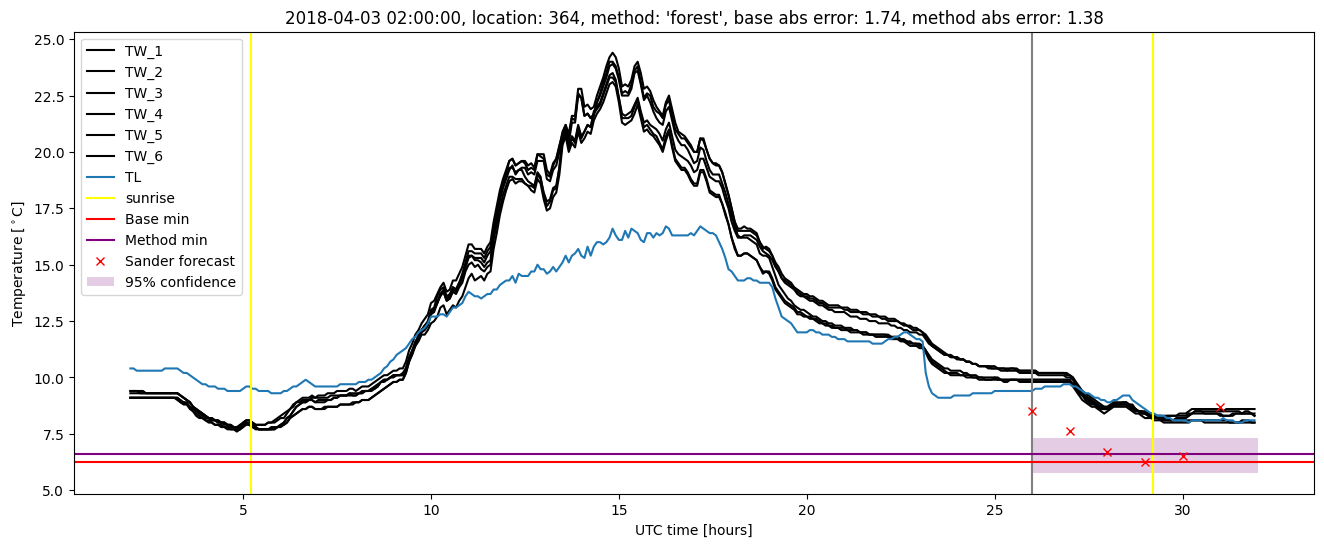
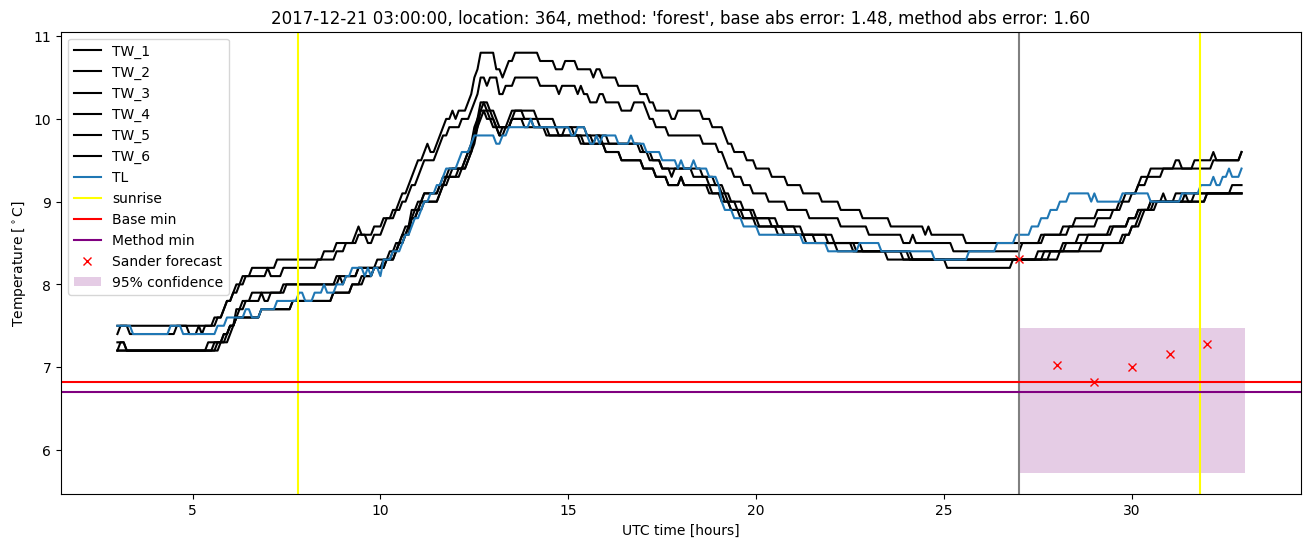
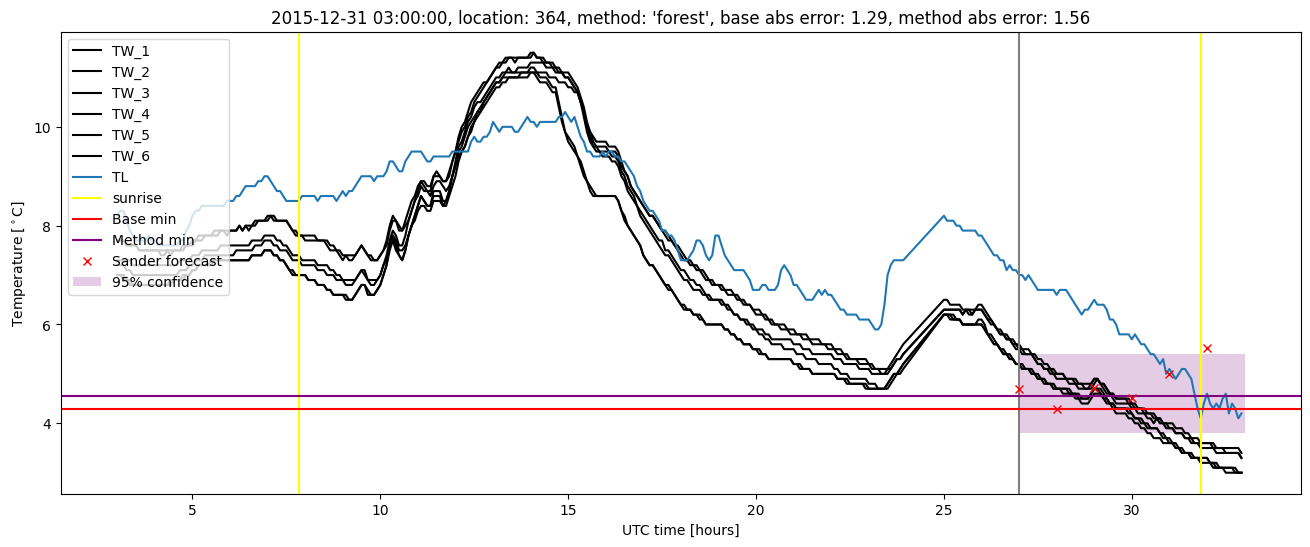
Random forest plots
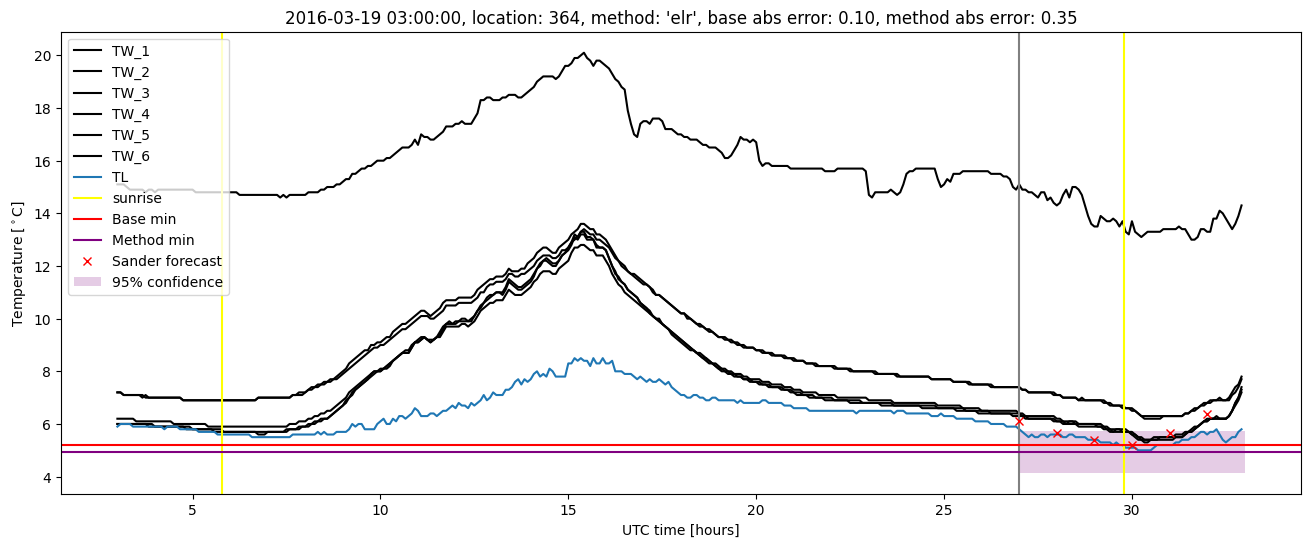
Extended logistic regression results
| names |
period |
power |
significance |
meanSquareError |
absError |
maxError |
CRPS |
IGN |
| baseline |
winter 2016 |
0.991 |
0.000e+00 |
0.289 |
0.424 |
1.339 |
NaN |
NaN |
| elr |
winter 2016 |
0.991 |
0.000e+00 |
0.244 |
0.388 |
1.362 |
0.530 |
5.866 |
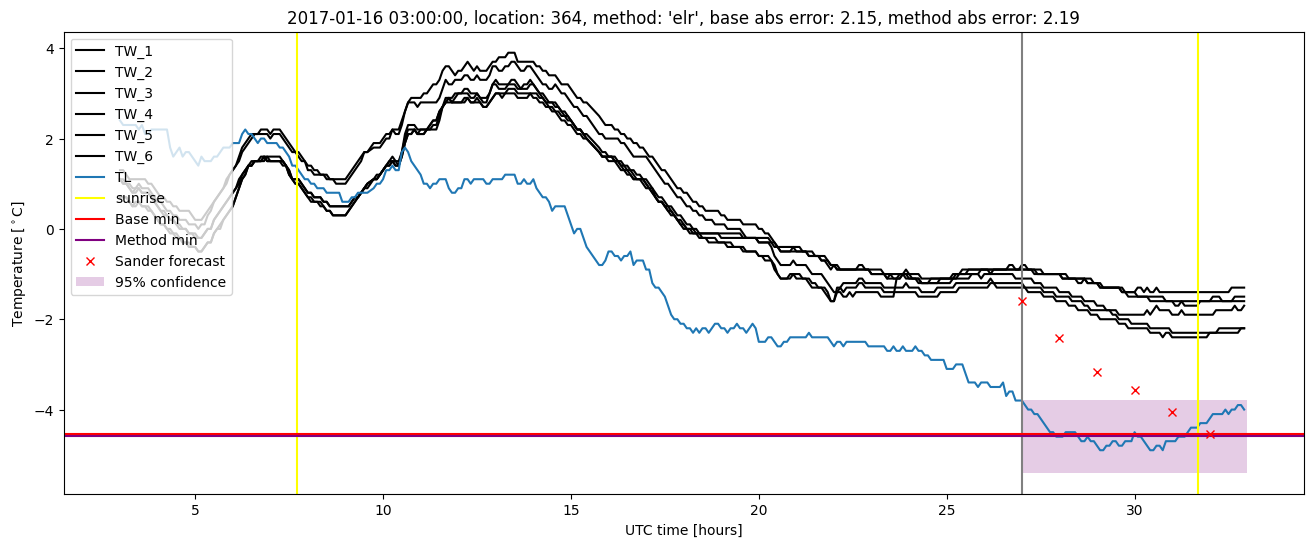
| baseline |
winter 2017 |
0.968 |
0.000e+00 |
0.303 |
0.428 |
2.151 |
NaN |
NaN |
| elr |
winter 2017 |
0.968 |
0.000e+00 |
0.254 |
0.388 |
2.191 |
0.538 |
5.865 |
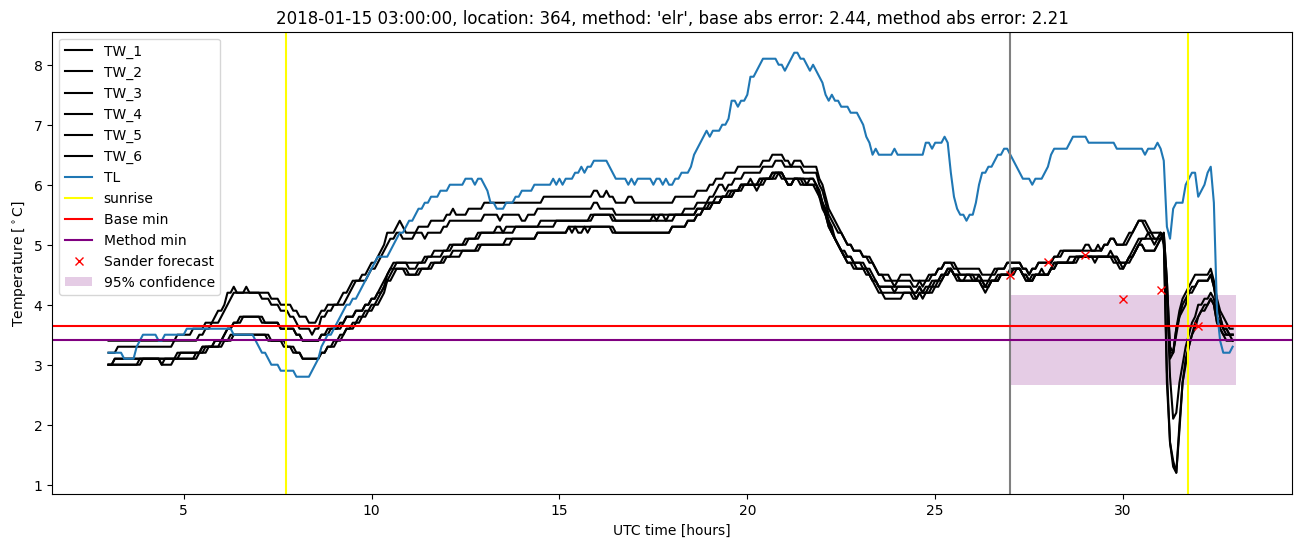
| baseline |
winter 2018 |
0.985 |
0.191 |
0.356 |
0.449 |
2.438 |
NaN |
NaN |
| elr |
winter 2018 |
0.992 |
0.143 |
0.335 |
0.430 |
2.210 |
0.544 |
7.435 |
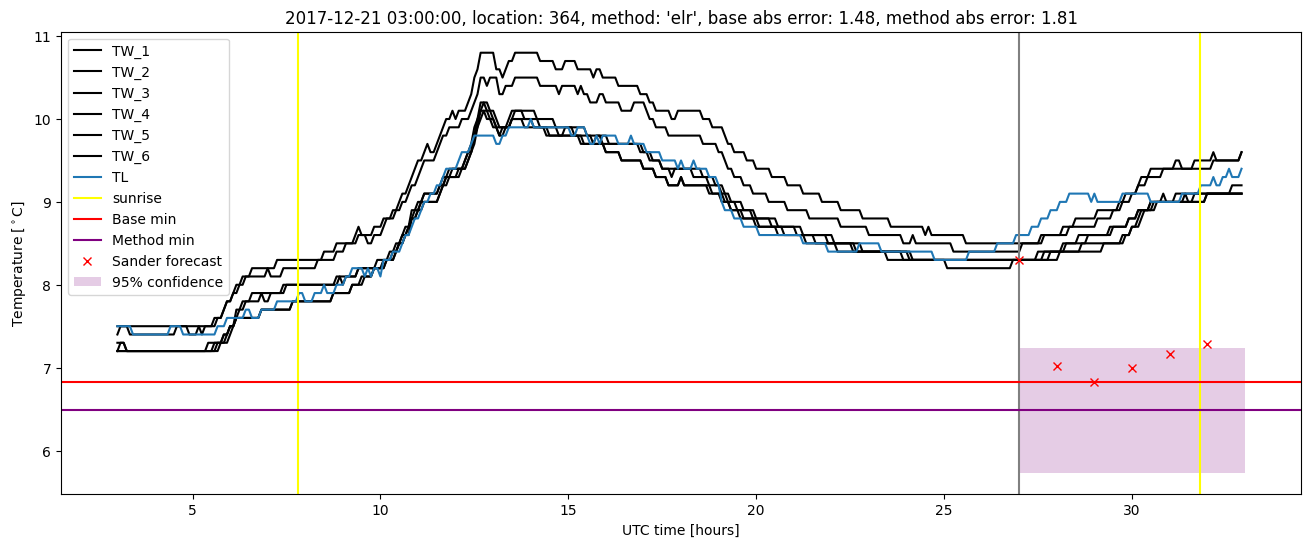
| baseline |
winter 2019 |
0.992 |
0.167 |
0.240 |
0.376 |
1.349 |
NaN |
NaN |
| elr |
winter 2019 |
0.992 |
0.167 |
0.221 |
0.353 |
1.635 |
0.536 |
5.588 |
| baseline |
all |
0.984 |
0.083 |
0.299 |
0.420 |
2.438 |
NaN |
NaN |
| elr |
all |
0.986 |
0.067 |
0.266 |
0.391 |
2.210 |
0.538 |
6.227 |
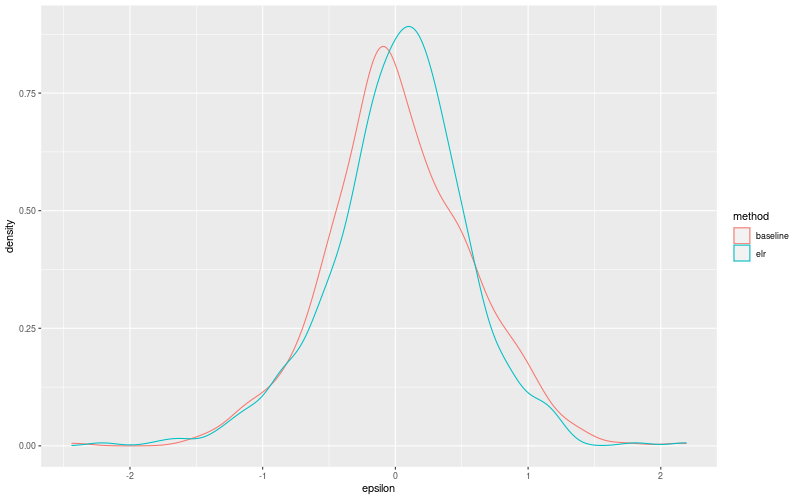
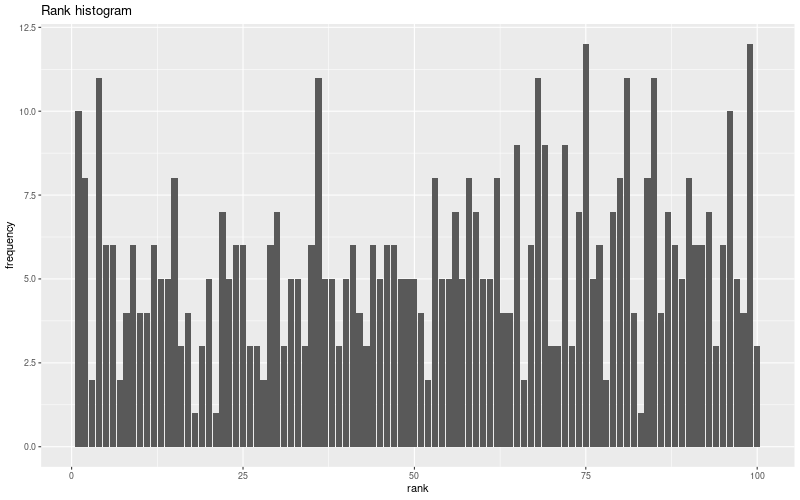
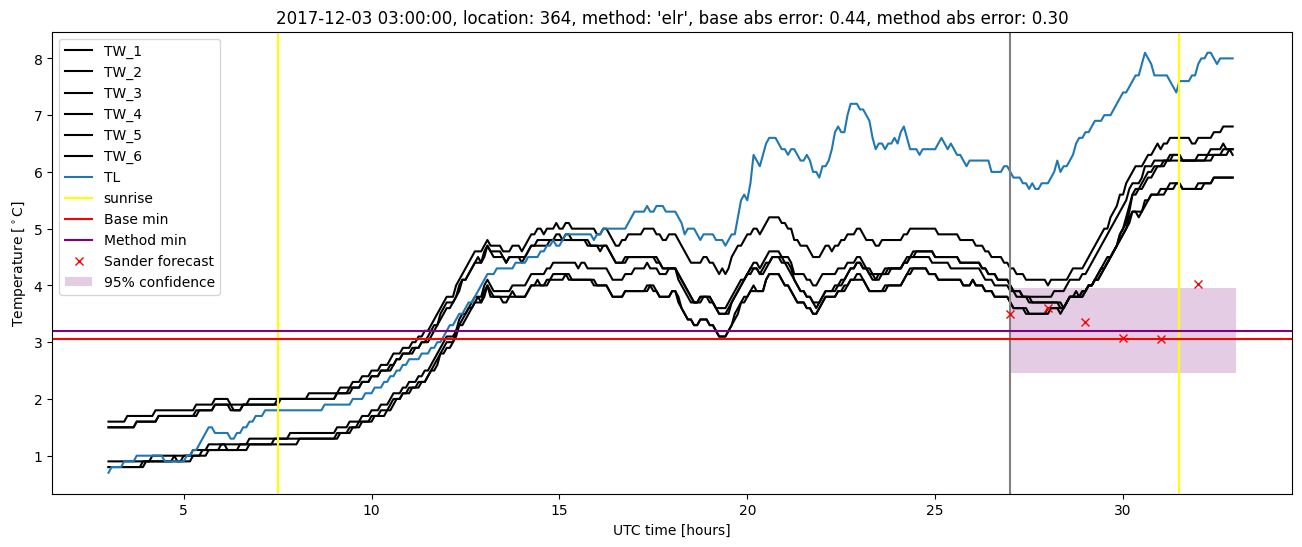
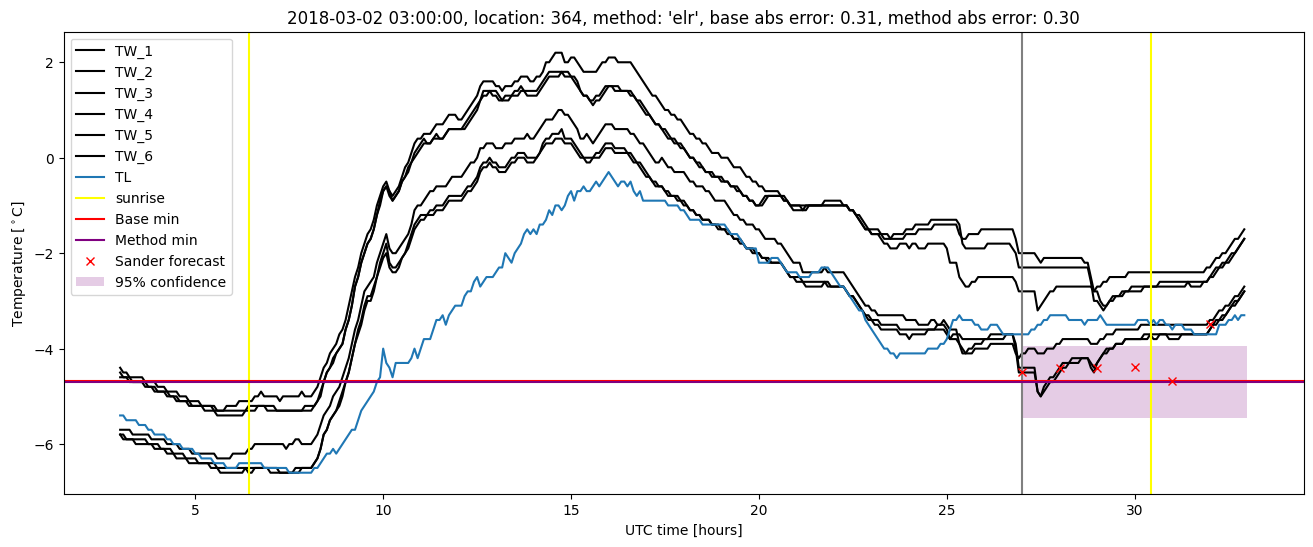
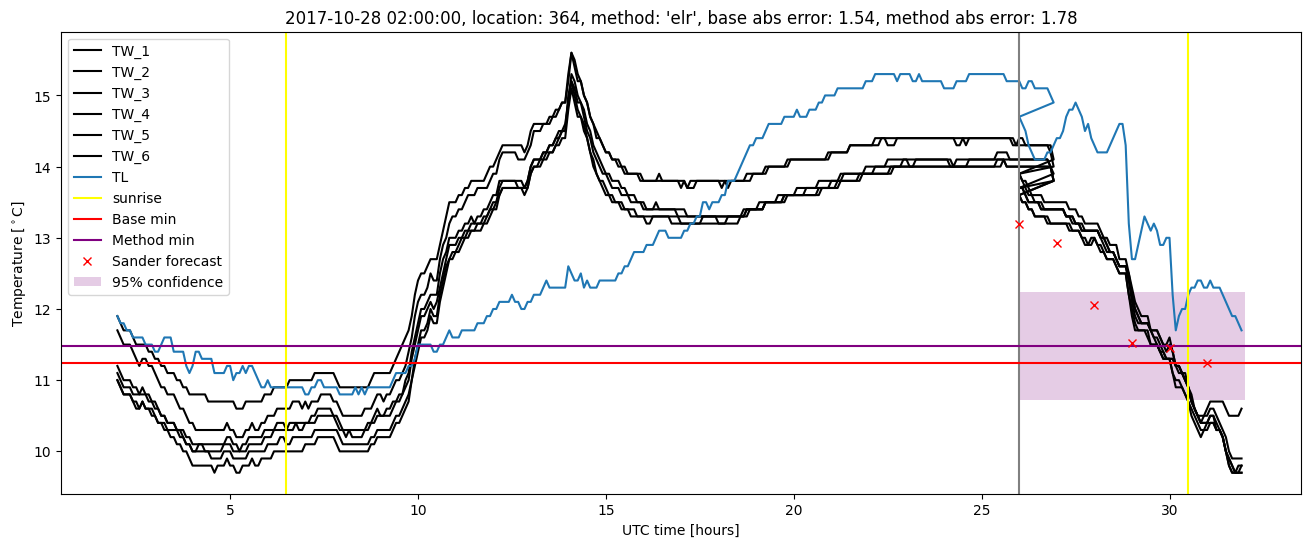
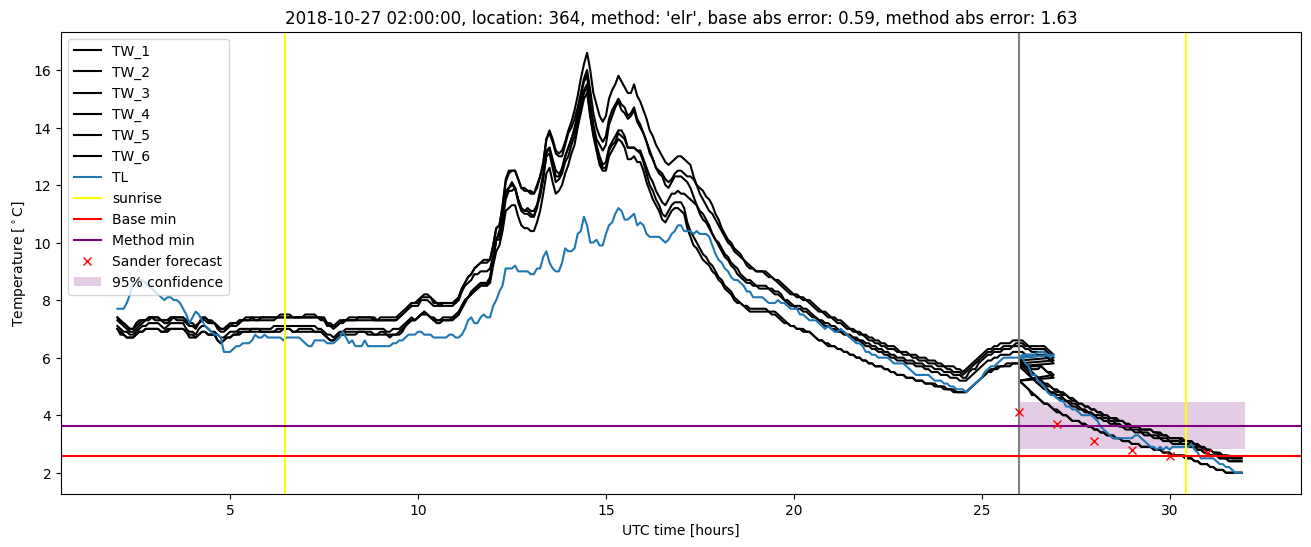
Extended logistic regression plots