GMS location: 363
Random forest results
| names |
period |
power |
significance |
meanSquareError |
absError |
maxError |
CRPS |
IGN |
| baseline |
winter 2016 |
0.989 |
0.091 |
0.368 |
0.451 |
2.026 |
NaN |
NaN |
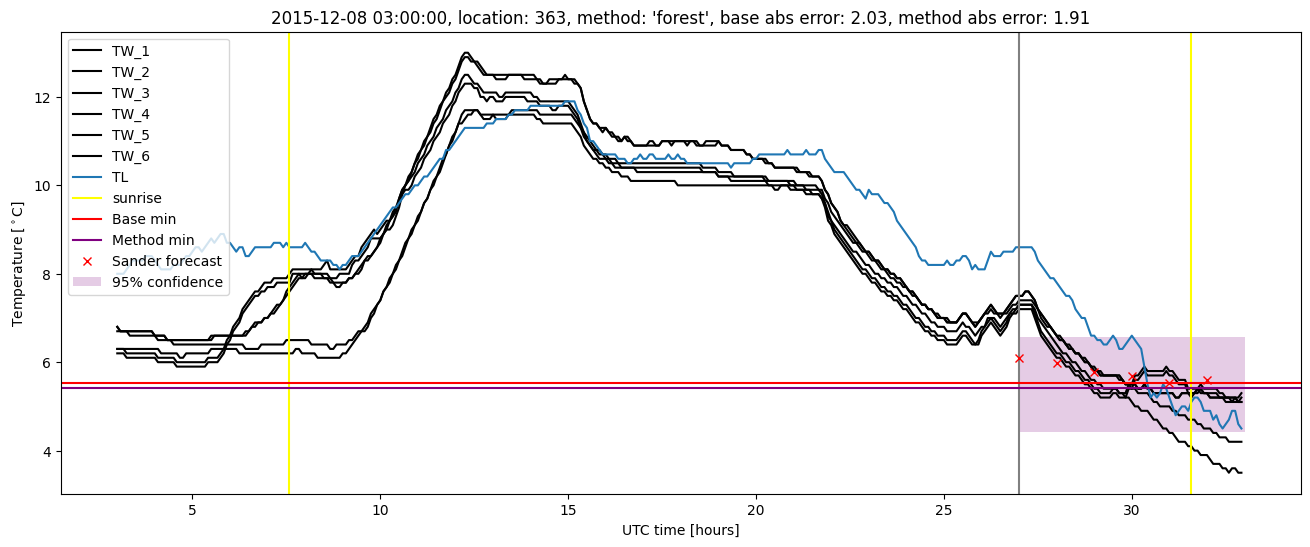
| forest |
winter 2016 |
0.994 |
0.091 |
0.305 |
0.404 |
1.912 |
0.470 |
2.526 |
| baseline |
winter 2017 |
0.975 |
0.059 |
0.479 |
0.505 |
2.351 |
NaN |
NaN |
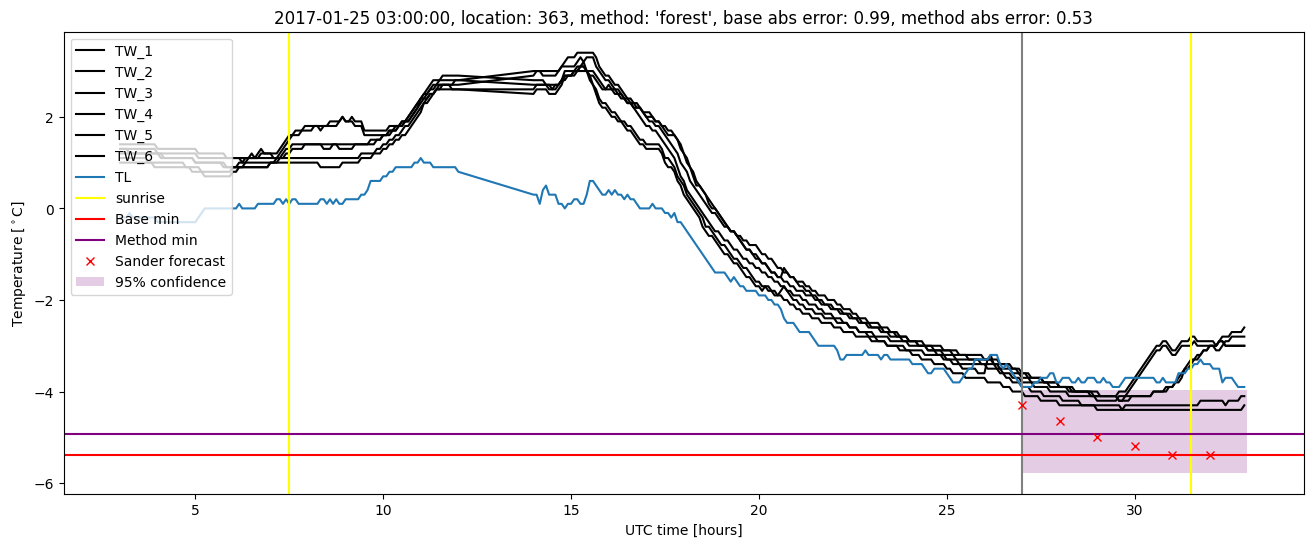
| forest |
winter 2017 |
0.983 |
0.059 |
0.359 |
0.444 |
1.849 |
0.477 |
3.323 |
| baseline |
winter 2018 |
0.991 |
0.094 |
0.384 |
0.425 |
3.639 |
NaN |
NaN |
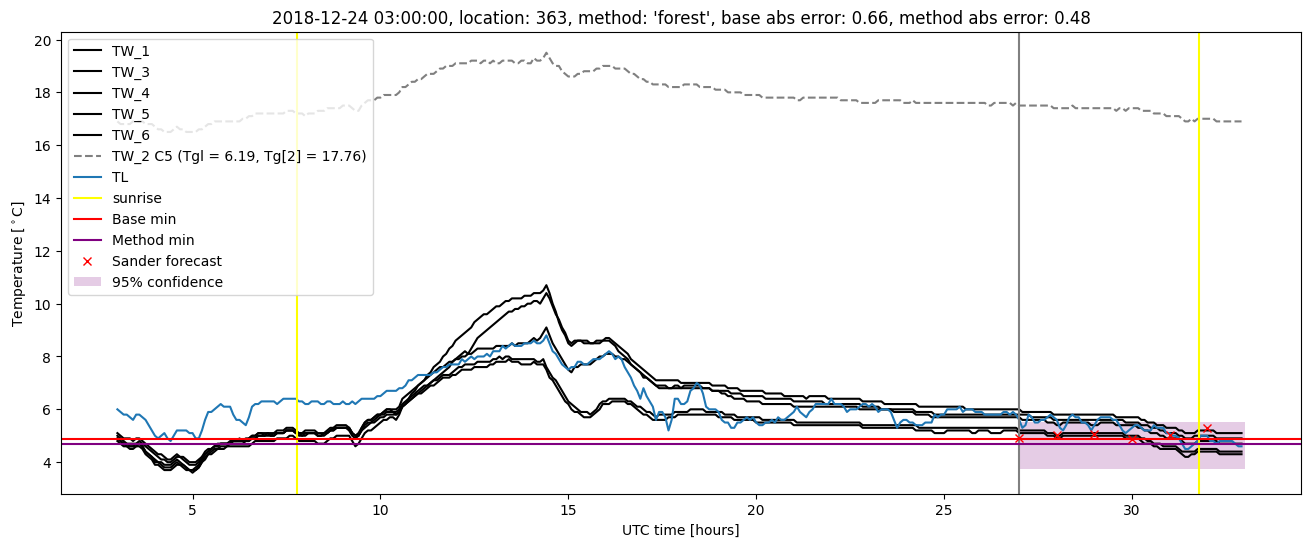
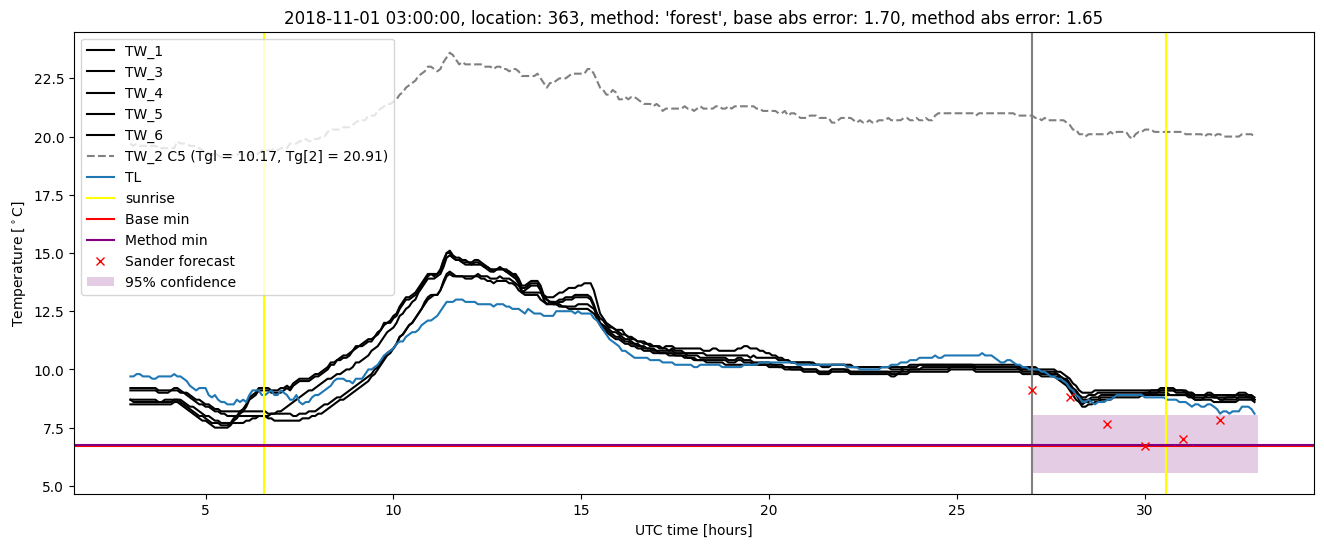
| forest |
winter 2018 |
0.981 |
0.125 |
0.342 |
0.391 |
3.827 |
0.488 |
2.851 |
| baseline |
winter 2019 |
0.994 |
0.067 |
0.303 |
0.411 |
1.703 |
NaN |
NaN |
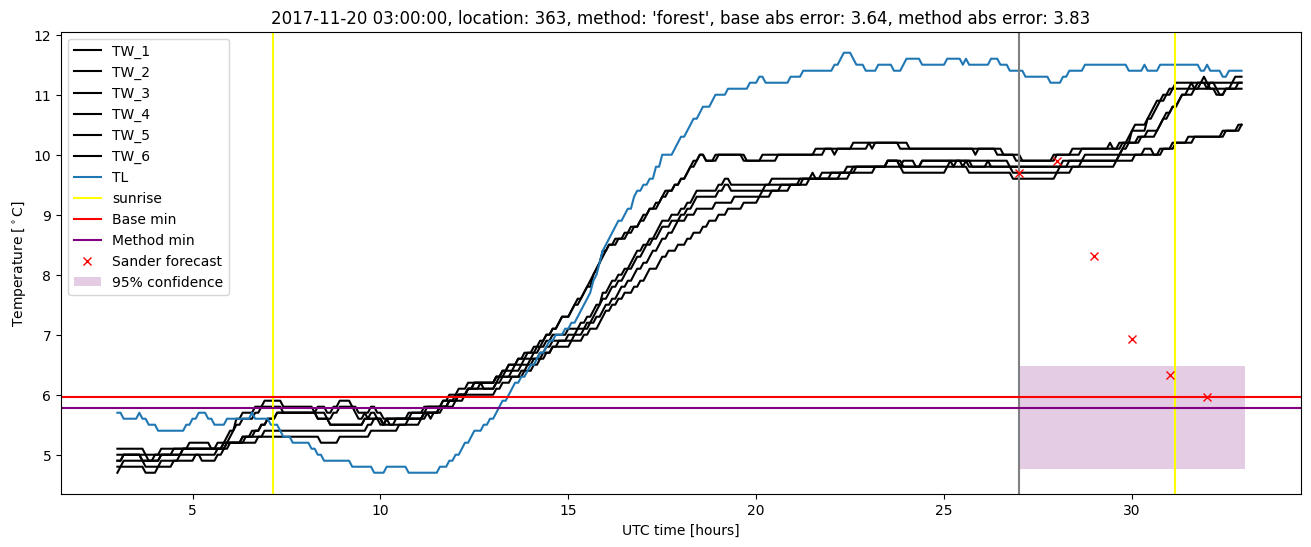
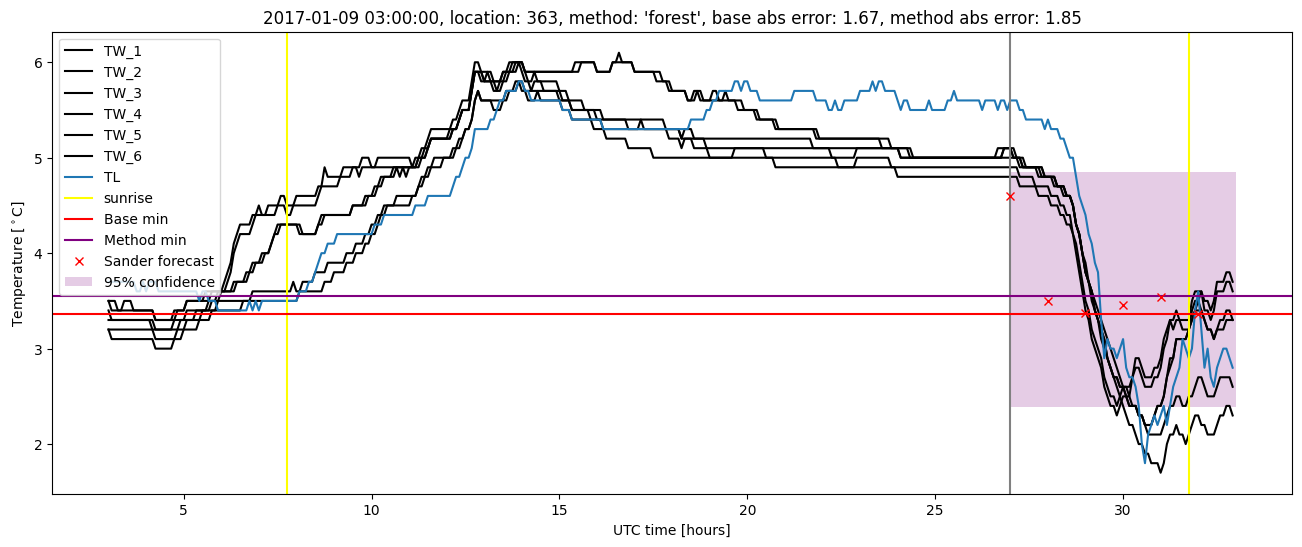
| forest |
winter 2019 |
0.994 |
0.067 |
0.262 |
0.391 |
1.654 |
0.464 |
2.202 |
| baseline |
all |
0.987 |
0.078 |
0.380 |
0.448 |
3.639 |
NaN |
NaN |
| forest |
all |
0.989 |
0.087 |
0.314 |
0.407 |
3.827 |
0.474 |
2.696 |
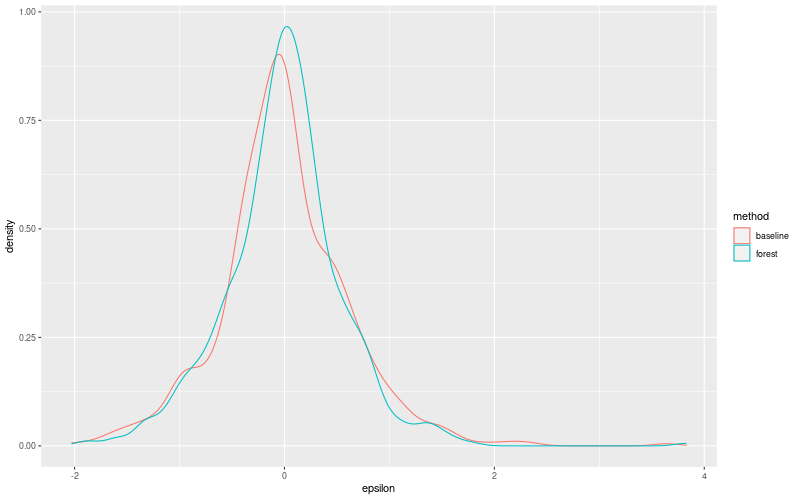
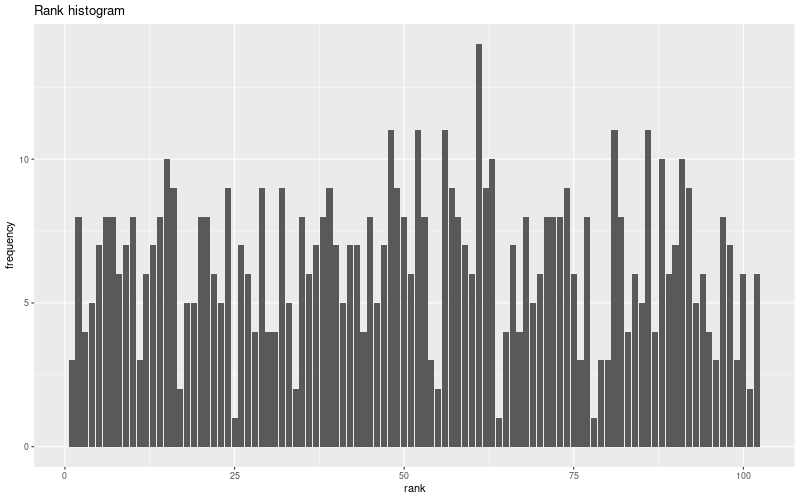
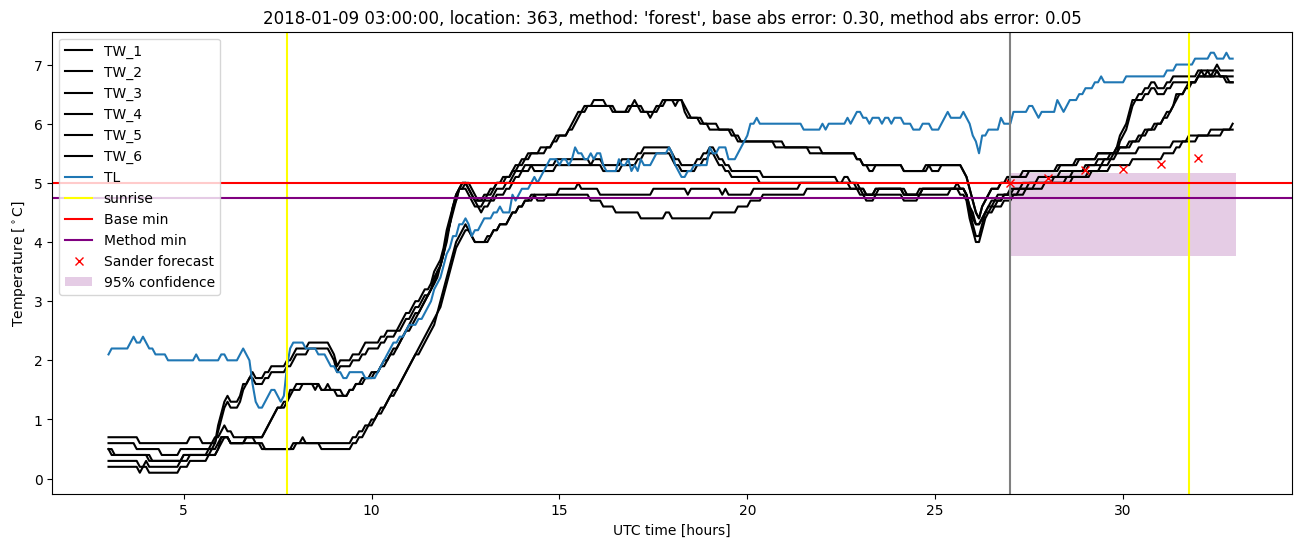
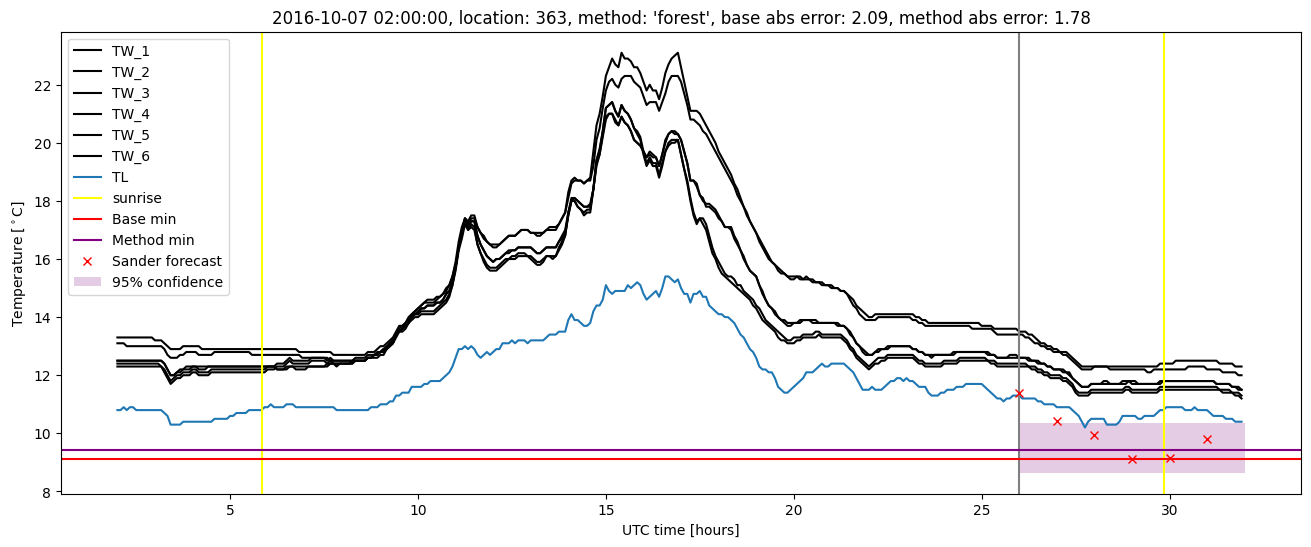
Random forest plots
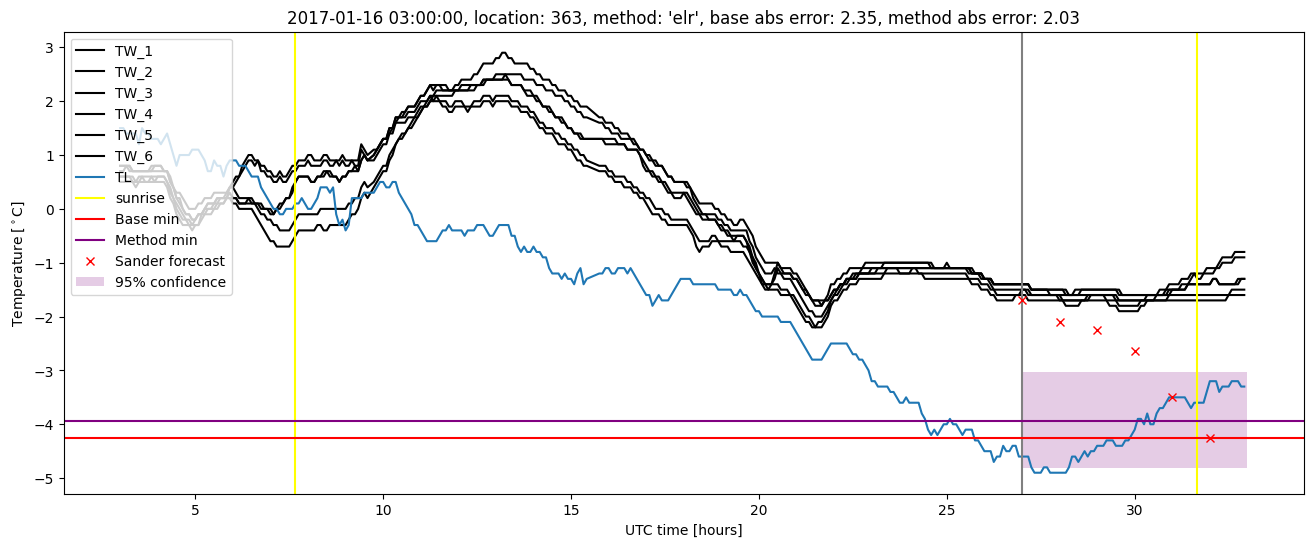
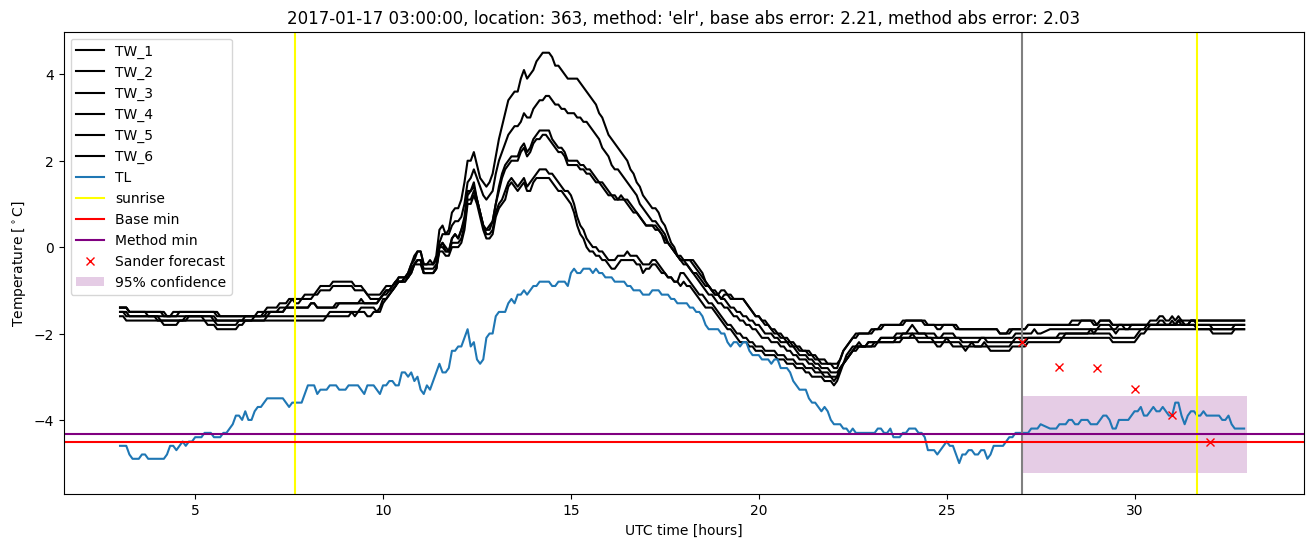
Extended logistic regression results
| names |
period |
power |
significance |
meanSquareError |
absError |
maxError |
CRPS |
IGN |
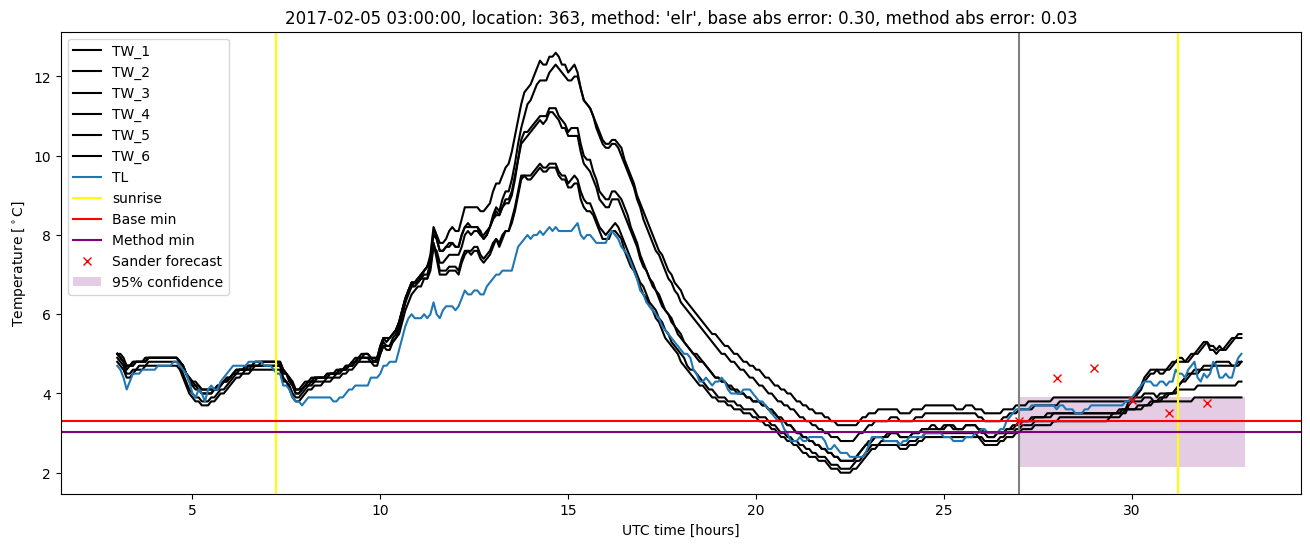
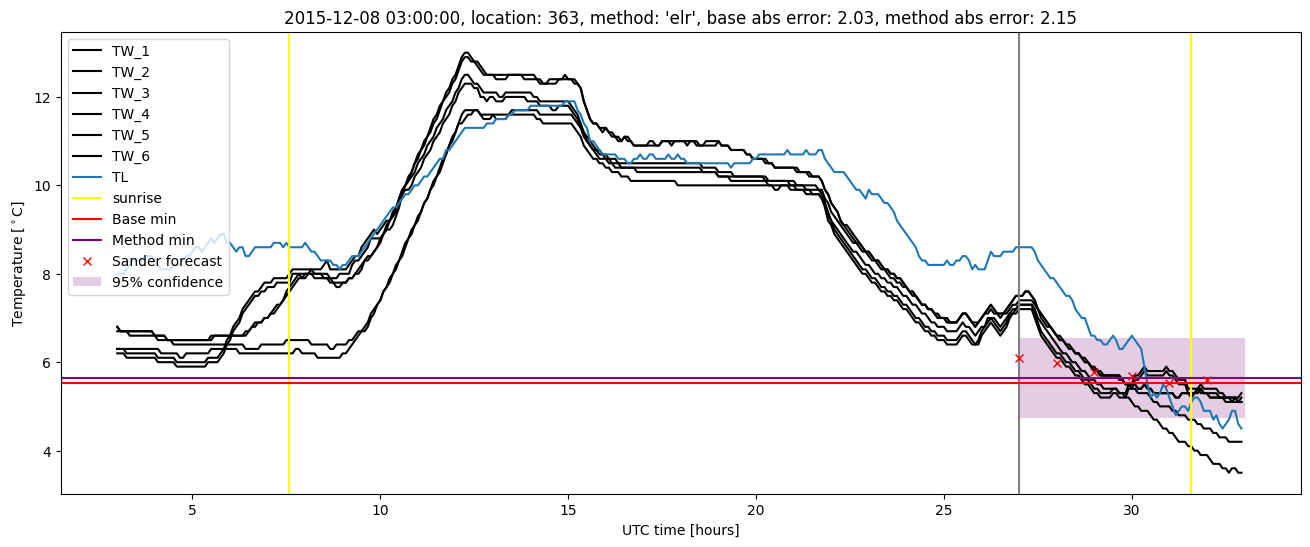
| baseline |
winter 2016 |
0.989 |
0.091 |
0.368 |
0.451 |
2.026 |
NaN |
NaN |
| elr |
winter 2016 |
0.989 |
0.091 |
0.327 |
0.439 |
2.149 |
0.536 |
3.924 |
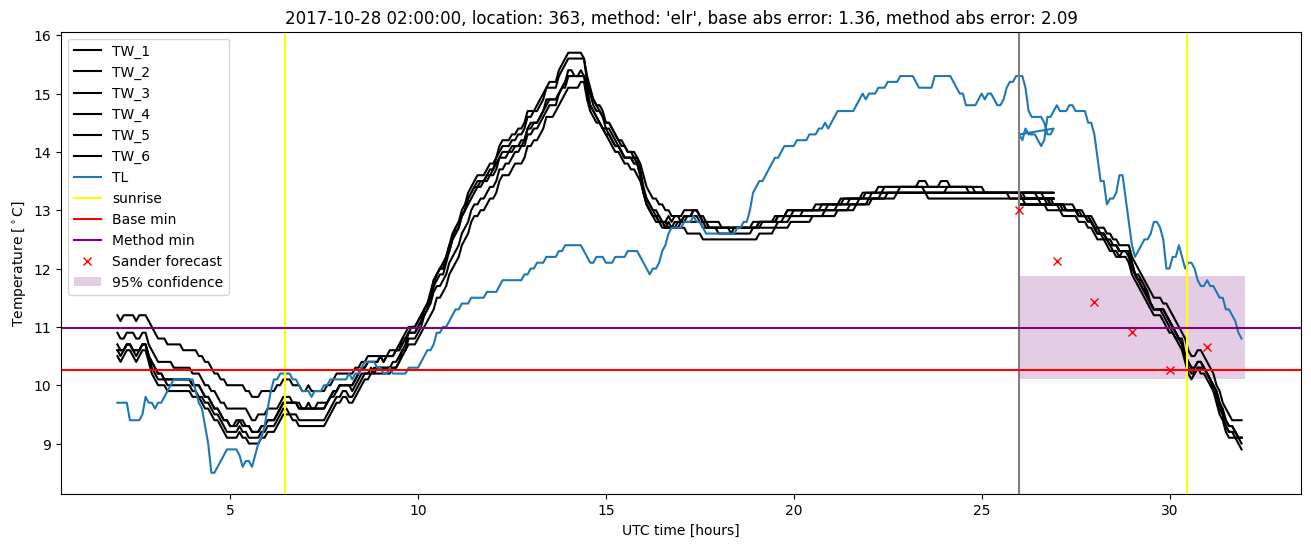
| baseline |
winter 2017 |
0.975 |
0.059 |
0.479 |
0.505 |
2.351 |
NaN |
NaN |
| elr |
winter 2017 |
0.983 |
0.029 |
0.388 |
0.459 |
2.031 |
0.524 |
3.889 |
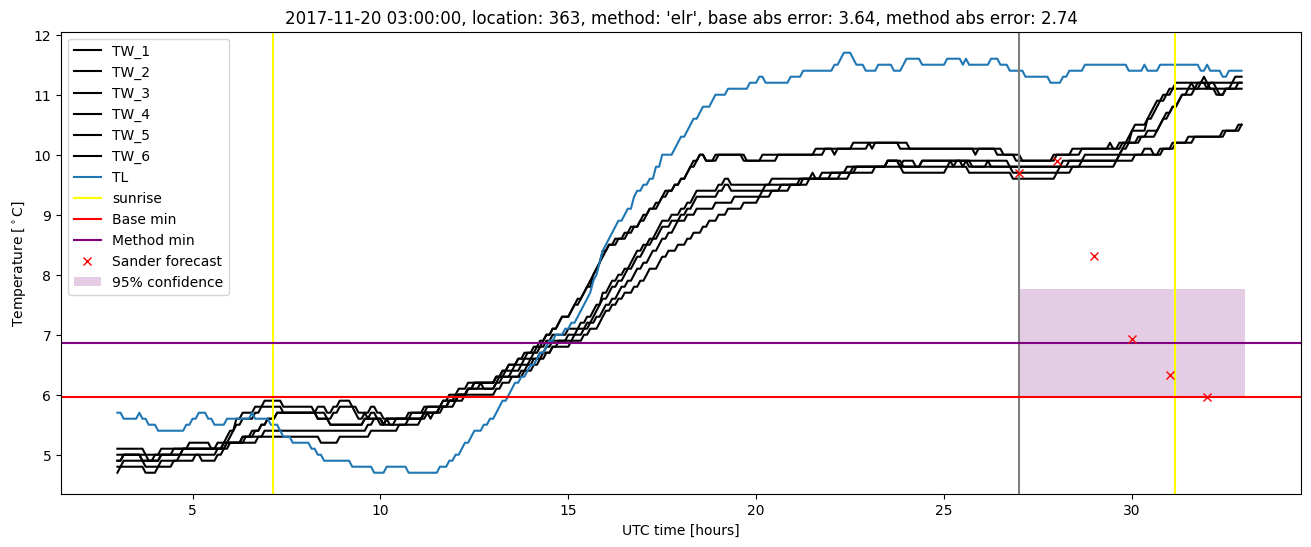
| baseline |
winter 2018 |
0.991 |
0.094 |
0.384 |
0.425 |
3.639 |
NaN |
NaN |
| elr |
winter 2018 |
0.962 |
0.125 |
0.321 |
0.401 |
2.741 |
0.550 |
4.267 |
| baseline |
winter 2019 |
0.994 |
0.067 |
0.303 |
0.411 |
1.703 |
NaN |
NaN |
| elr |
winter 2019 |
1.000 |
0.067 |
0.295 |
0.423 |
1.605 |
0.510 |
3.091 |
| baseline |
all |
0.987 |
0.078 |
0.380 |
0.448 |
3.639 |
NaN |
NaN |
| elr |
all |
0.986 |
0.078 |
0.331 |
0.432 |
2.741 |
0.529 |
3.774 |
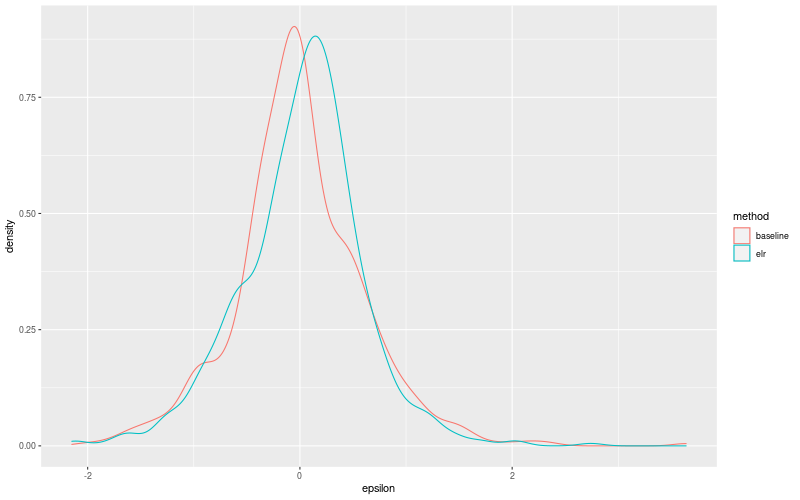
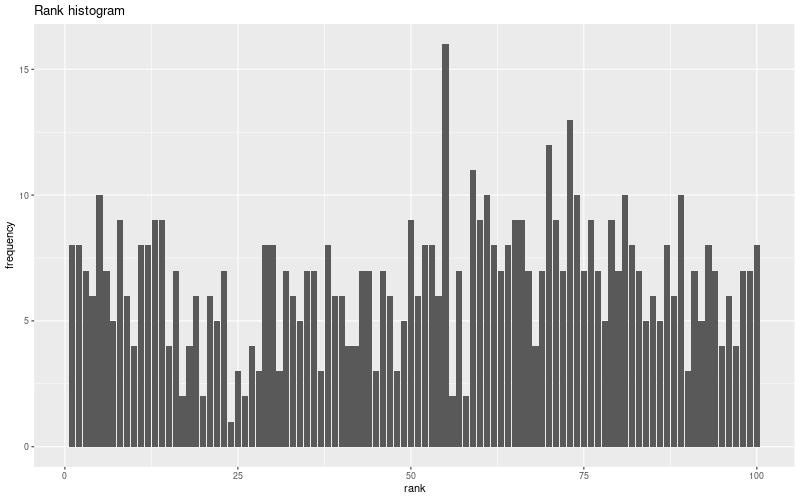
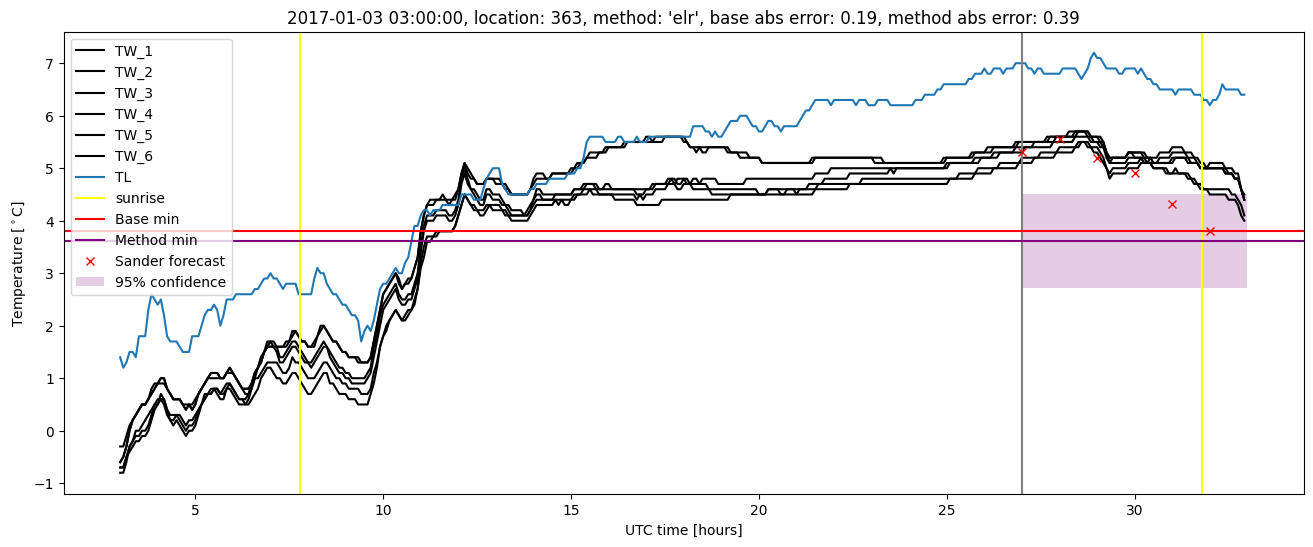
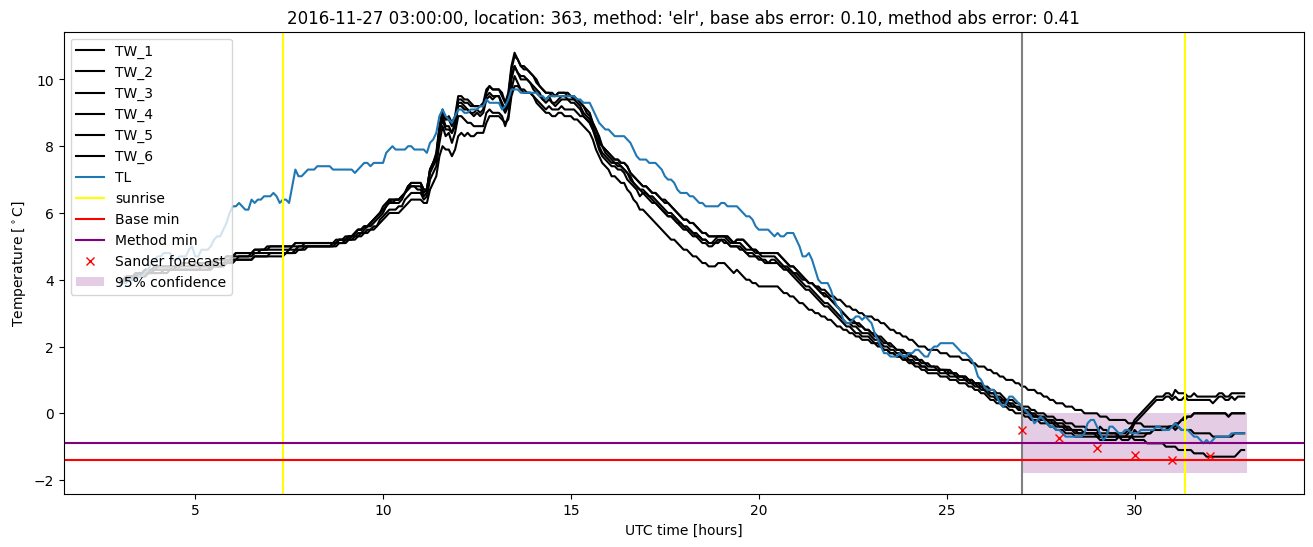
Extended logistic regression plots