GMS location: 362
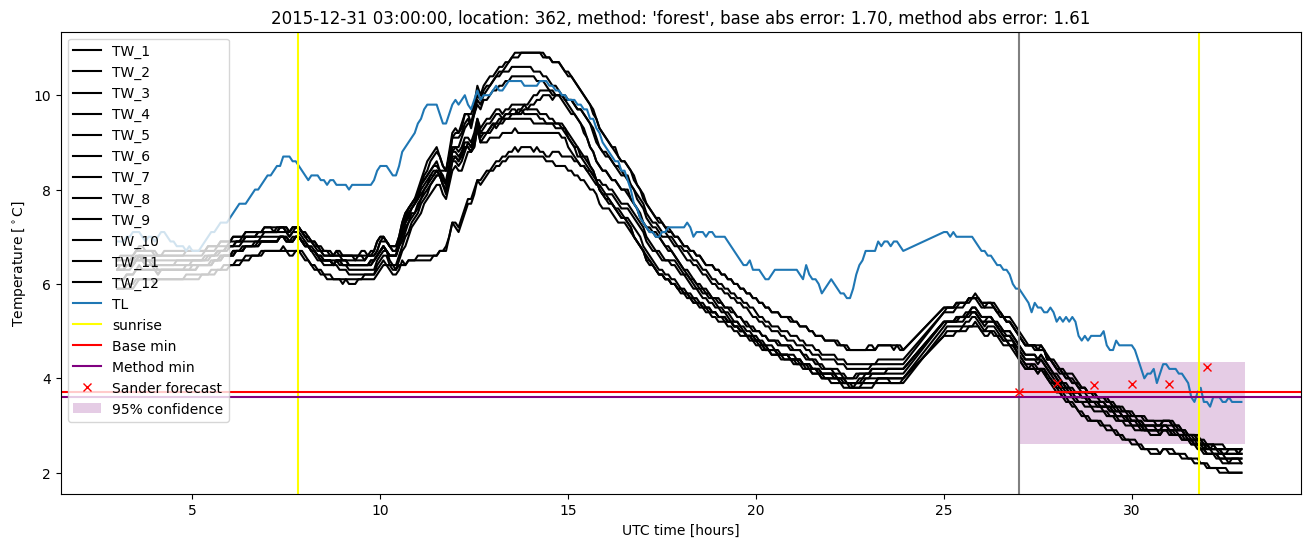
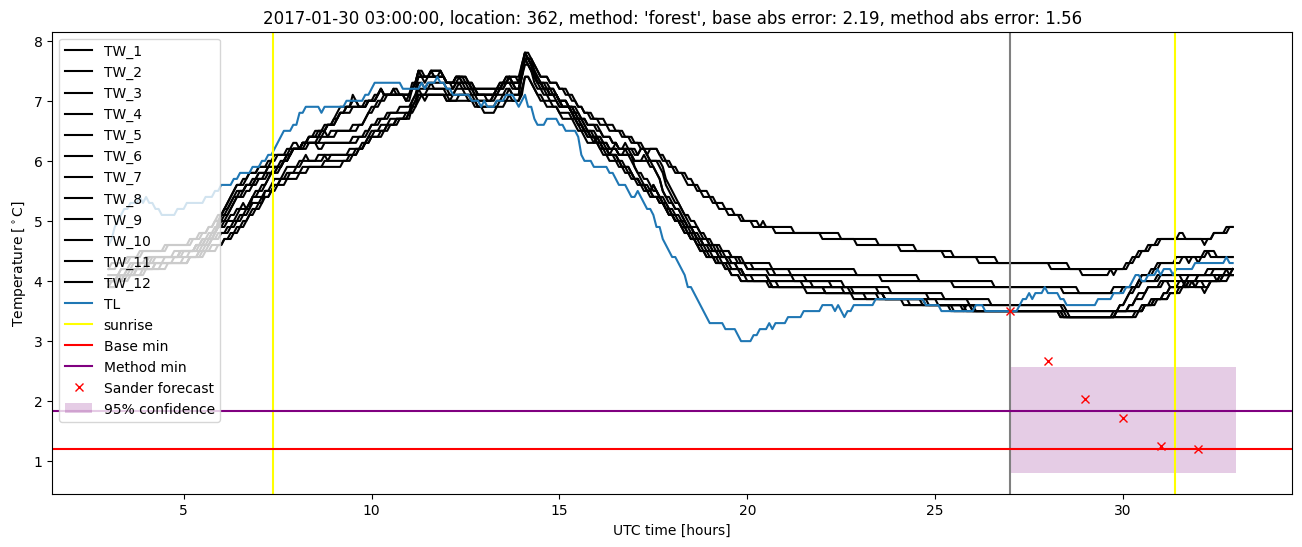
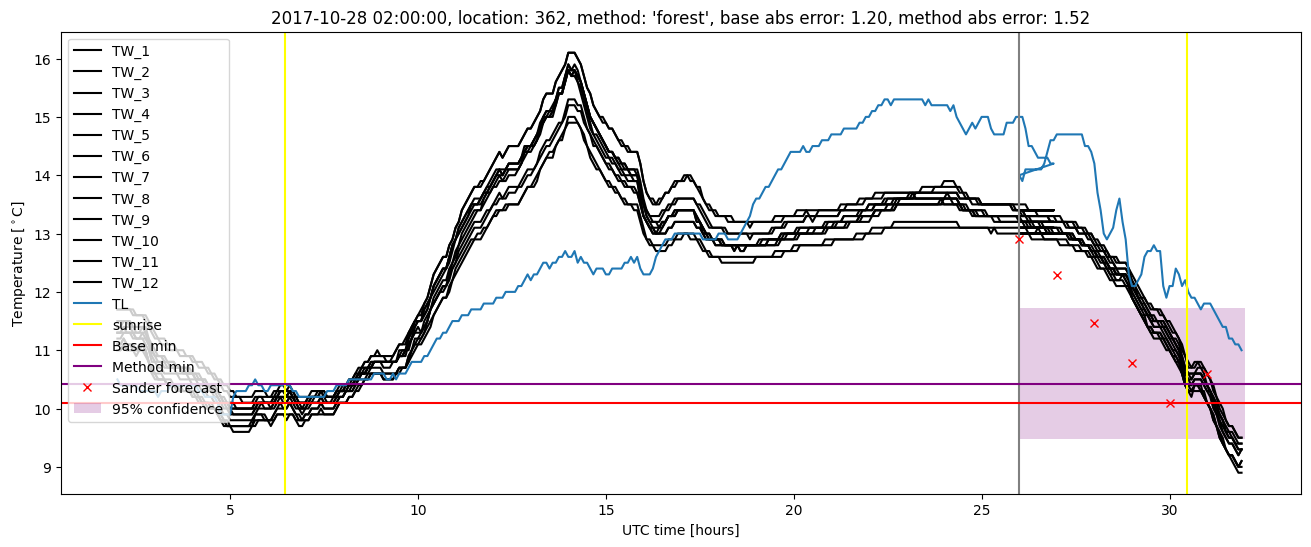
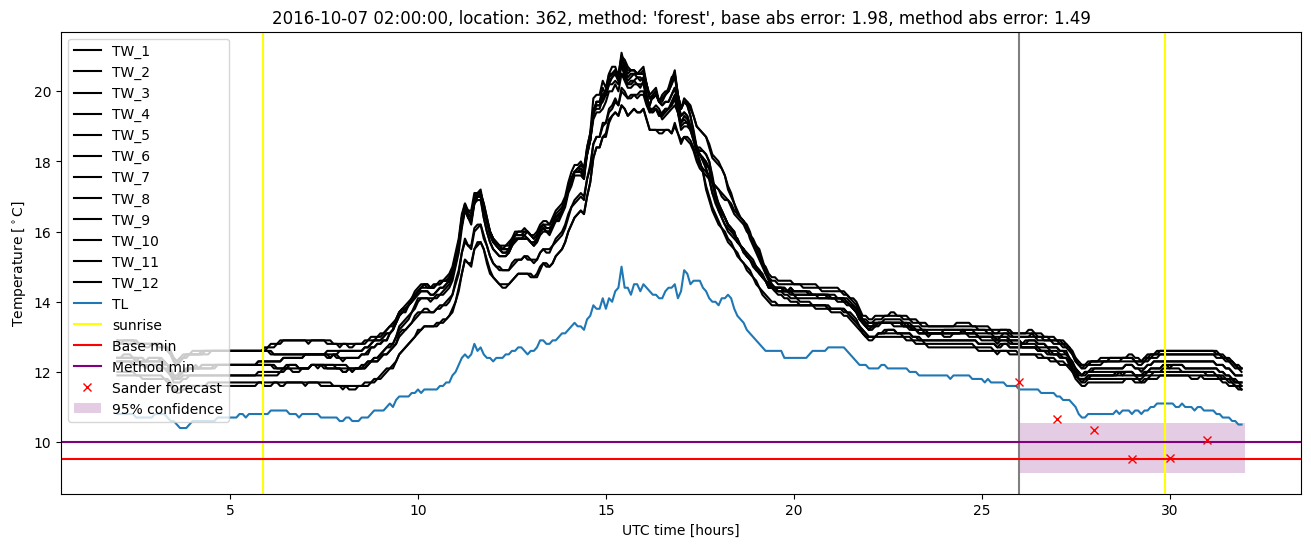
Random forest results
| names |
period |
power |
significance |
meanSquareError |
absError |
maxError |
CRPS |
IGN |
| baseline |
winter 2016 |
1.000 |
0.053 |
0.326 |
0.442 |
1.702 |
NaN |
NaN |
| forest |
winter 2016 |
1.000 |
0.053 |
0.246 |
0.377 |
1.610 |
0.446 |
4.978 |
| baseline |
winter 2017 |
0.957 |
0.088 |
0.391 |
0.458 |
2.189 |
NaN |
NaN |
| forest |
winter 2017 |
0.957 |
0.118 |
0.272 |
0.390 |
1.560 |
0.474 |
5.242 |
| baseline |
winter 2018 |
1.000 |
0.172 |
0.299 |
0.405 |
1.871 |
NaN |
NaN |
| forest |
winter 2018 |
0.978 |
0.138 |
0.242 |
0.361 |
1.683 |
0.463 |
3.981 |
| baseline |
winter 2019 |
1.000 |
0.000e+00 |
0.331 |
0.442 |
1.884 |
NaN |
NaN |
| forest |
winter 2019 |
1.000 |
0.000e+00 |
0.248 |
0.376 |
1.336 |
0.438 |
3.457 |
| baseline |
all |
0.990 |
0.094 |
0.338 |
0.439 |
2.189 |
NaN |
NaN |
| forest |
all |
0.986 |
0.094 |
0.252 |
0.377 |
1.683 |
0.455 |
4.510 |
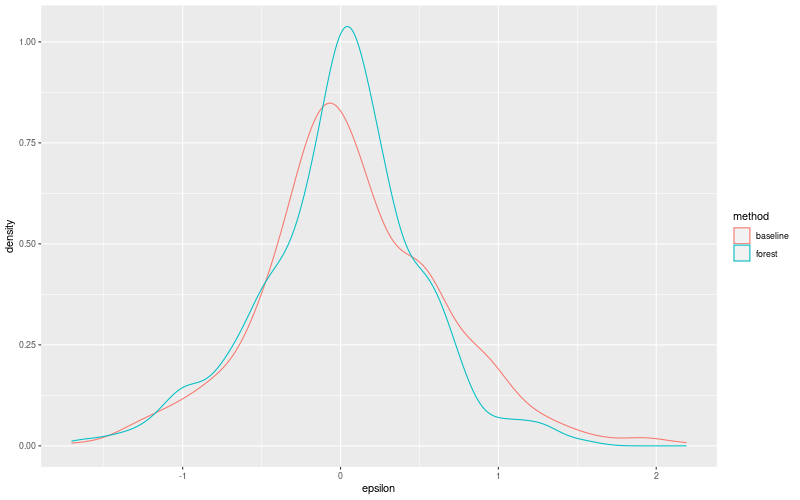
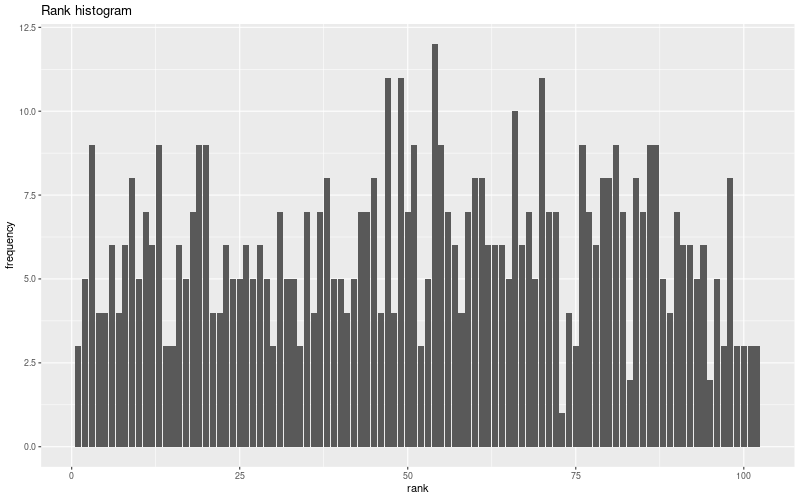
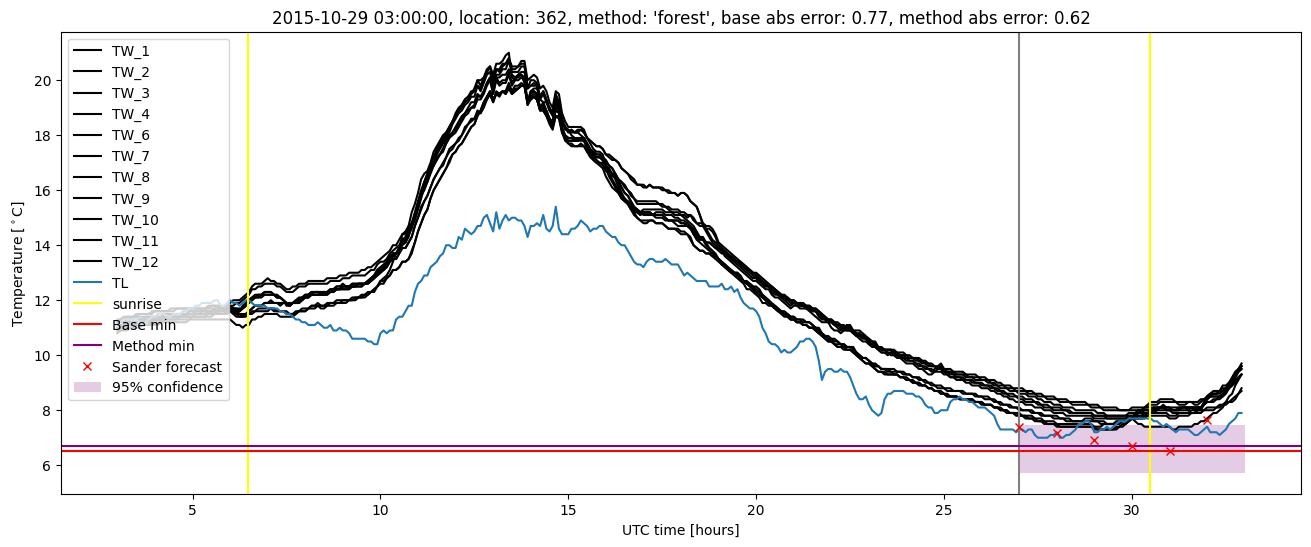
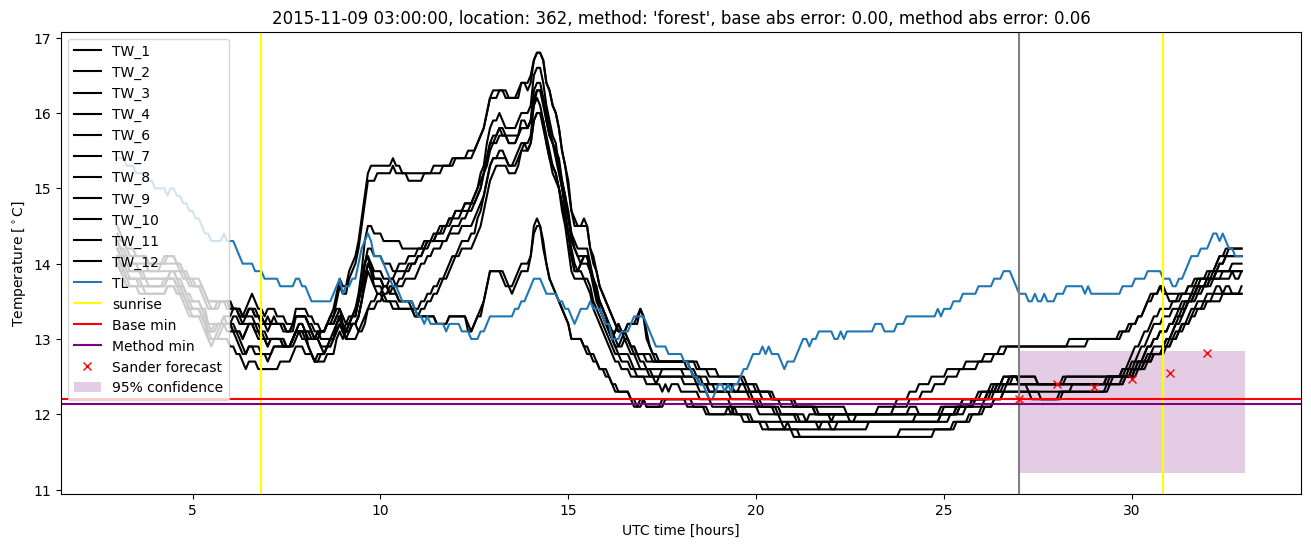
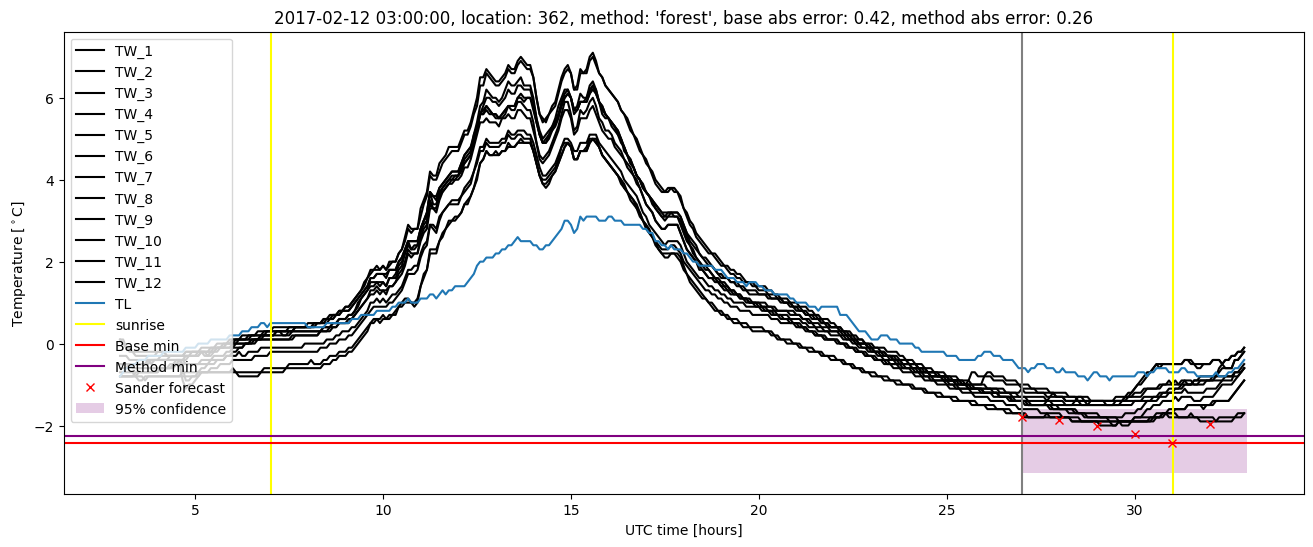
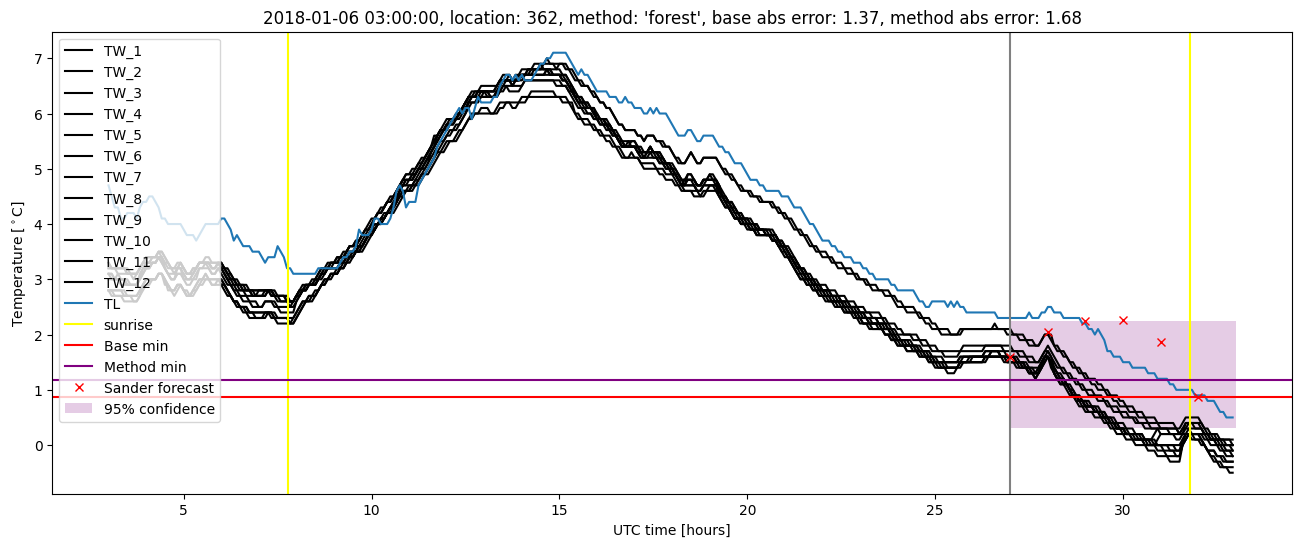
Random forest plots
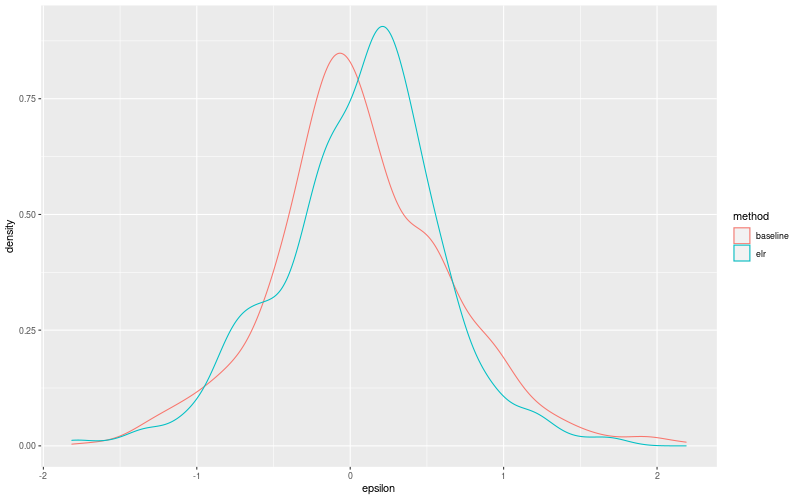
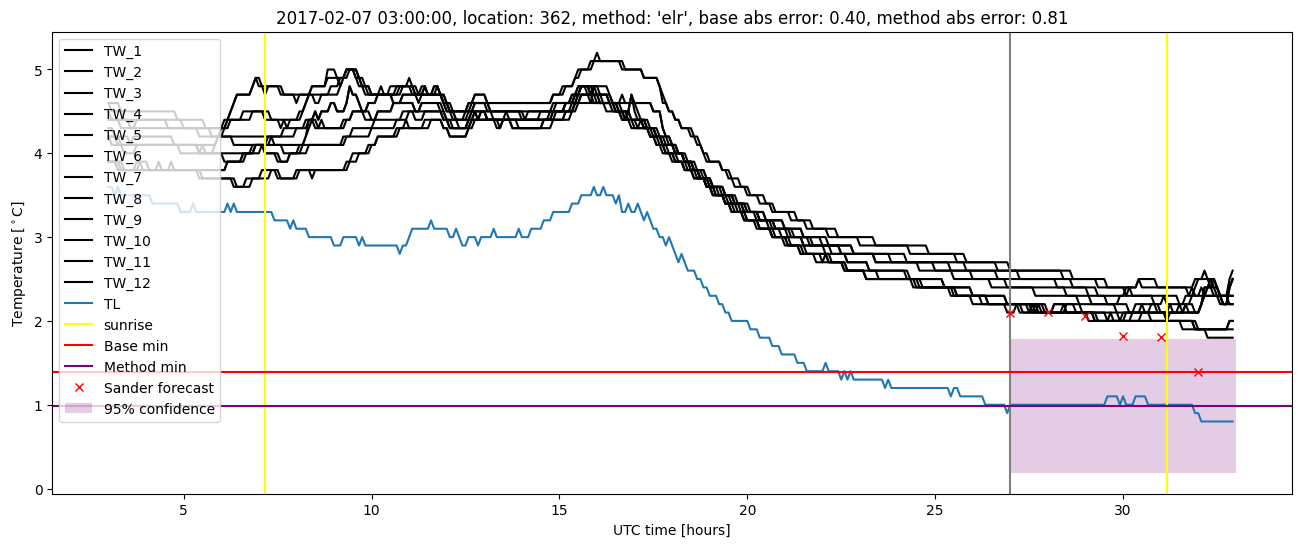
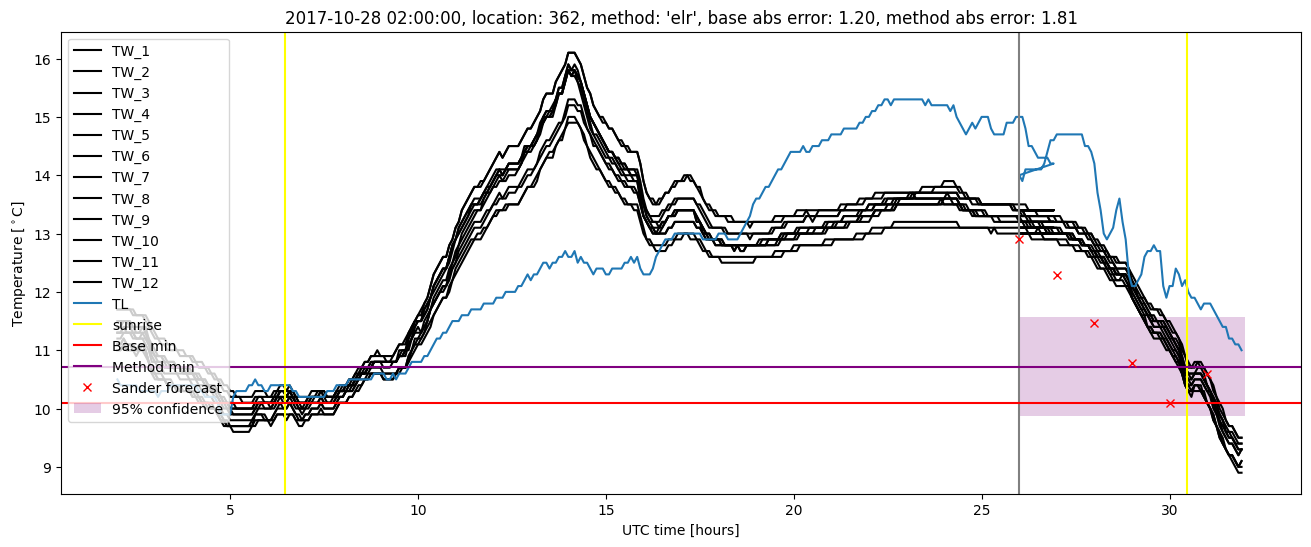
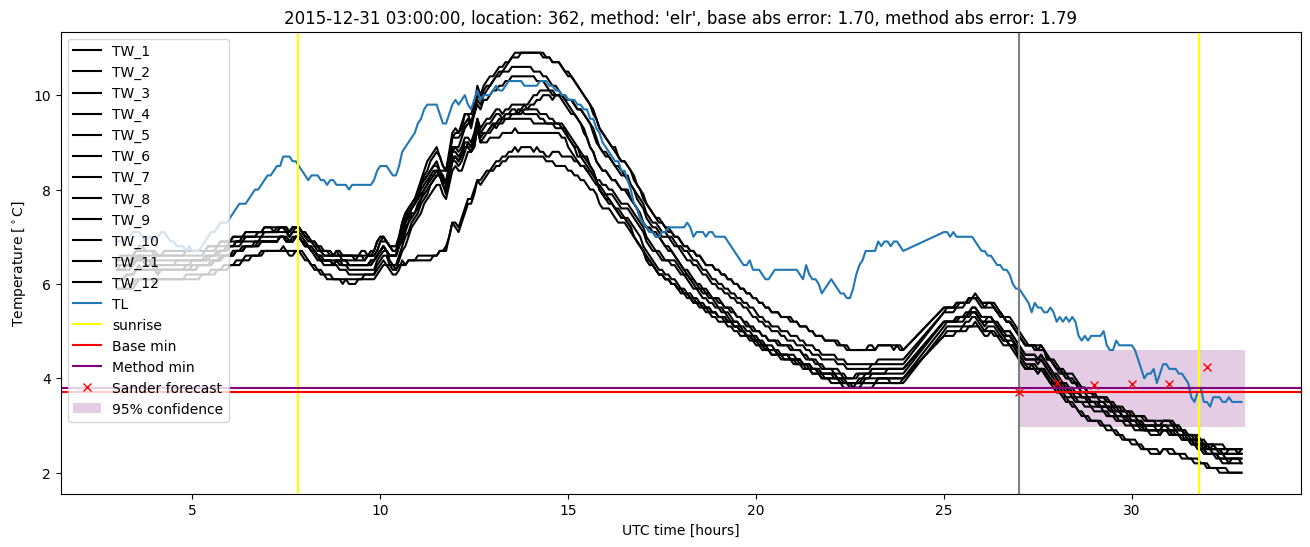
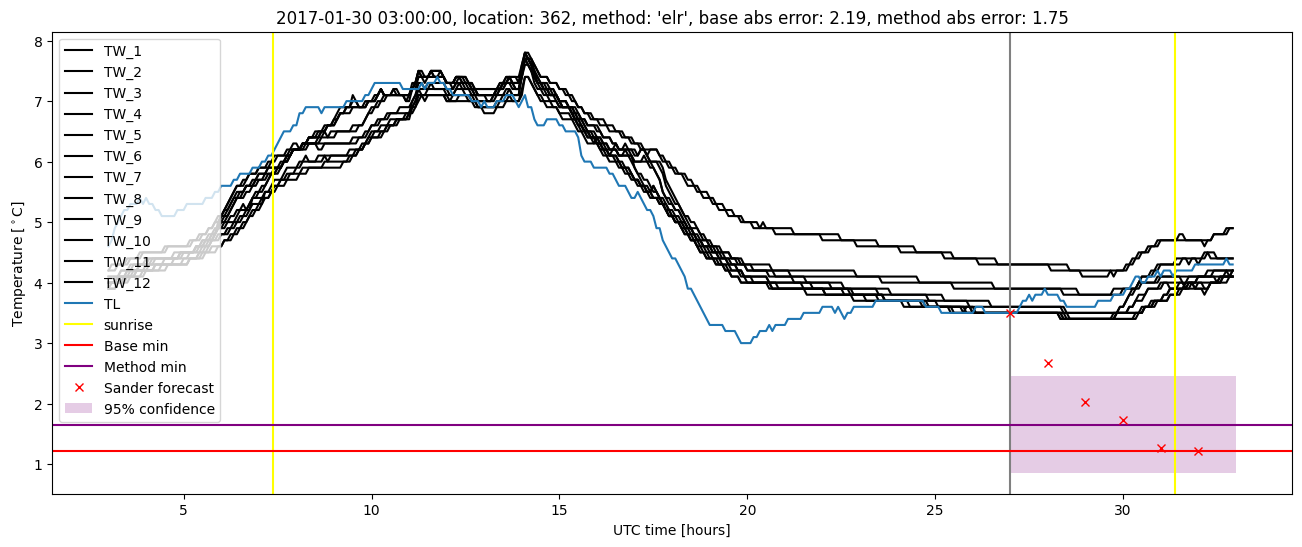
Extended logistic regression results
| names |
period |
power |
significance |
meanSquareError |
absError |
maxError |
CRPS |
IGN |
| baseline |
winter 2016 |
1.000 |
0.053 |
0.326 |
0.442 |
1.702 |
NaN |
NaN |
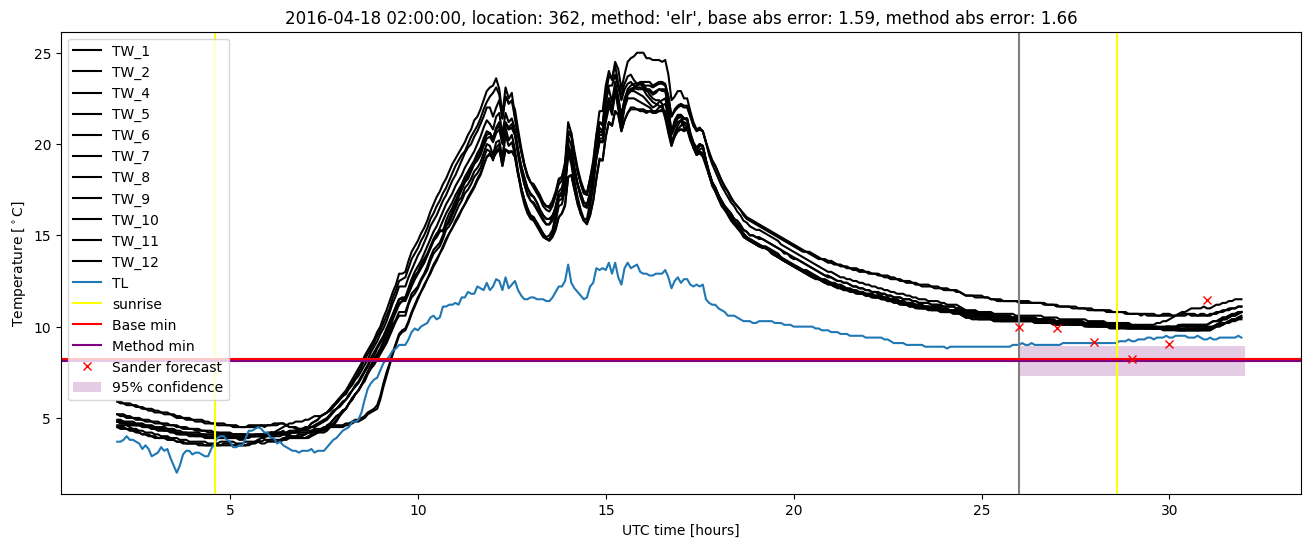
| elr |
winter 2016 |
0.995 |
0.053 |
0.294 |
0.432 |
1.786 |
0.548 |
5.589 |
| baseline |
winter 2017 |
0.957 |
0.088 |
0.391 |
0.458 |
2.189 |
NaN |
NaN |
| elr |
winter 2017 |
0.957 |
0.088 |
0.307 |
0.423 |
1.751 |
0.546 |
6.252 |
| baseline |
winter 2018 |
1.000 |
0.172 |
0.299 |
0.405 |
1.871 |
NaN |
NaN |
| elr |
winter 2018 |
0.989 |
0.103 |
0.236 |
0.384 |
1.814 |
0.526 |
4.724 |
| baseline |
winter 2019 |
1.000 |
0.000e+00 |
0.331 |
0.442 |
1.884 |
NaN |
NaN |
| elr |
winter 2019 |
1.000 |
0.000e+00 |
0.267 |
0.399 |
1.406 |
0.483 |
3.919 |
| baseline |
all |
0.990 |
0.094 |
0.338 |
0.439 |
2.189 |
NaN |
NaN |
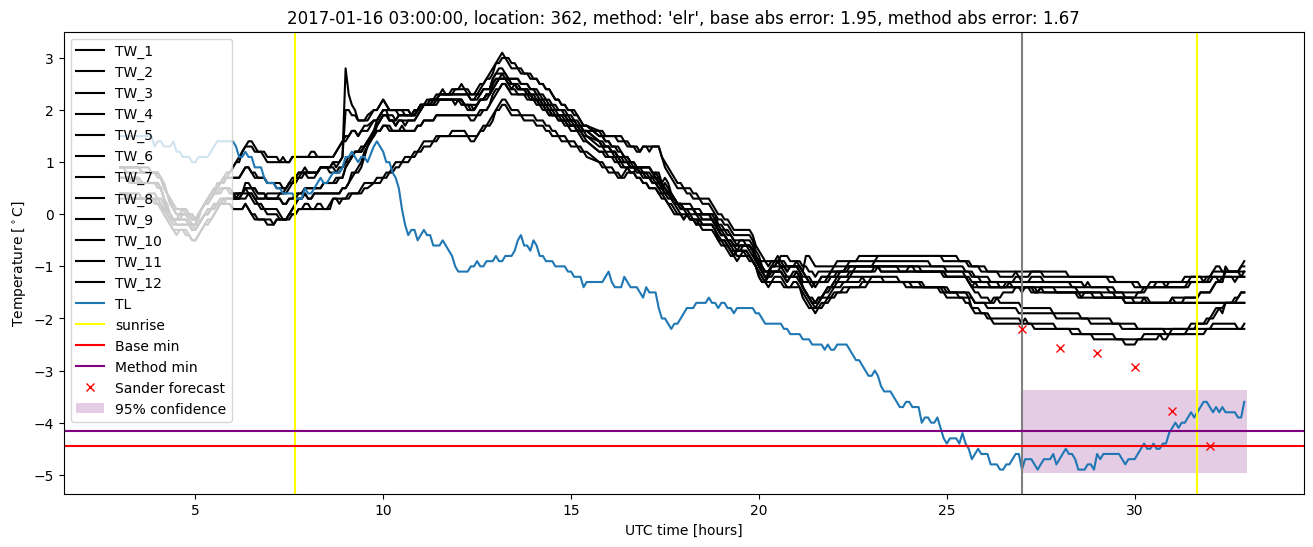
| elr |
all |
0.986 |
0.073 |
0.280 |
0.413 |
1.814 |
0.529 |
5.211 |
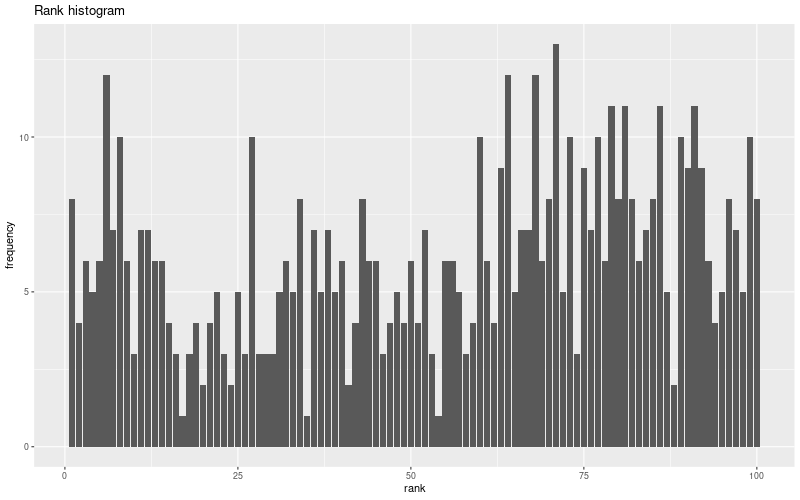
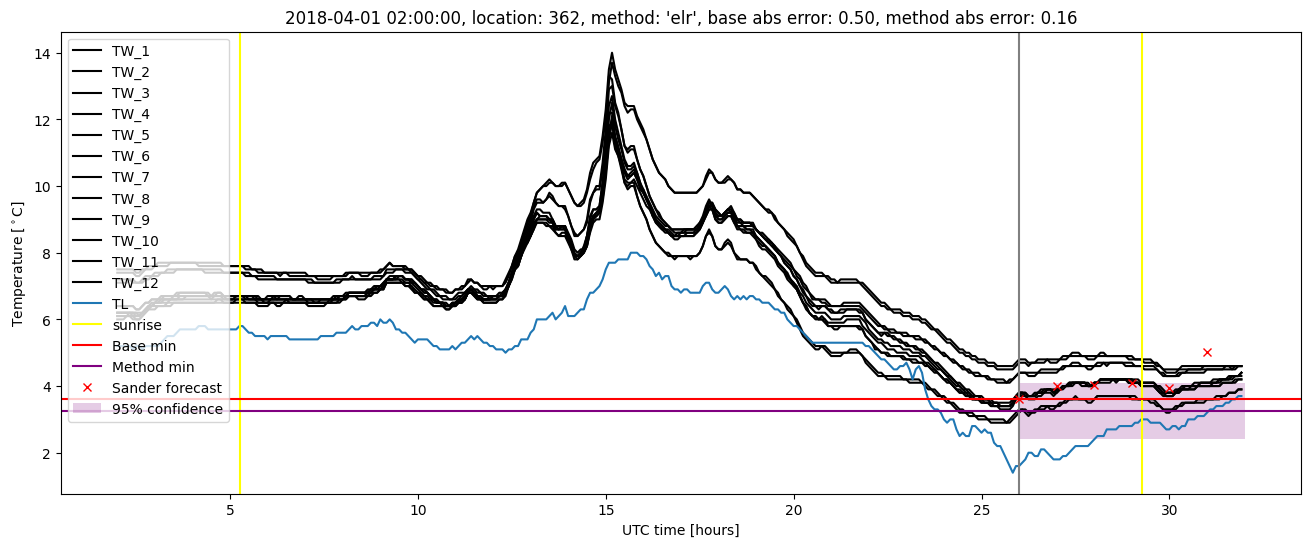
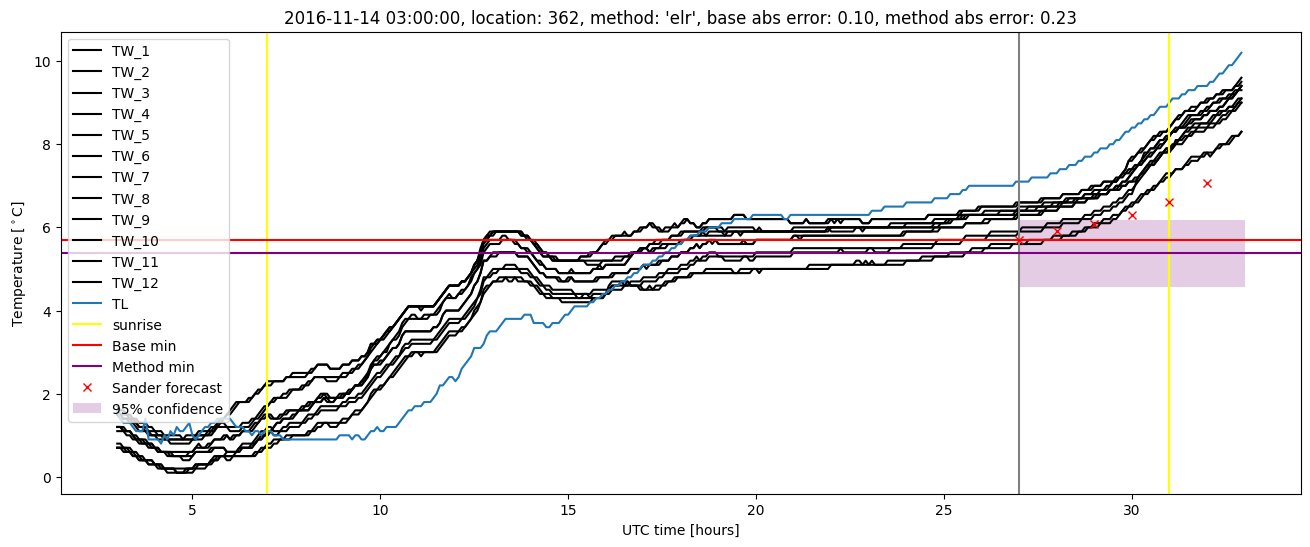
Extended logistic regression plots