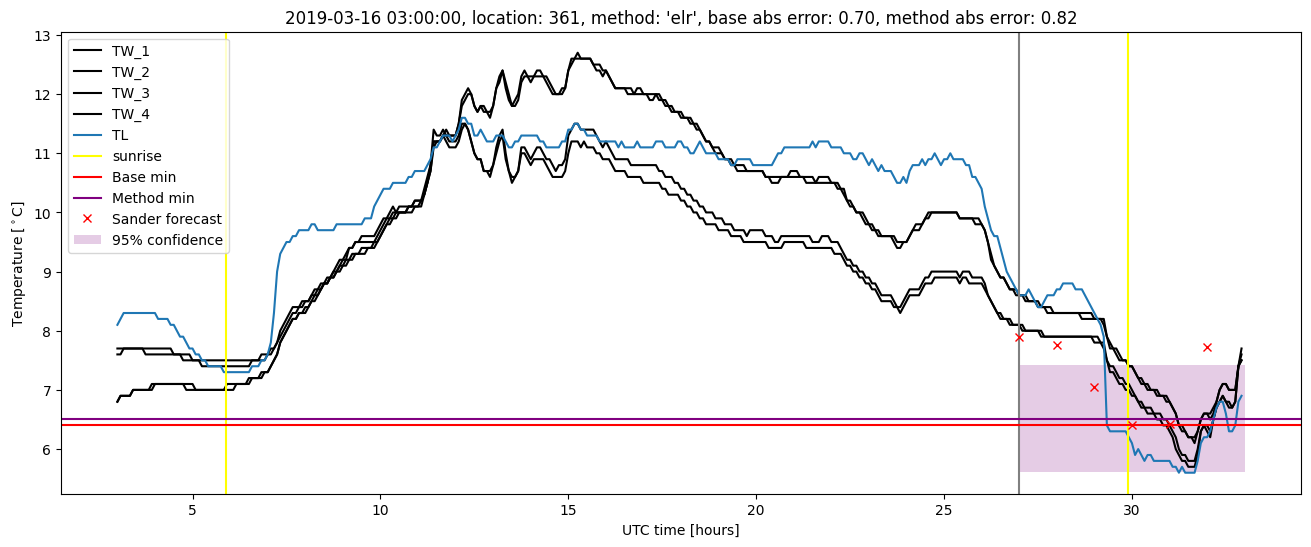
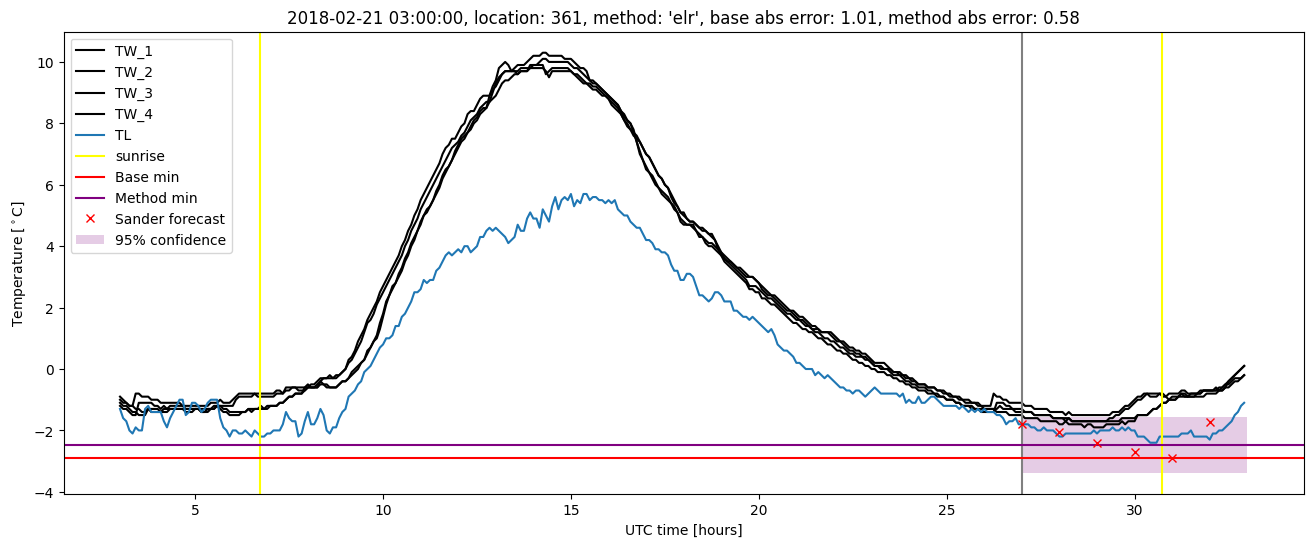
GMS location: 361
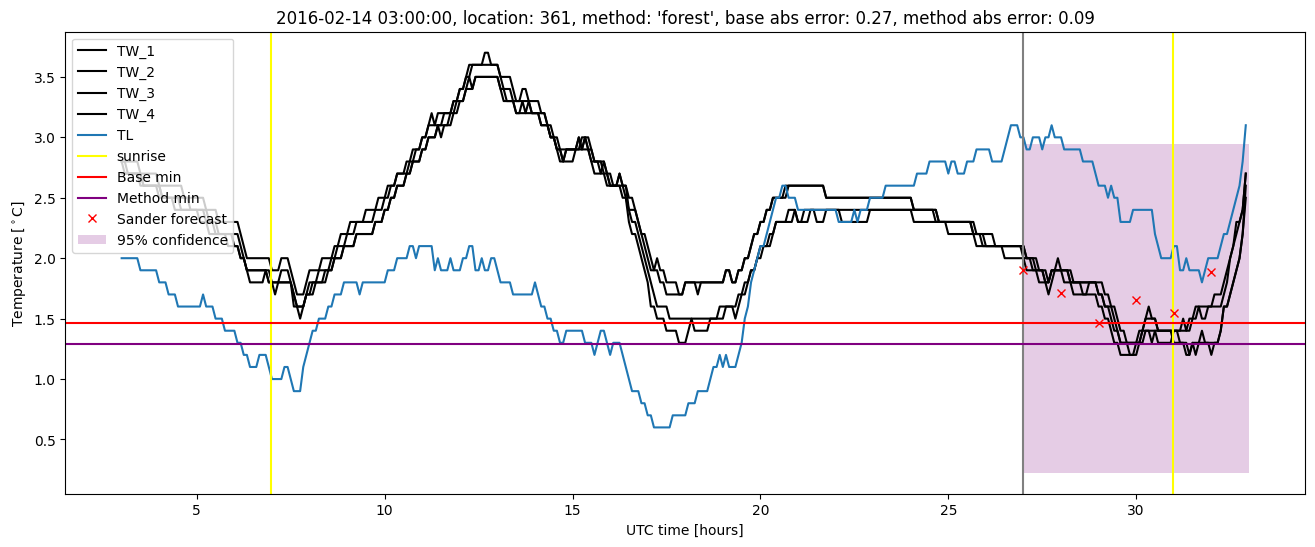
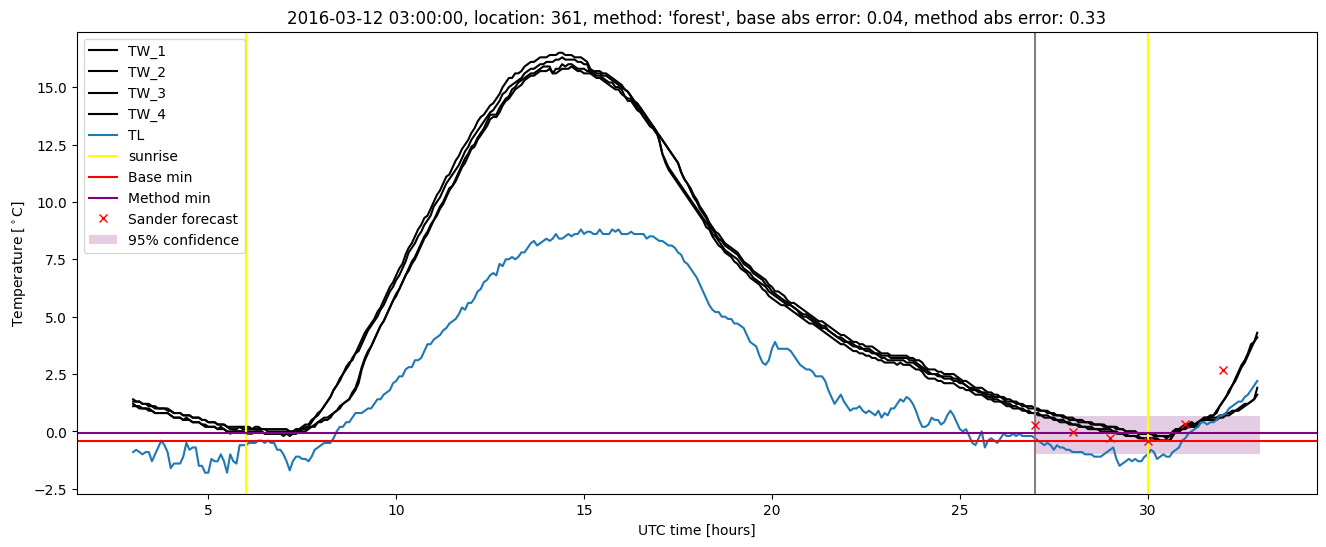
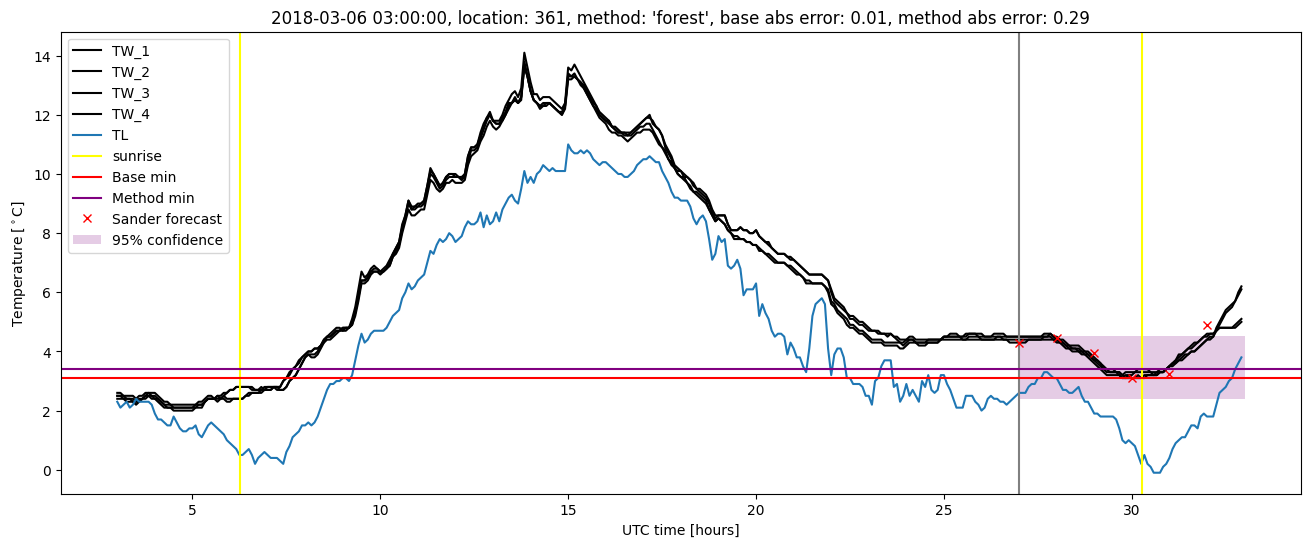
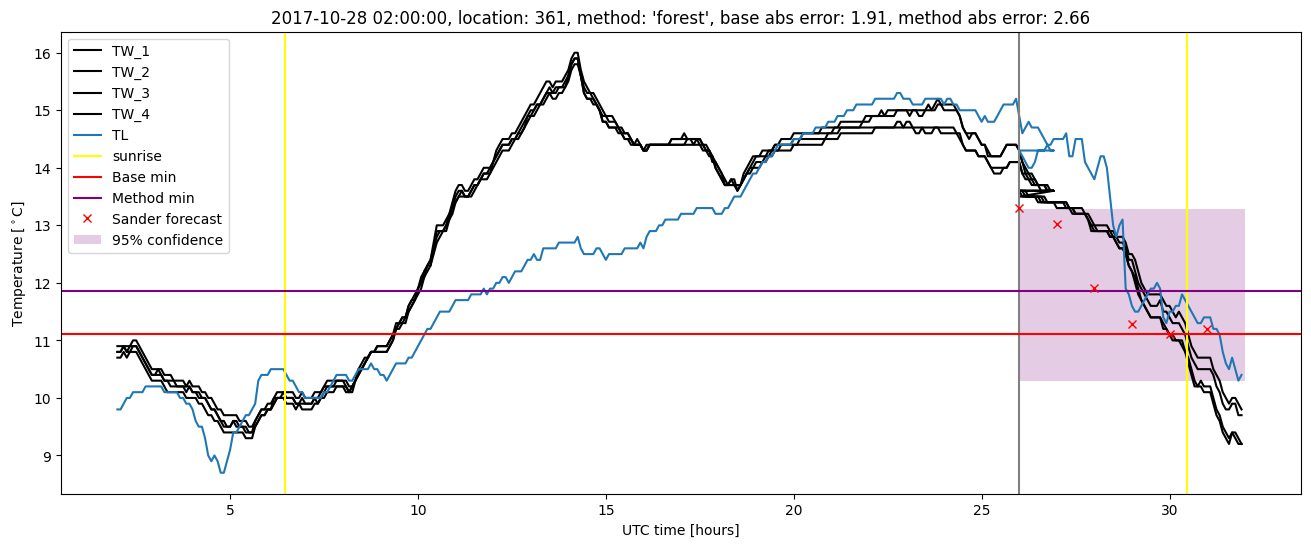
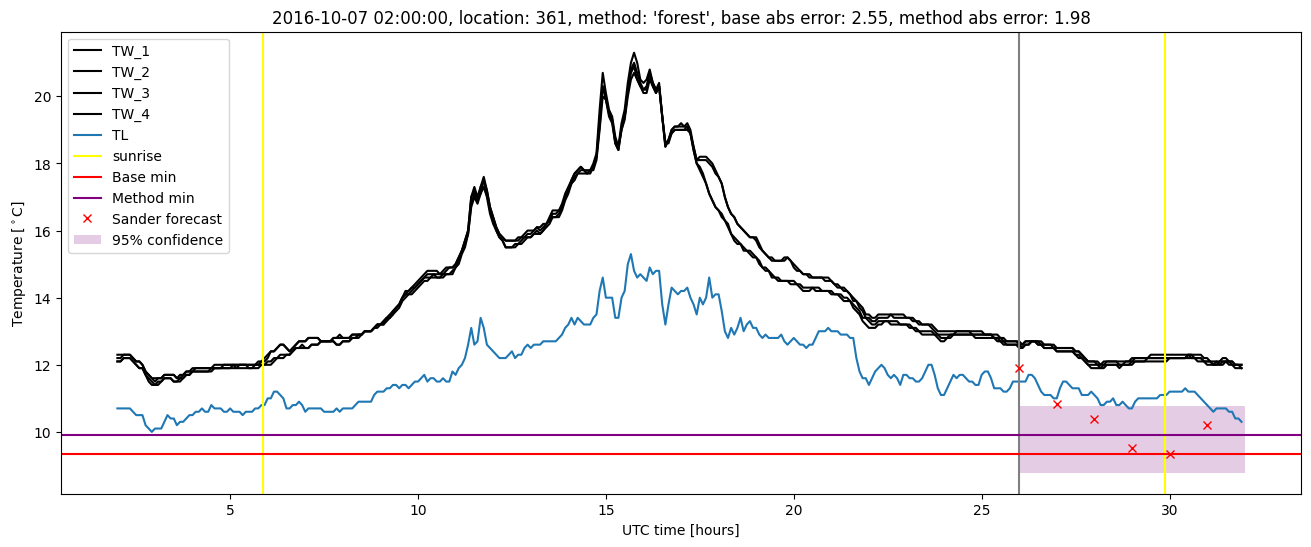
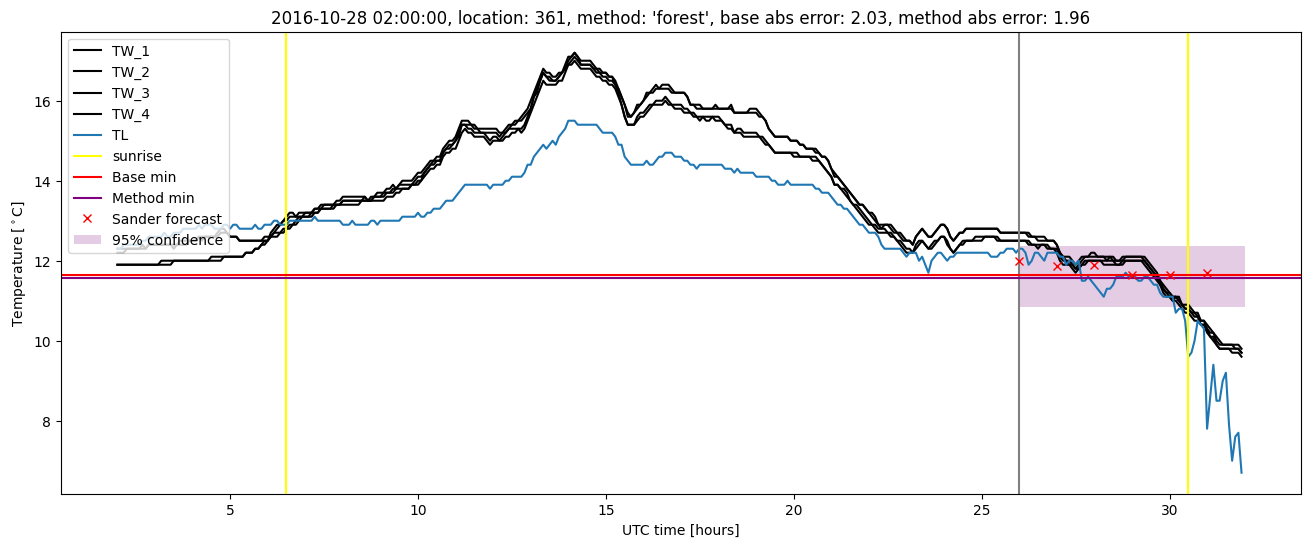
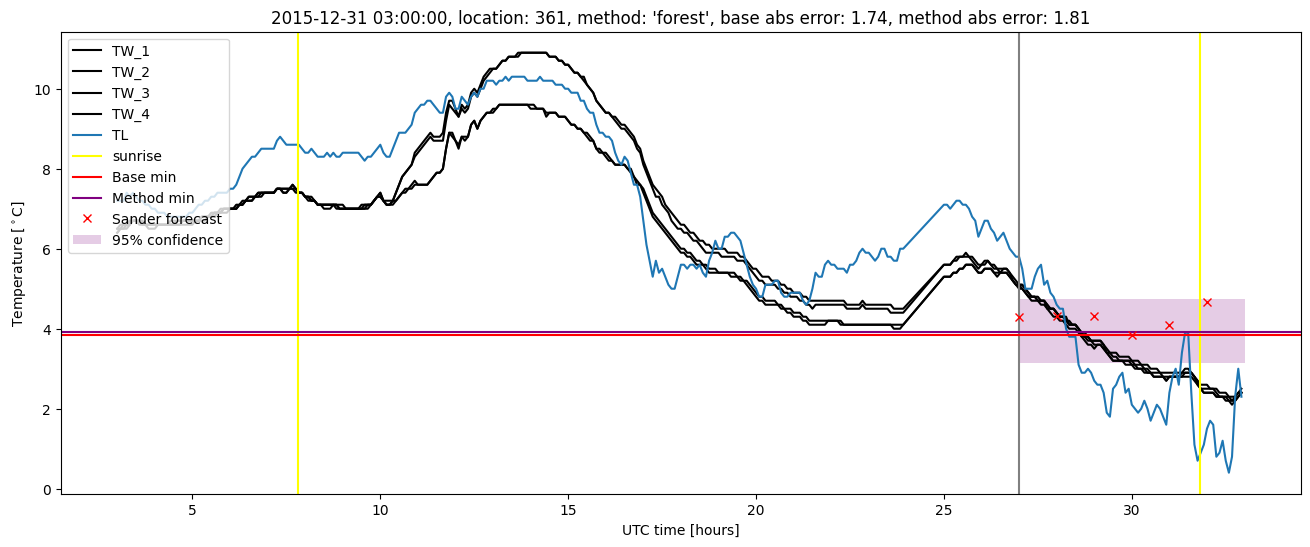
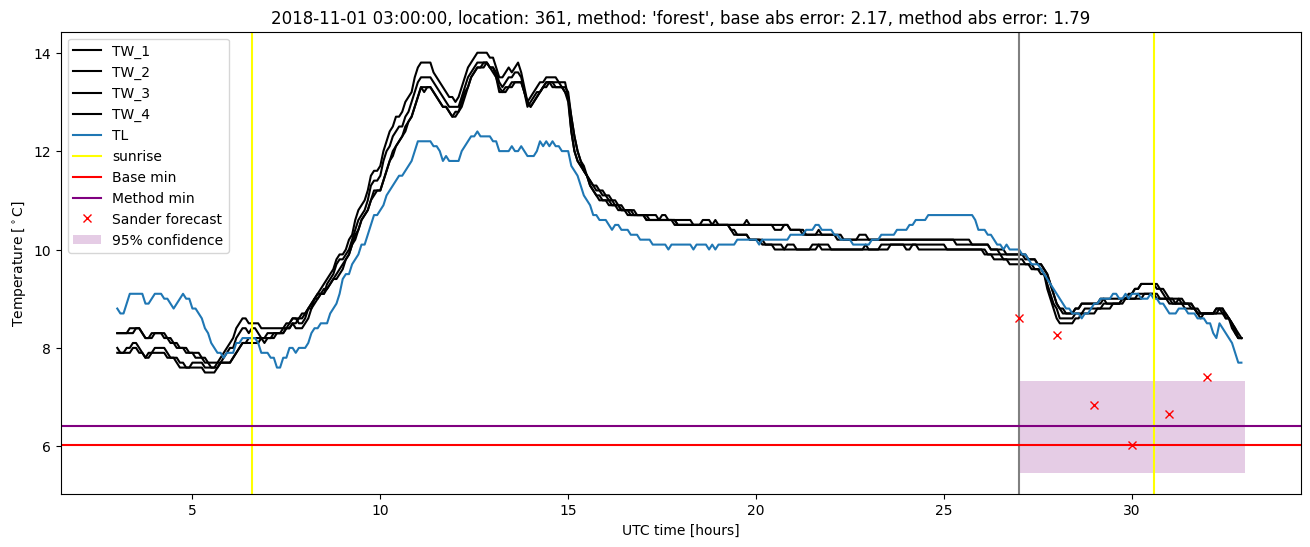
Random forest results
| names |
period |
power |
significance |
meanSquareError |
absError |
maxError |
CRPS |
IGN |
| baseline |
winter 2016 |
0.979 |
0.000e+00 |
0.411 |
0.501 |
1.742 |
NaN |
NaN |
| forest |
winter 2016 |
0.989 |
0.059 |
0.284 |
0.416 |
1.806 |
0.419 |
3.344 |
| baseline |
winter 2017 |
0.943 |
0.033 |
0.510 |
0.514 |
2.554 |
NaN |
NaN |
| forest |
winter 2017 |
0.976 |
0.033 |
0.323 |
0.419 |
1.981 |
0.442 |
4.195 |
| baseline |
winter 2018 |
0.986 |
0.111 |
0.325 |
0.432 |
1.913 |
NaN |
NaN |
| forest |
winter 2018 |
0.993 |
0.148 |
0.307 |
0.403 |
2.655 |
0.427 |
2.801 |
| baseline |
winter 2019 |
0.993 |
0.000e+00 |
0.461 |
0.506 |
2.171 |
NaN |
NaN |
| forest |
winter 2019 |
1.000 |
0.077 |
0.325 |
0.443 |
1.786 |
0.414 |
2.829 |
| baseline |
all |
0.977 |
0.046 |
0.423 |
0.488 |
2.554 |
NaN |
NaN |
| forest |
all |
0.990 |
0.081 |
0.308 |
0.419 |
2.655 |
0.425 |
3.281 |
Random forest plots
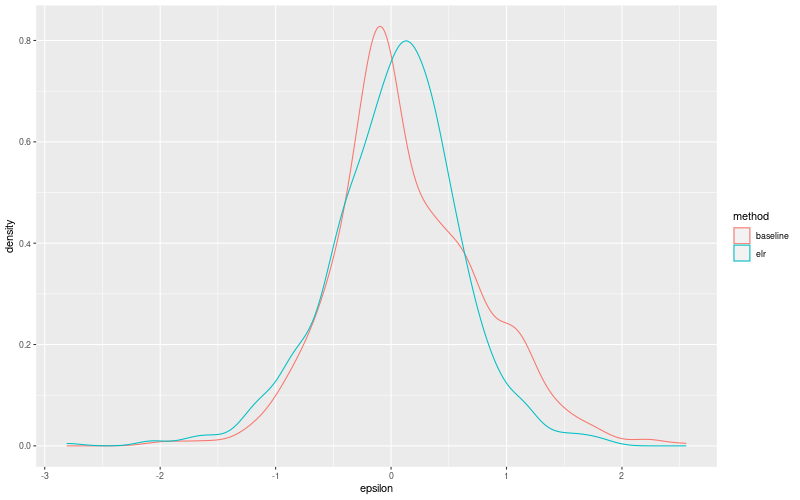
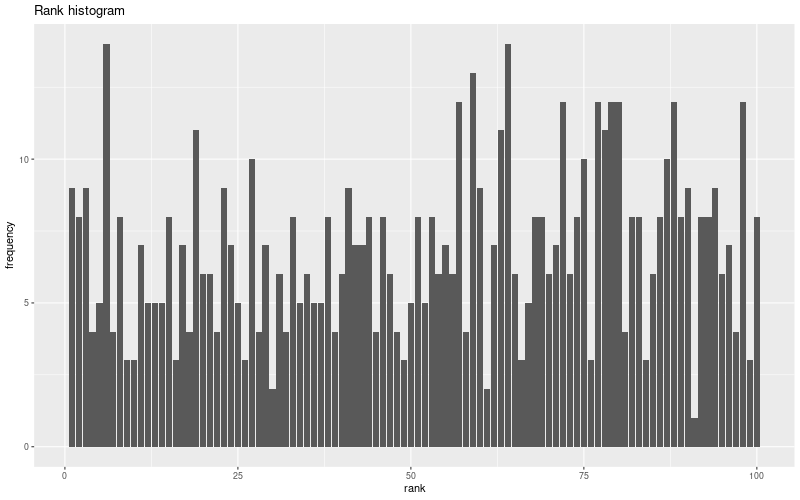
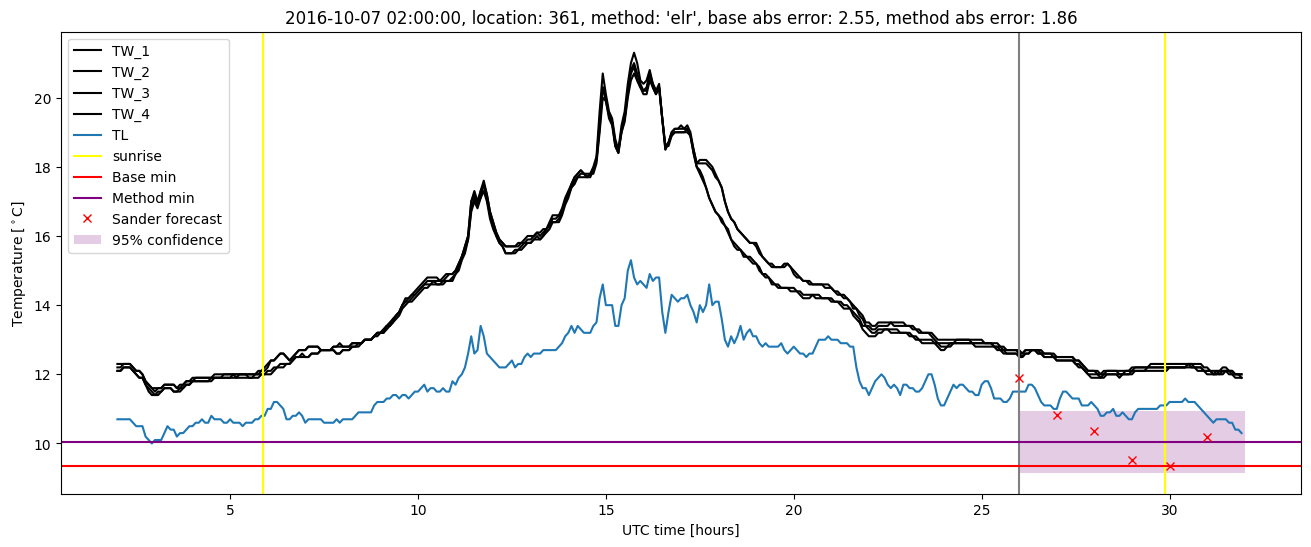
Extended logistic regression results
| names |
period |
power |
significance |
meanSquareError |
absError |
maxError |
CRPS |
IGN |
| baseline |
winter 2016 |
0.979 |
0.000e+00 |
0.411 |
0.501 |
1.742 |
NaN |
NaN |
| elr |
winter 2016 |
0.989 |
0.000e+00 |
0.312 |
0.450 |
1.813 |
0.506 |
3.143 |
| baseline |
winter 2017 |
0.943 |
0.033 |
0.510 |
0.514 |
2.554 |
NaN |
NaN |
| elr |
winter 2017 |
0.984 |
0.033 |
0.361 |
0.436 |
2.063 |
0.463 |
3.021 |
| baseline |
winter 2018 |
0.986 |
0.111 |
0.325 |
0.432 |
1.913 |
NaN |
NaN |
| elr |
winter 2018 |
0.979 |
0.111 |
0.345 |
0.429 |
2.806 |
0.507 |
3.469 |
| baseline |
winter 2019 |
0.993 |
0.000e+00 |
0.461 |
0.506 |
2.171 |
NaN |
NaN |
| elr |
winter 2019 |
1.000 |
0.077 |
0.300 |
0.428 |
1.726 |
0.463 |
2.849 |
| baseline |
all |
0.977 |
0.046 |
0.423 |
0.488 |
2.554 |
NaN |
NaN |
| elr |
all |
0.988 |
0.058 |
0.329 |
0.436 |
2.806 |
0.487 |
3.129 |
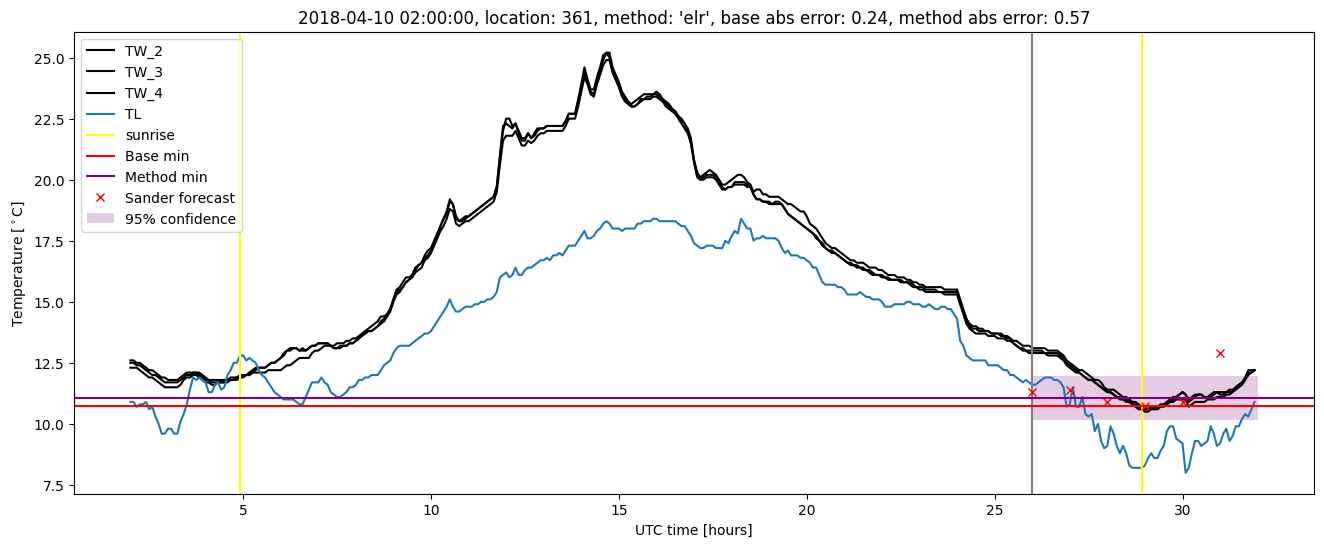
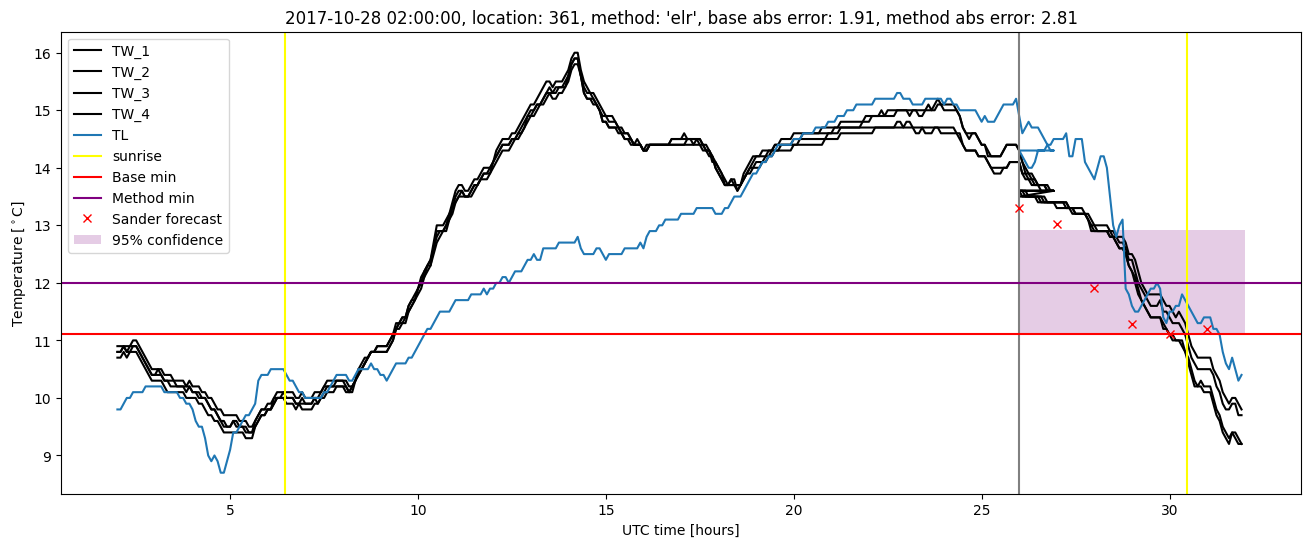
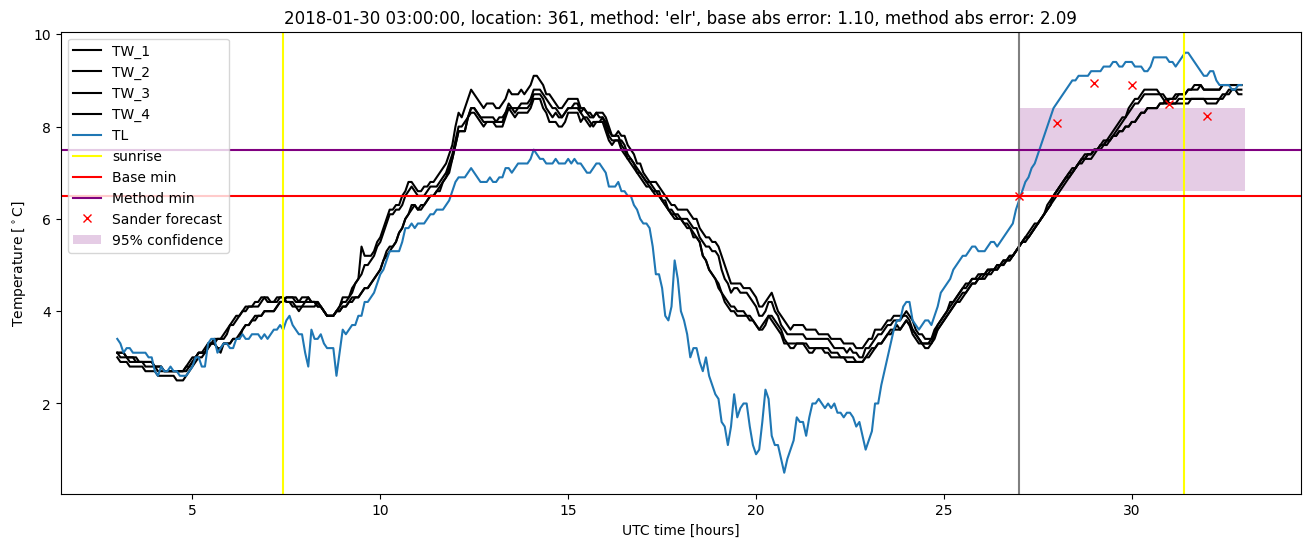
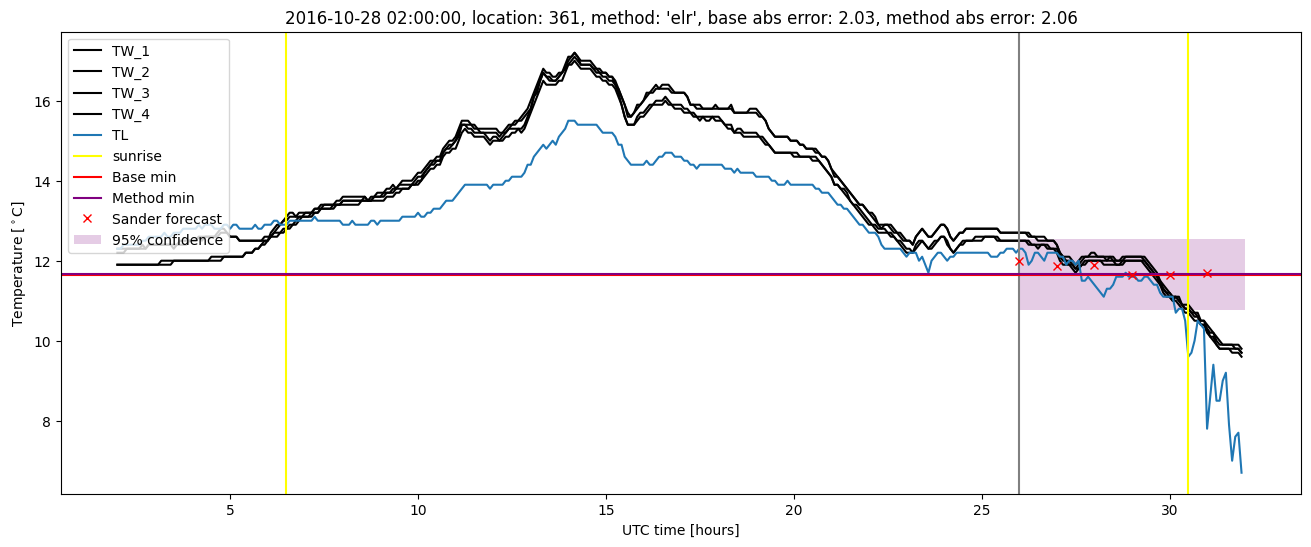
Extended logistic regression plots