GMS location: 360
Random forest results
| names |
period |
power |
significance |
meanSquareError |
absError |
maxError |
CRPS |
IGN |
| baseline |
winter 2016 |
0.990 |
0.000e+00 |
0.577 |
0.586 |
2.144 |
NaN |
NaN |
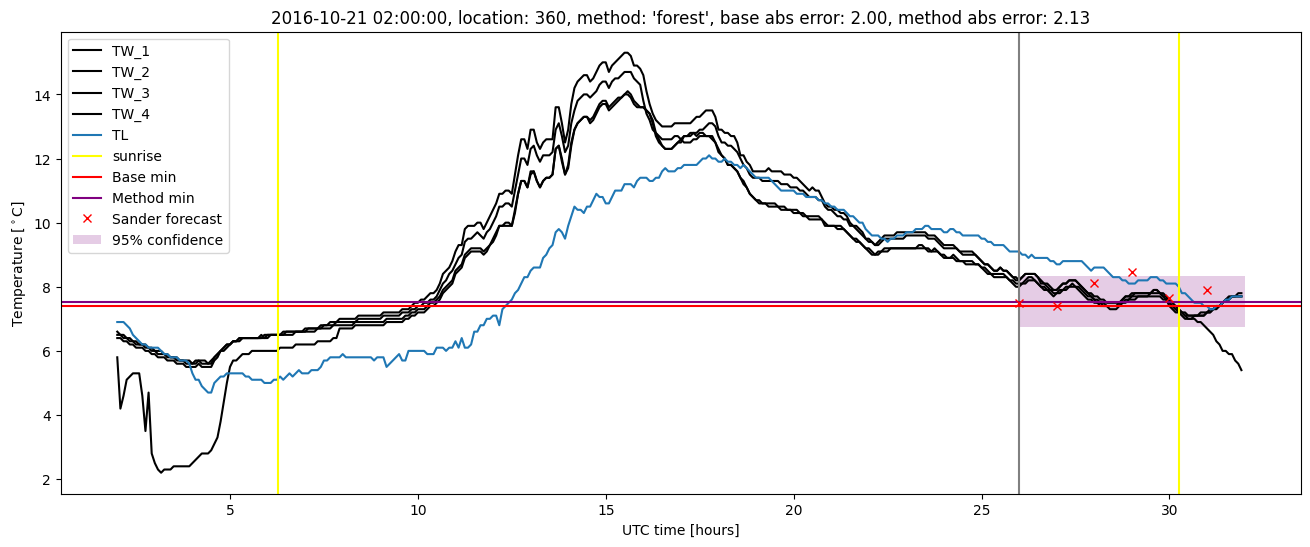
| forest |
winter 2016 |
1.000 |
0.125 |
0.274 |
0.402 |
1.789 |
0.396 |
2.761 |
| baseline |
winter 2017 |
0.956 |
0.069 |
0.642 |
0.604 |
2.958 |
NaN |
NaN |
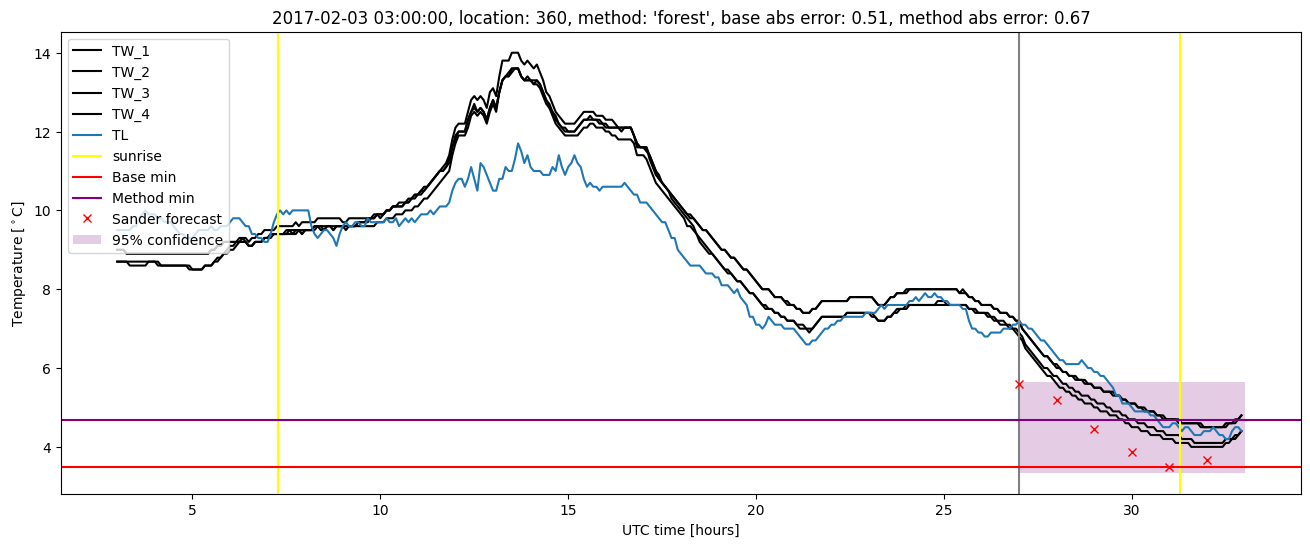
| forest |
winter 2017 |
0.982 |
0.069 |
0.312 |
0.423 |
2.130 |
0.414 |
3.224 |
| baseline |
winter 2018 |
0.987 |
0.182 |
0.481 |
0.528 |
1.848 |
NaN |
NaN |
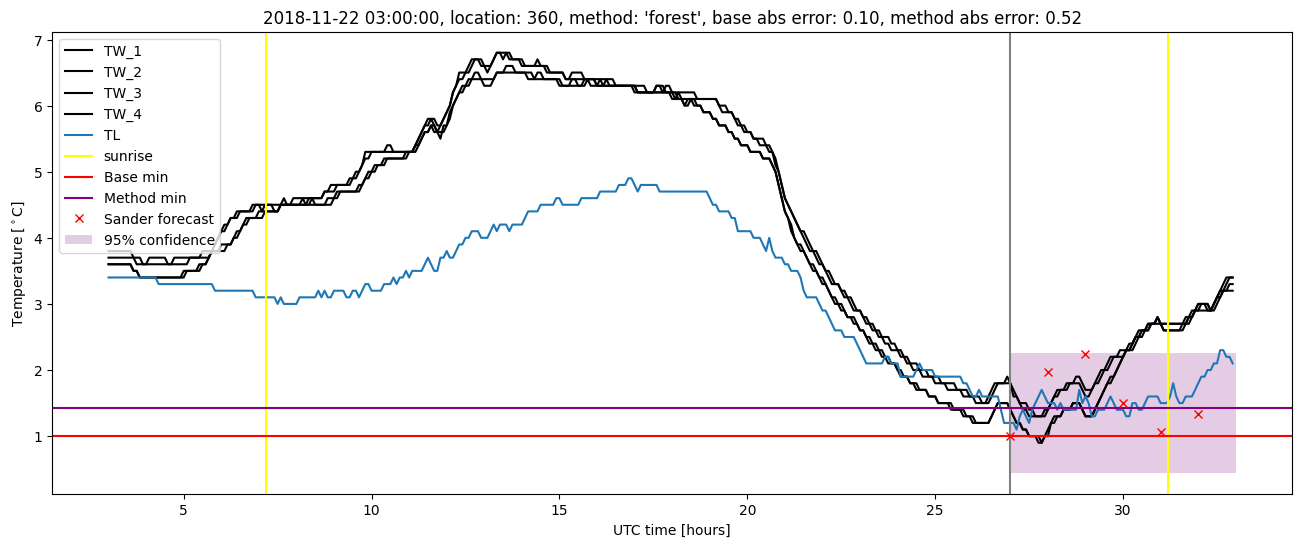
| forest |
winter 2018 |
0.994 |
0.182 |
0.295 |
0.412 |
1.846 |
0.401 |
2.252 |
| baseline |
winter 2019 |
0.986 |
0.000e+00 |
0.606 |
0.569 |
2.548 |
NaN |
NaN |
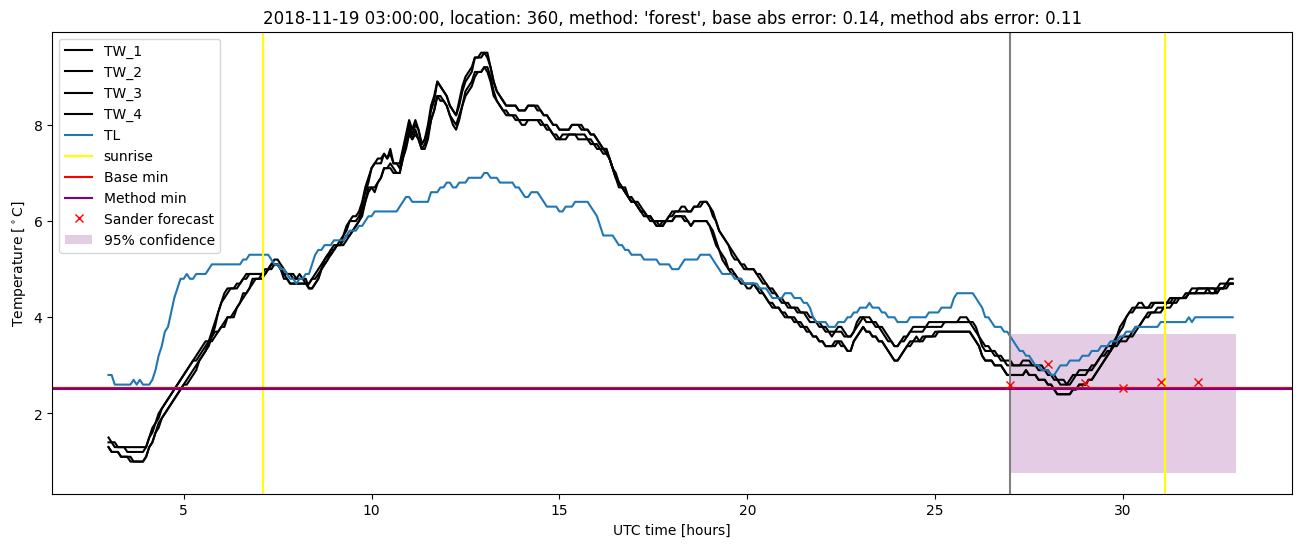
| forest |
winter 2019 |
0.993 |
0.000e+00 |
0.270 |
0.383 |
1.587 |
0.403 |
2.217 |
| baseline |
all |
0.982 |
0.078 |
0.572 |
0.570 |
2.958 |
NaN |
NaN |
| forest |
all |
0.993 |
0.104 |
0.286 |
0.405 |
2.130 |
0.403 |
2.601 |
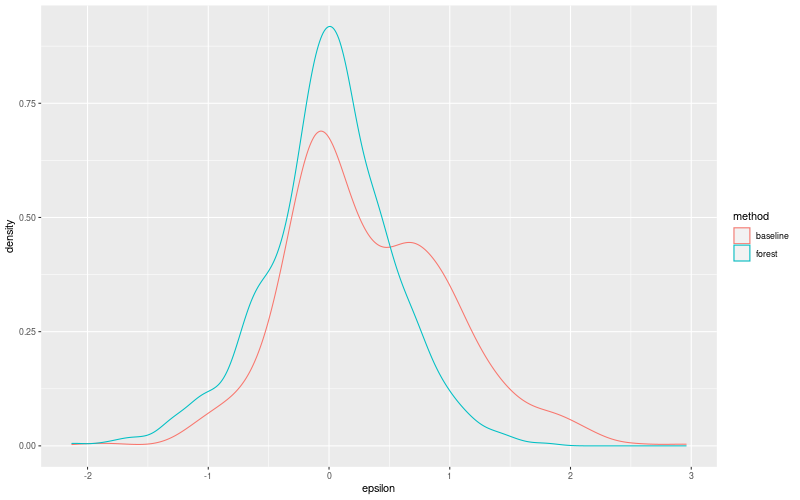
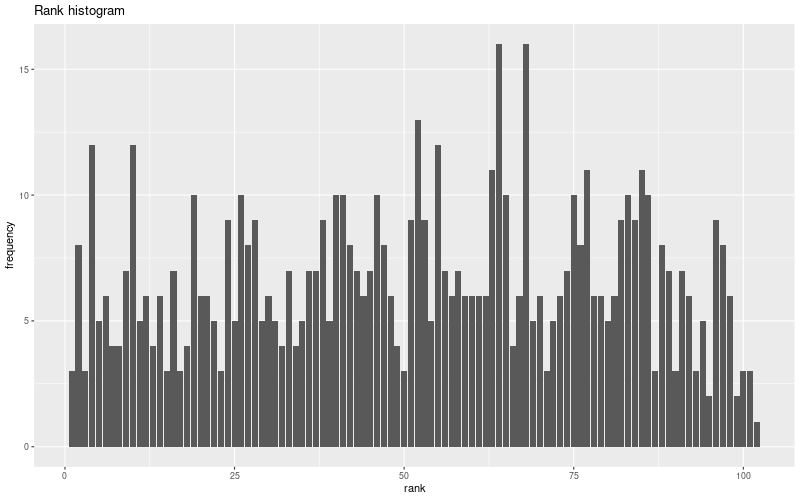
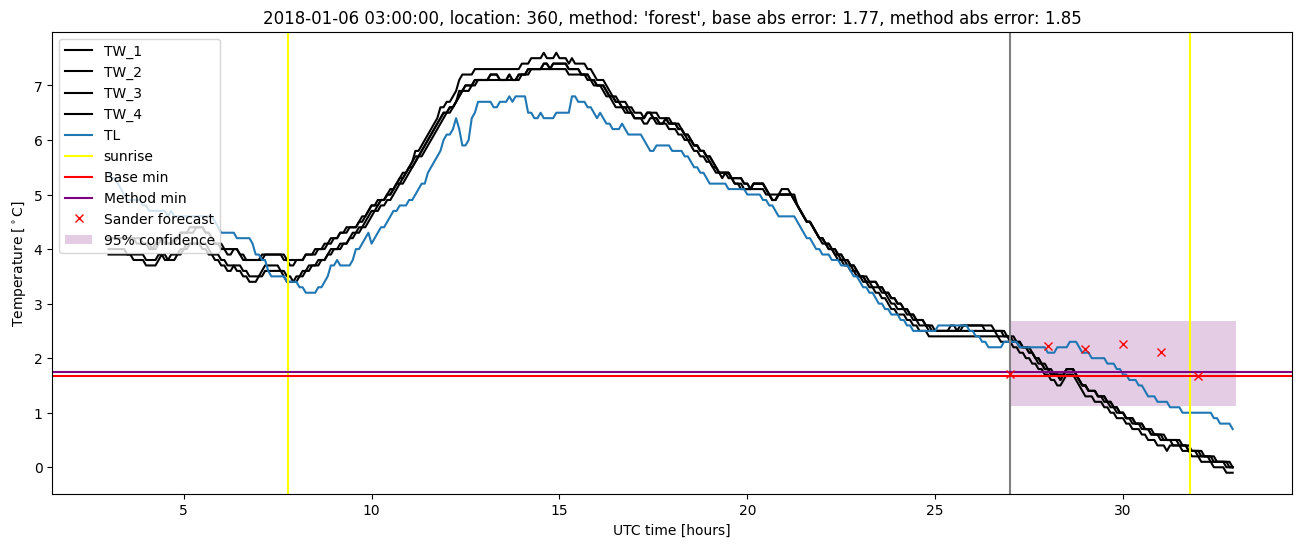
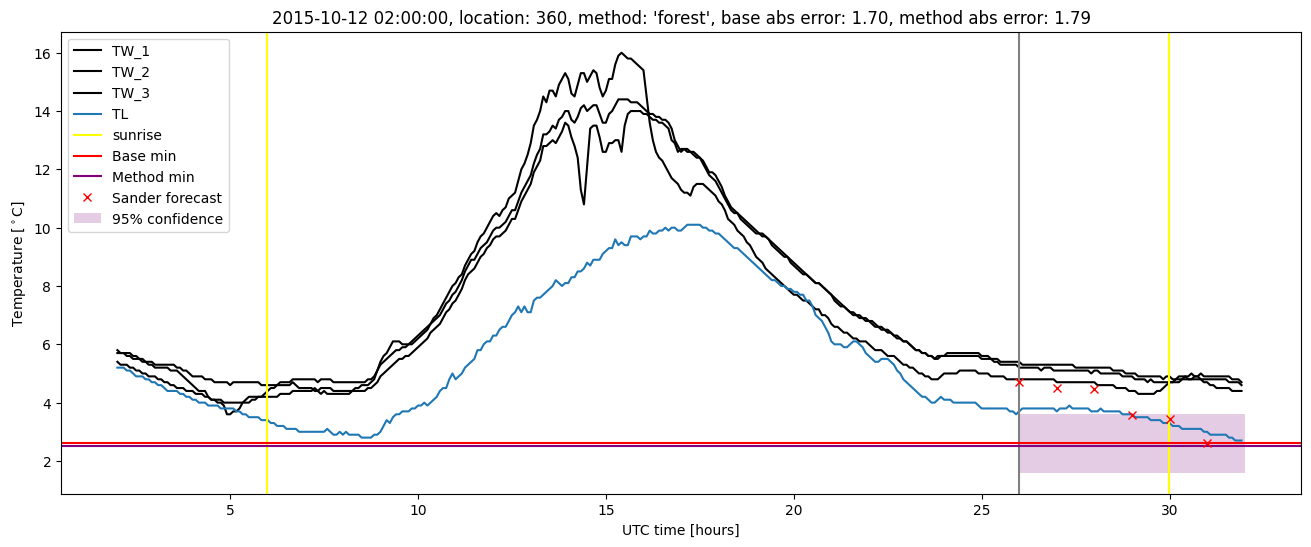
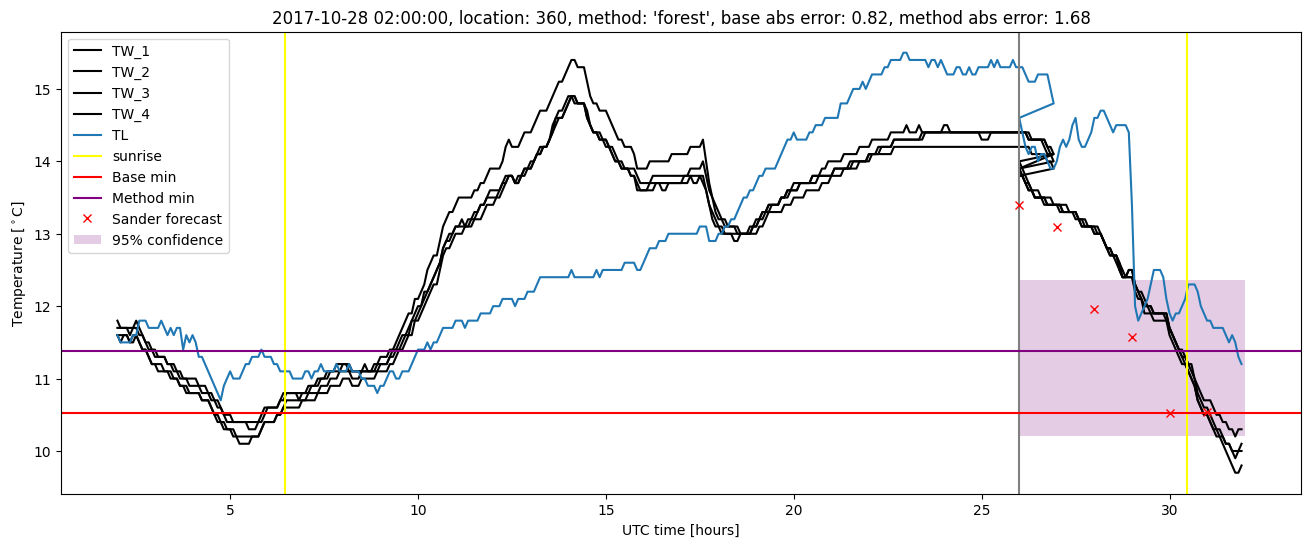
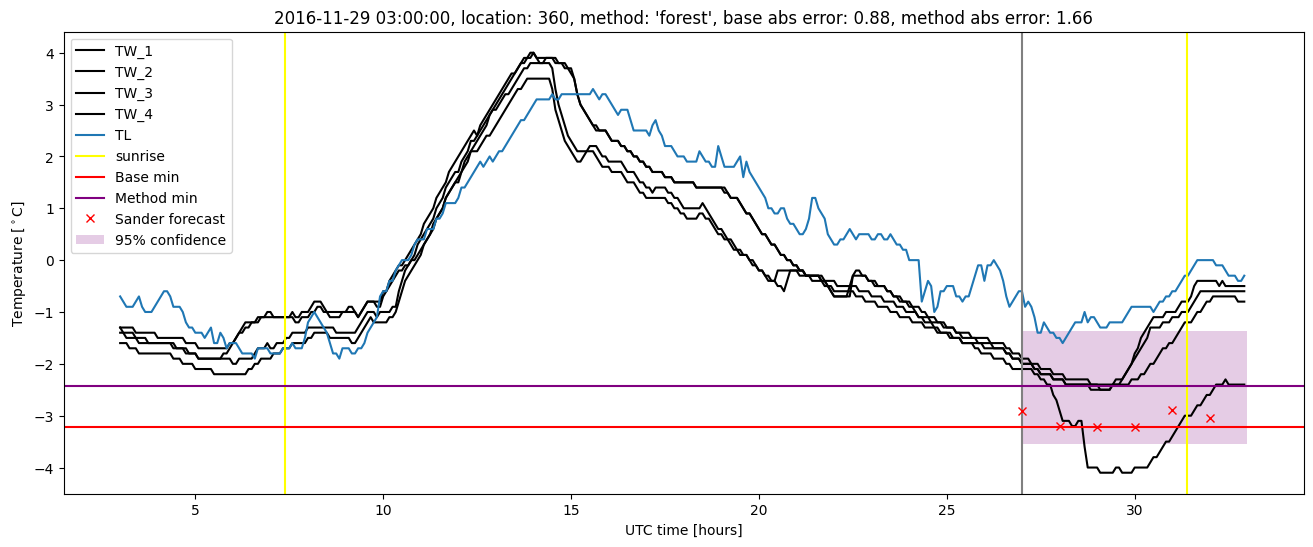
Random forest plots
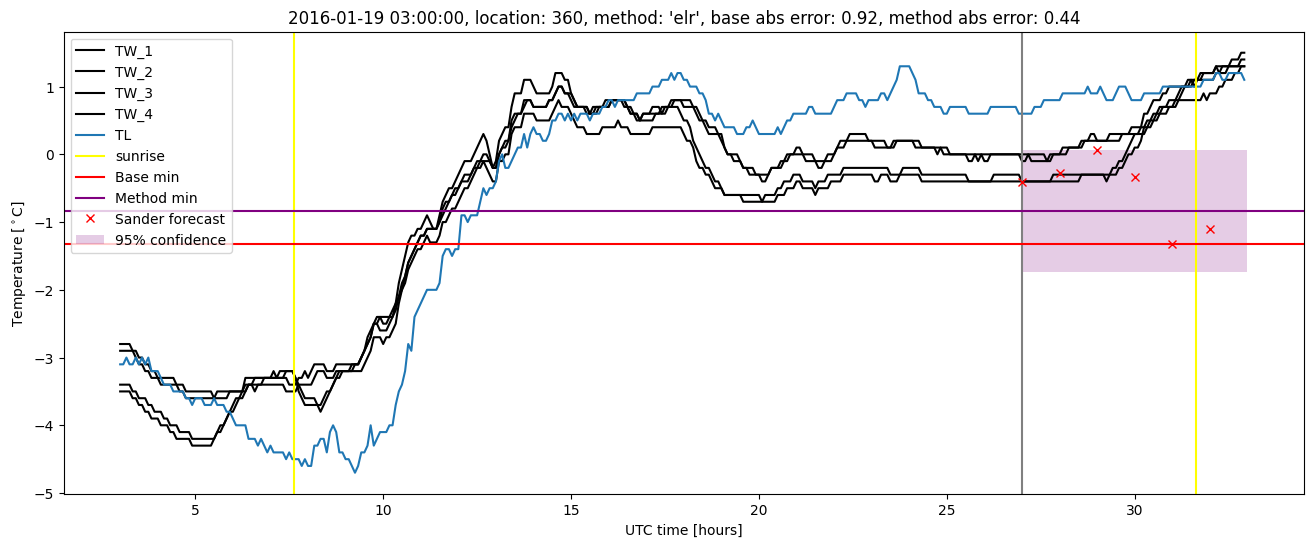
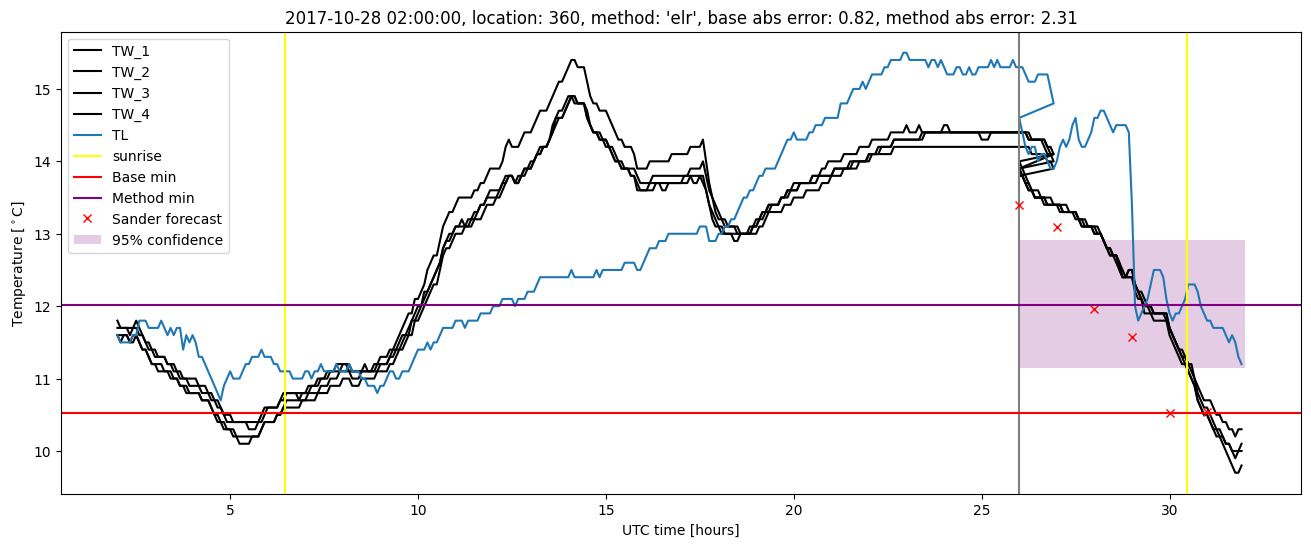
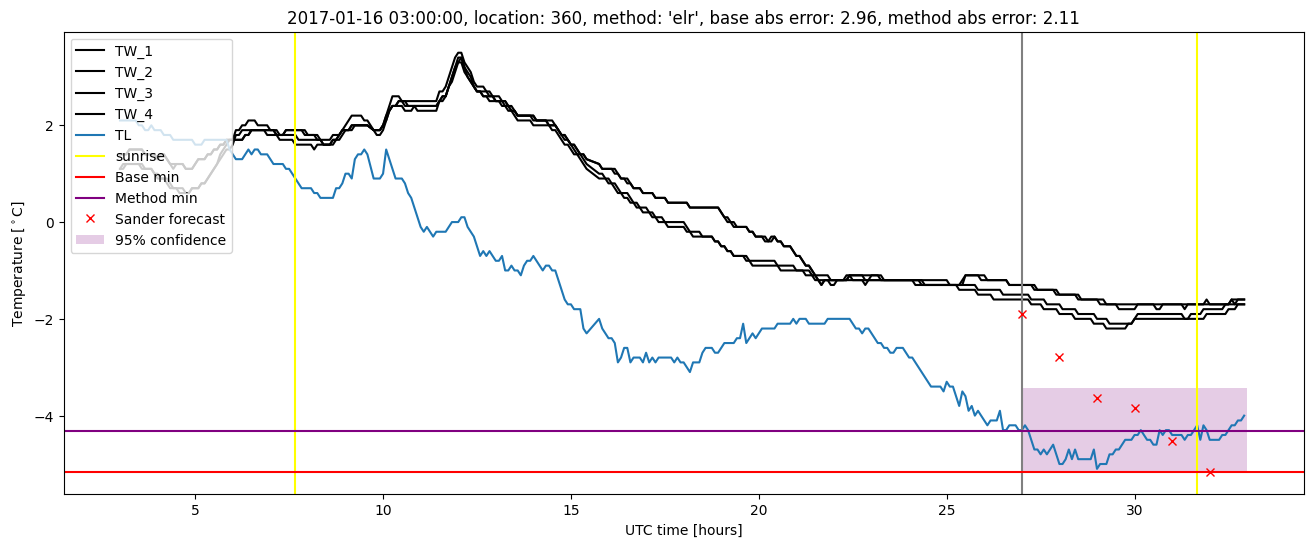
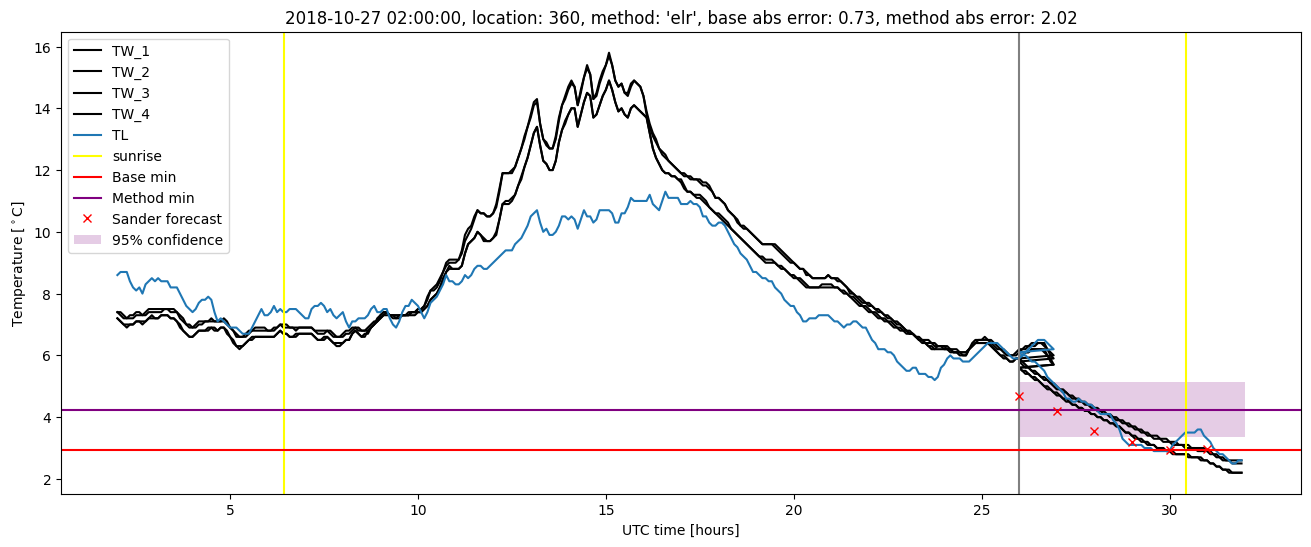
Extended logistic regression results
| names |
period |
power |
significance |
meanSquareError |
absError |
maxError |
CRPS |
IGN |
| baseline |
winter 2016 |
0.990 |
0.000e+00 |
0.577 |
0.586 |
2.144 |
NaN |
NaN |
| elr |
winter 2016 |
0.995 |
0.125 |
0.291 |
0.433 |
2.003 |
0.498 |
3.360 |
| baseline |
winter 2017 |
0.956 |
0.069 |
0.642 |
0.604 |
2.958 |
NaN |
NaN |
| elr |
winter 2017 |
0.974 |
0.000e+00 |
0.351 |
0.444 |
2.114 |
0.469 |
3.239 |
| baseline |
winter 2018 |
0.987 |
0.182 |
0.481 |
0.528 |
1.848 |
NaN |
NaN |
| elr |
winter 2018 |
0.987 |
0.182 |
0.314 |
0.418 |
2.313 |
0.509 |
3.779 |
| baseline |
winter 2019 |
0.986 |
0.000e+00 |
0.606 |
0.569 |
2.548 |
NaN |
NaN |
| elr |
winter 2019 |
0.986 |
0.000e+00 |
0.275 |
0.384 |
2.020 |
0.487 |
3.245 |
| baseline |
all |
0.982 |
0.078 |
0.572 |
0.570 |
2.958 |
NaN |
NaN |
| elr |
all |
0.987 |
0.078 |
0.306 |
0.420 |
2.313 |
0.492 |
3.418 |
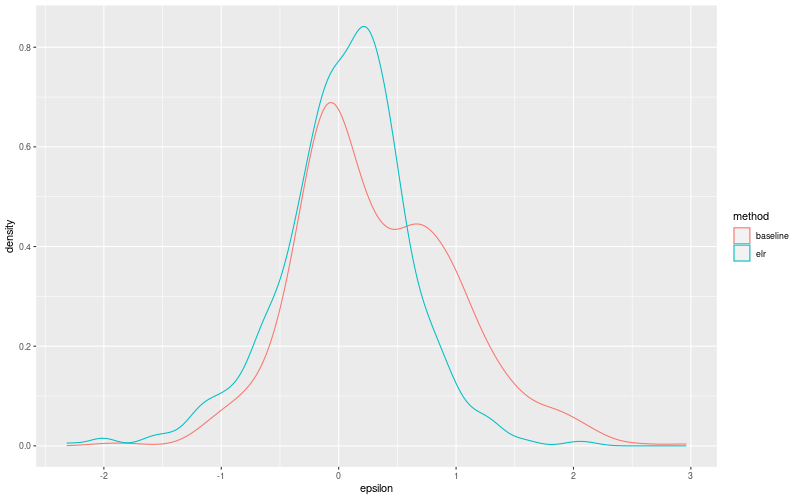
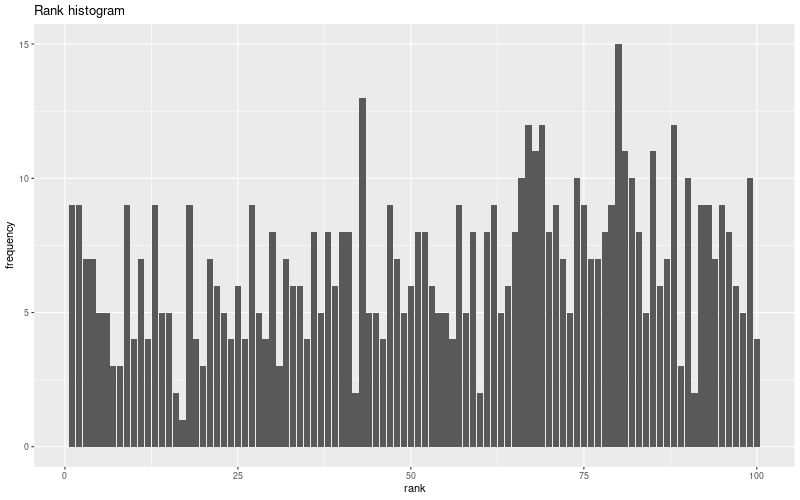
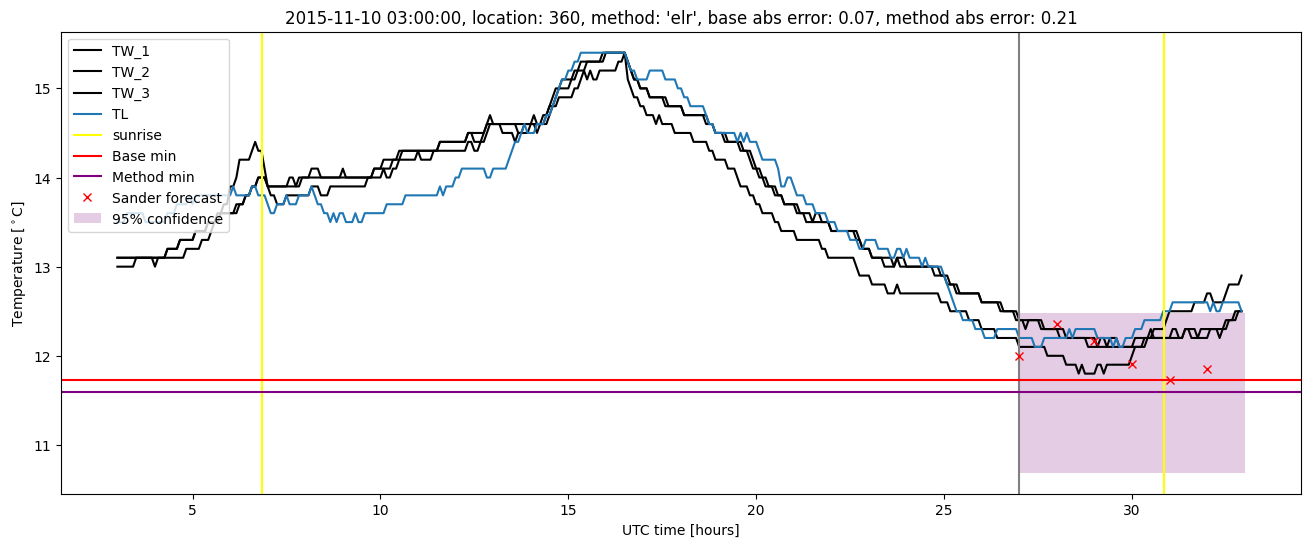
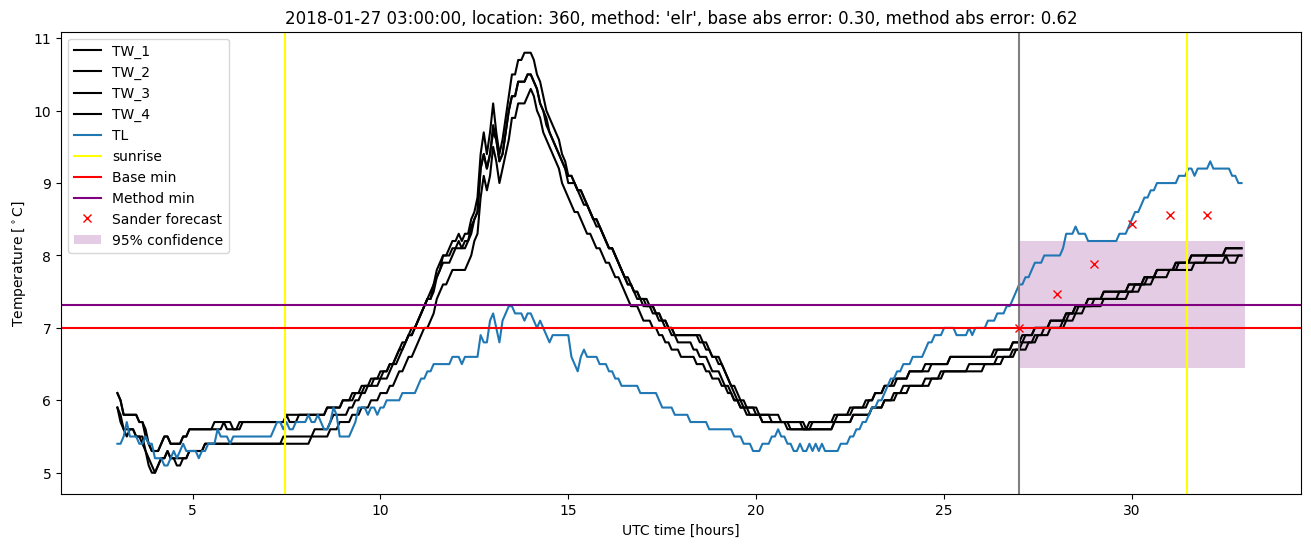
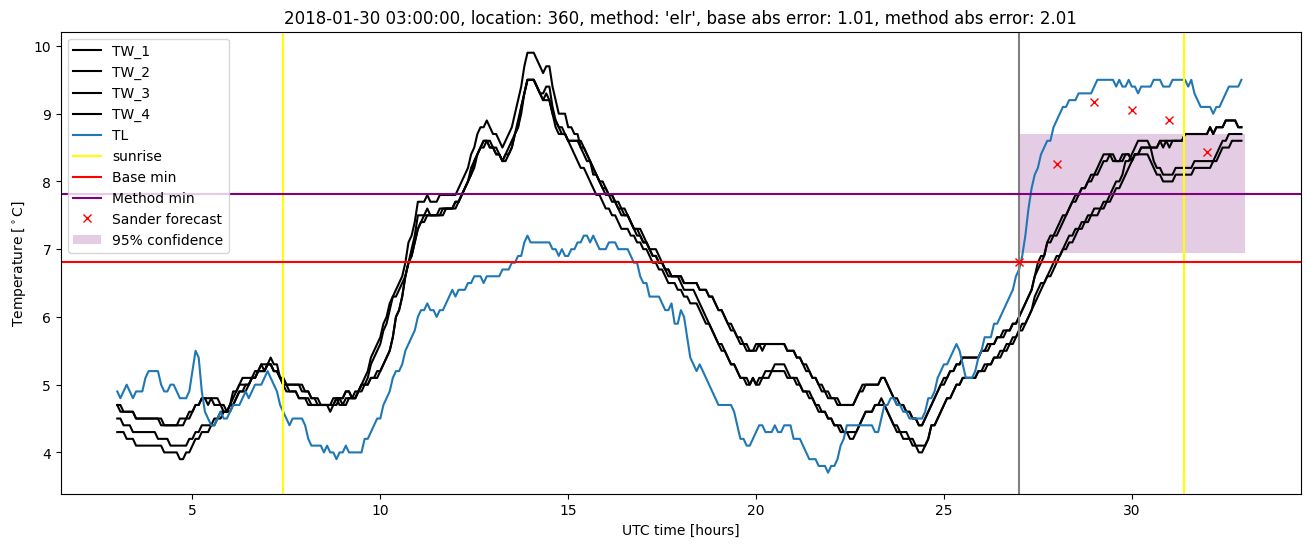
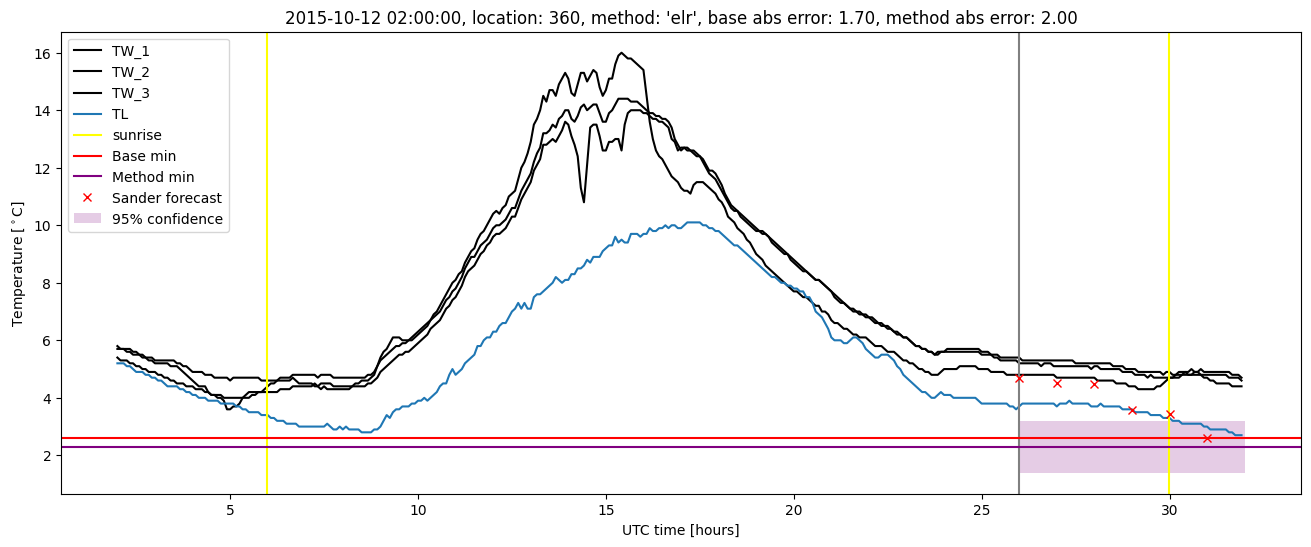
Extended logistic regression plots