GMS location: 359
Random forest results
| names |
period |
power |
significance |
meanSquareError |
absError |
maxError |
CRPS |
IGN |
| baseline |
winter 2016 |
0.995 |
0.000e+00 |
0.381 |
0.467 |
1.974 |
NaN |
NaN |
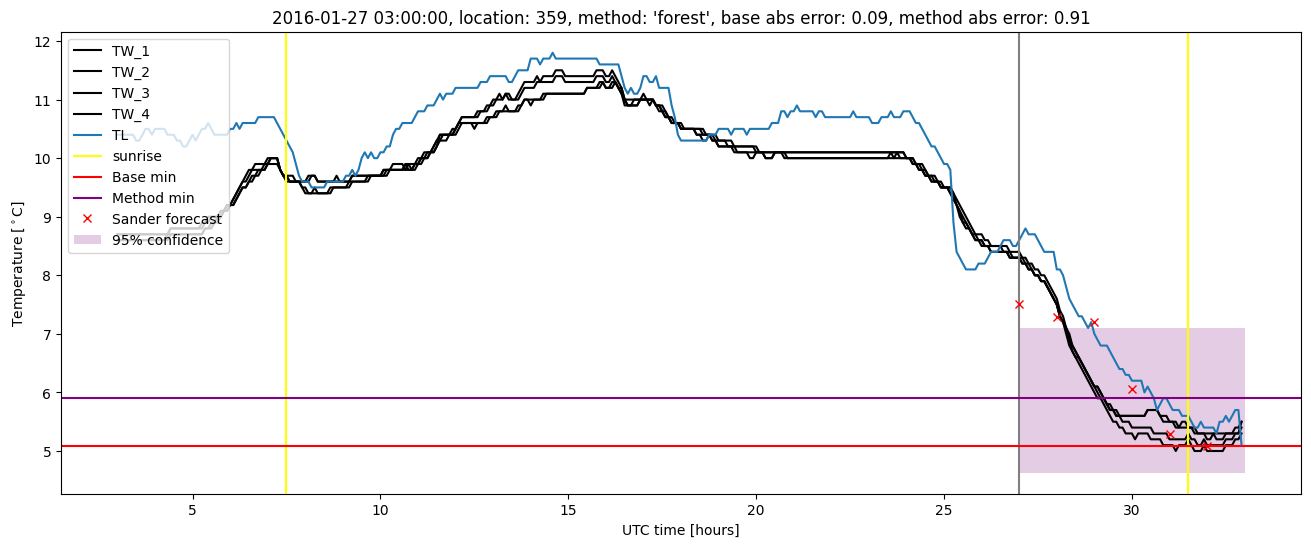
| forest |
winter 2016 |
0.995 |
0.133 |
0.247 |
0.382 |
1.412 |
0.388 |
1.491 |
| baseline |
winter 2017 |
0.939 |
0.118 |
0.588 |
0.563 |
2.720 |
NaN |
NaN |
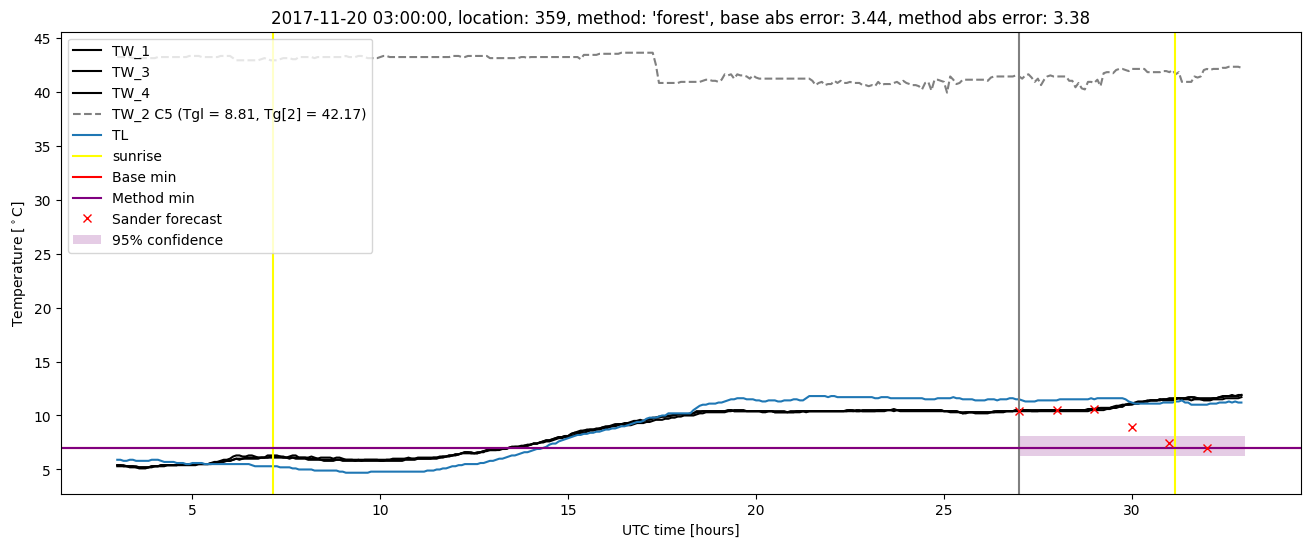
| forest |
winter 2017 |
0.969 |
0.118 |
0.337 |
0.440 |
1.634 |
0.416 |
2.053 |
| baseline |
winter 2018 |
0.992 |
0.000e+00 |
0.449 |
0.494 |
3.437 |
NaN |
NaN |
| forest |
winter 2018 |
1.000 |
0.667 |
0.453 |
0.471 |
3.380 |
0.409 |
2.218 |
| baseline |
winter 2019 |
0.989 |
0.000e+00 |
0.481 |
0.511 |
2.099 |
NaN |
NaN |
| forest |
winter 2019 |
1.000 |
0.000e+00 |
0.303 |
0.416 |
1.704 |
0.380 |
1.442 |
| baseline |
all |
0.982 |
0.056 |
0.458 |
0.501 |
3.437 |
NaN |
NaN |
| forest |
all |
0.992 |
0.167 |
0.325 |
0.421 |
3.380 |
0.397 |
1.774 |
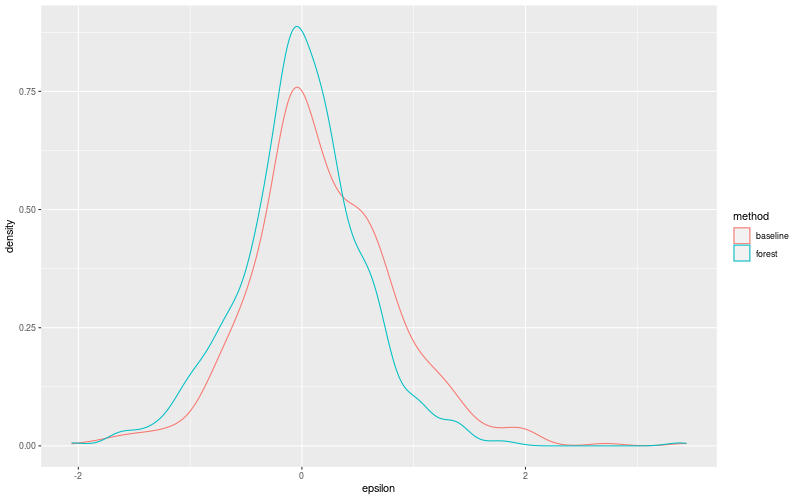
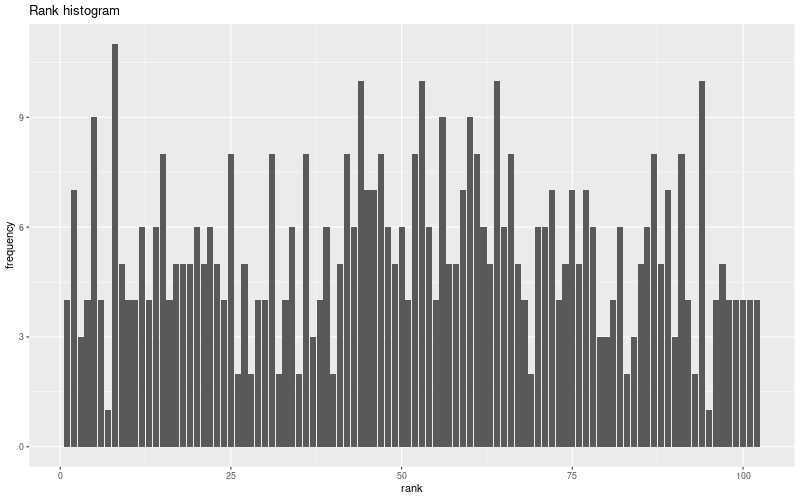
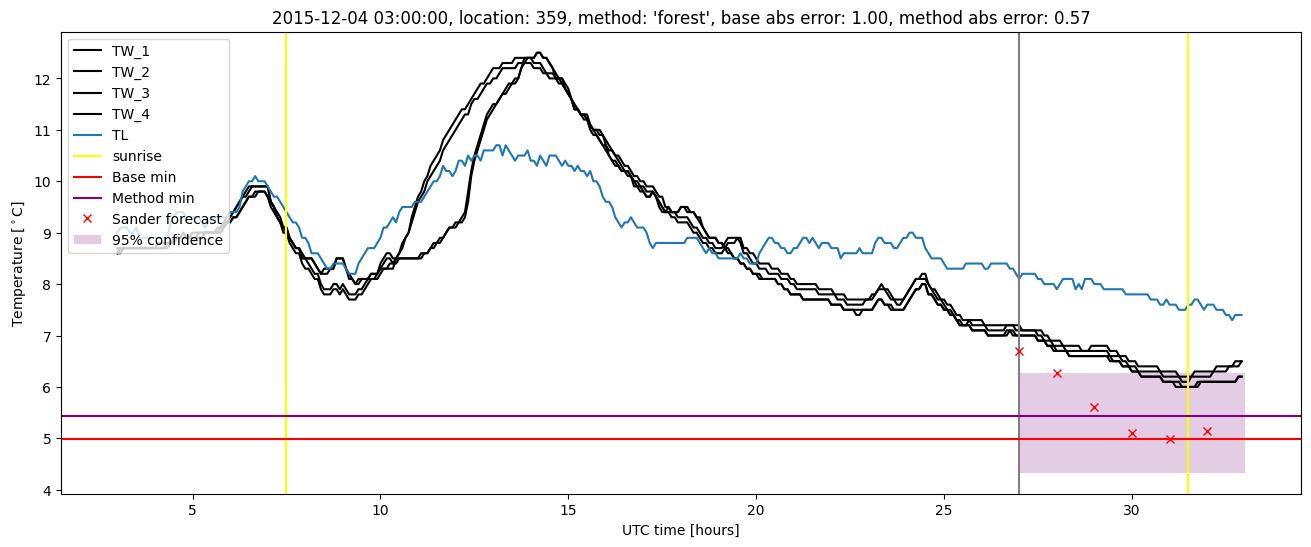
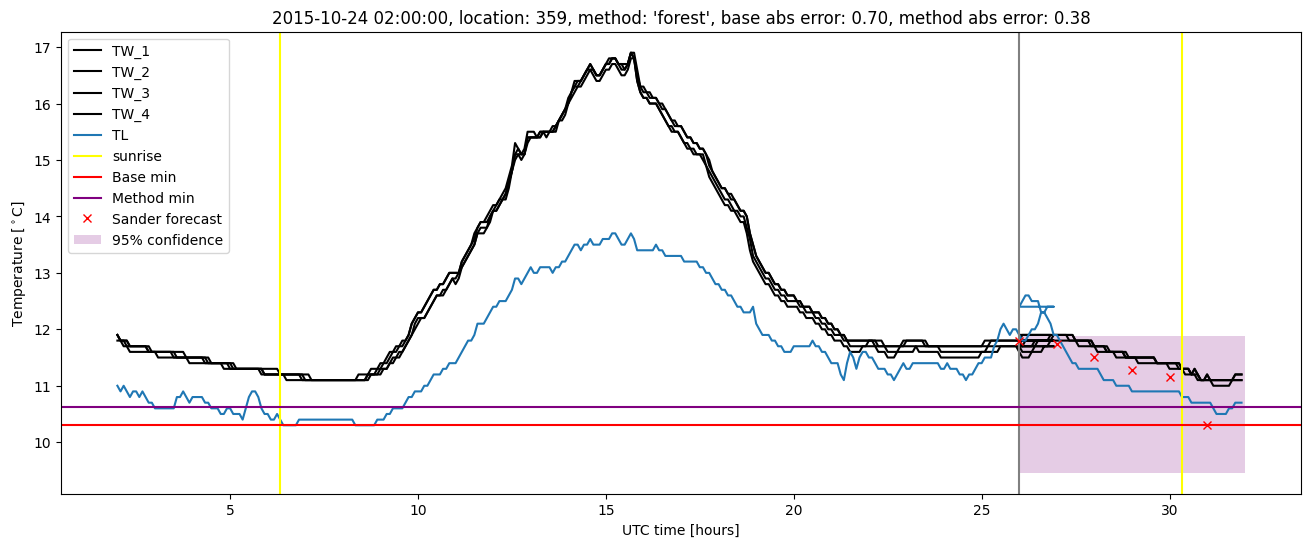
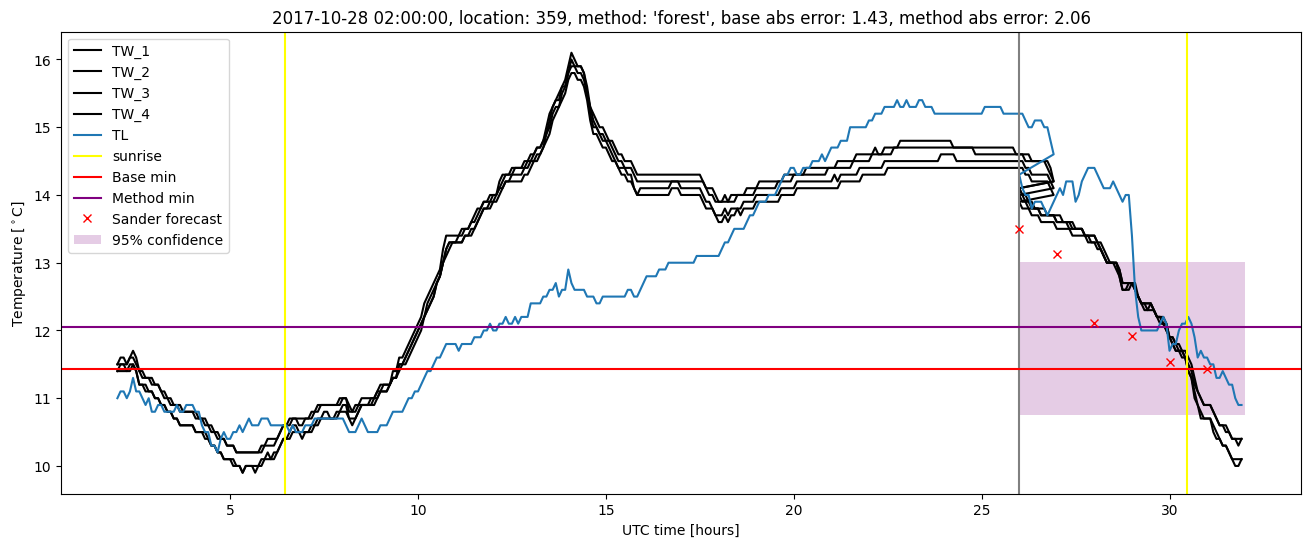
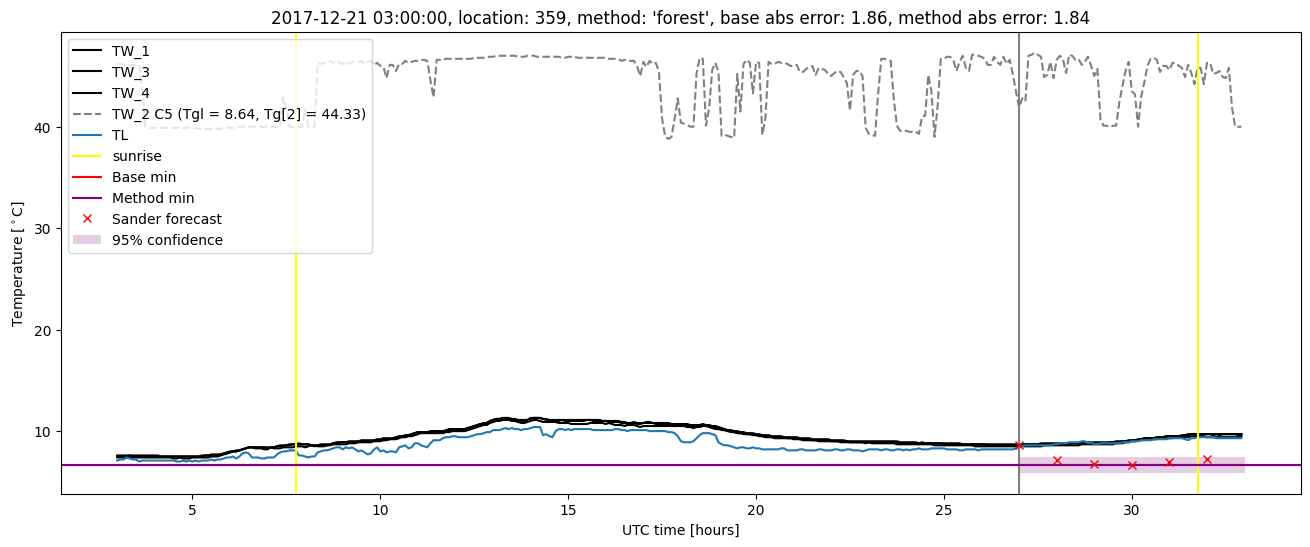
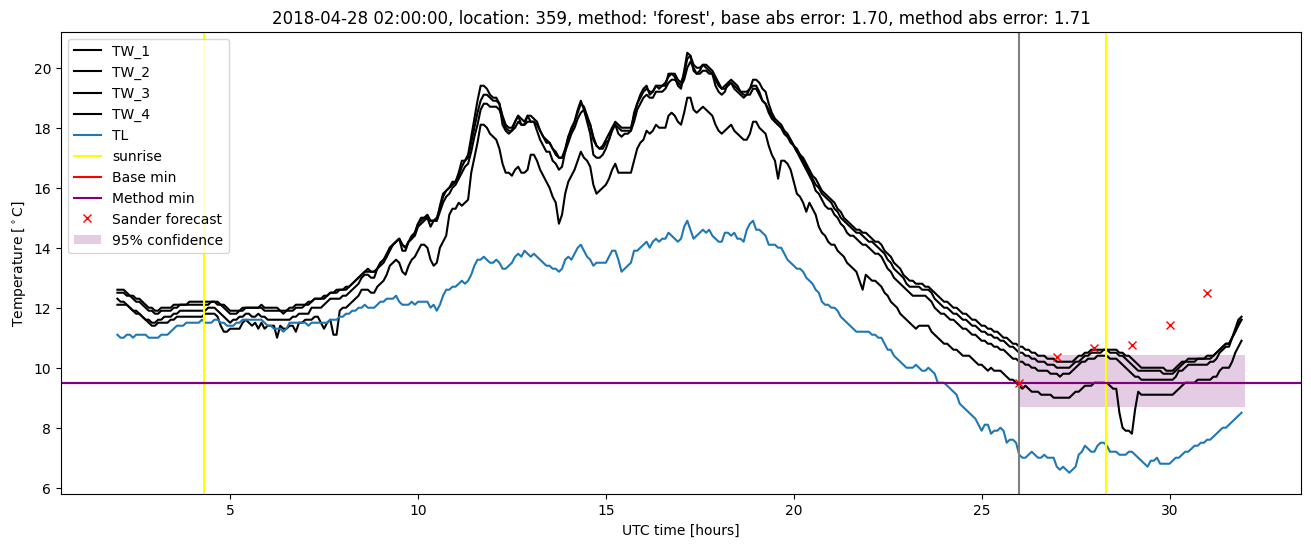
Random forest plots

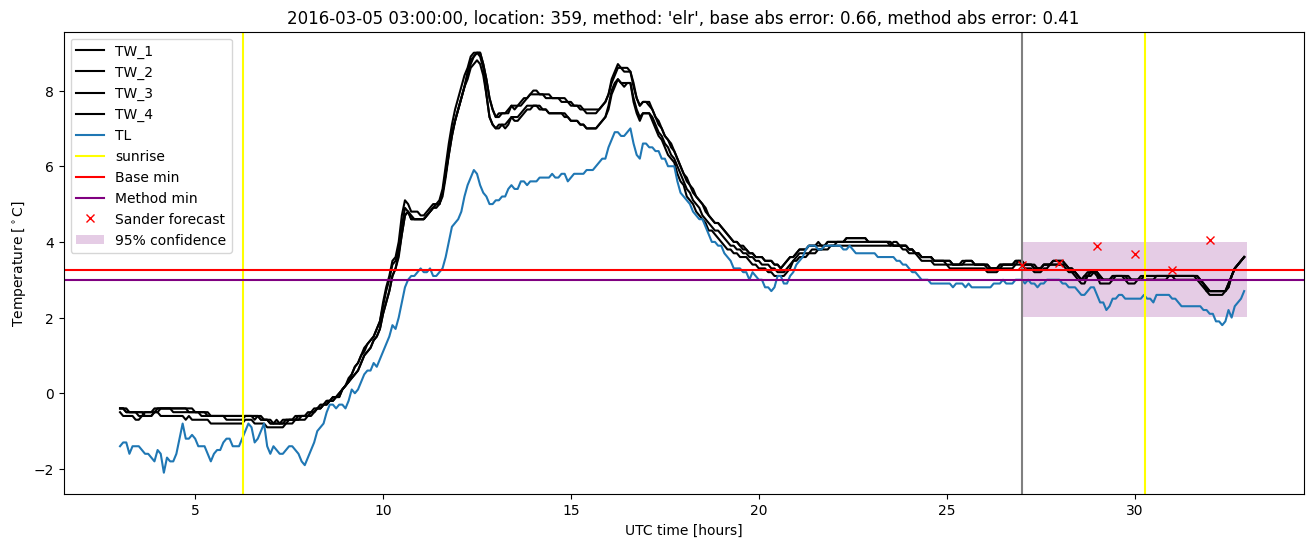
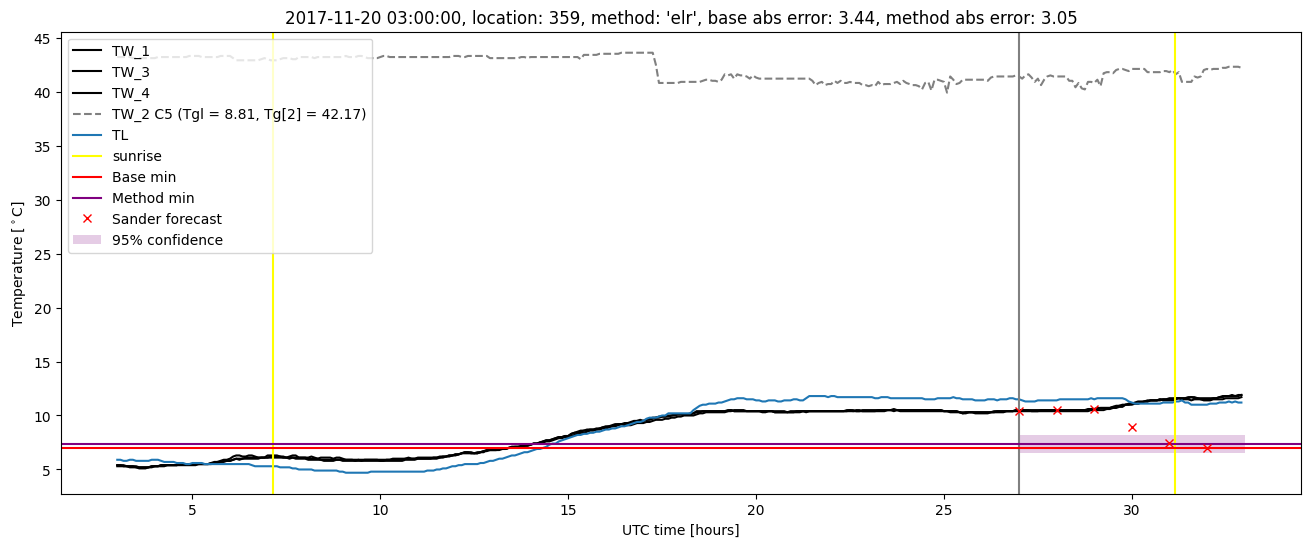
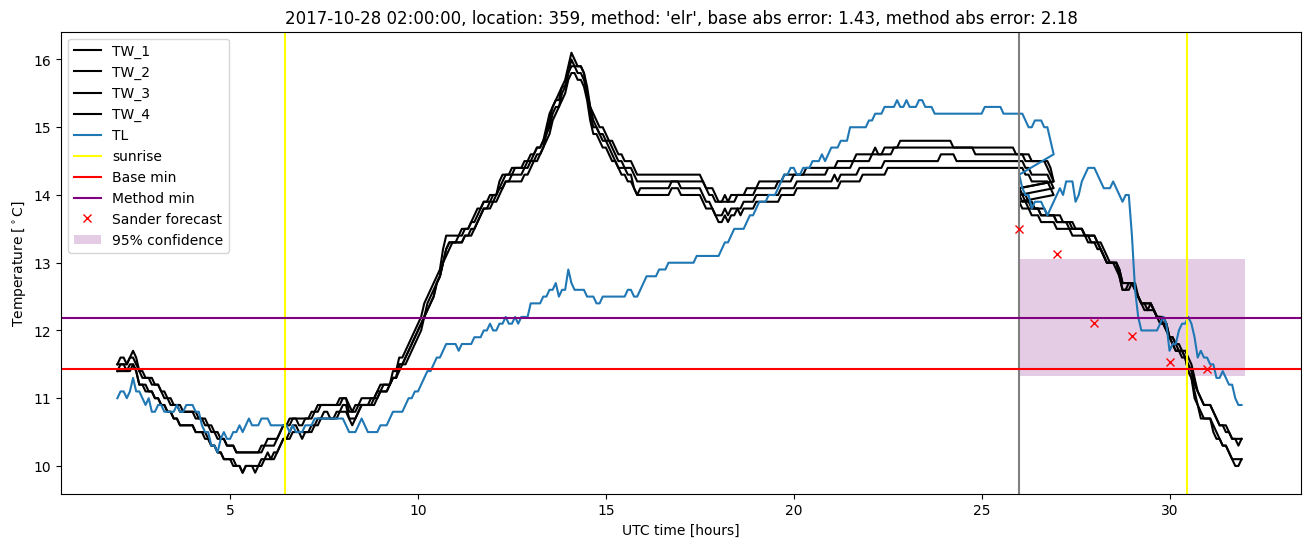
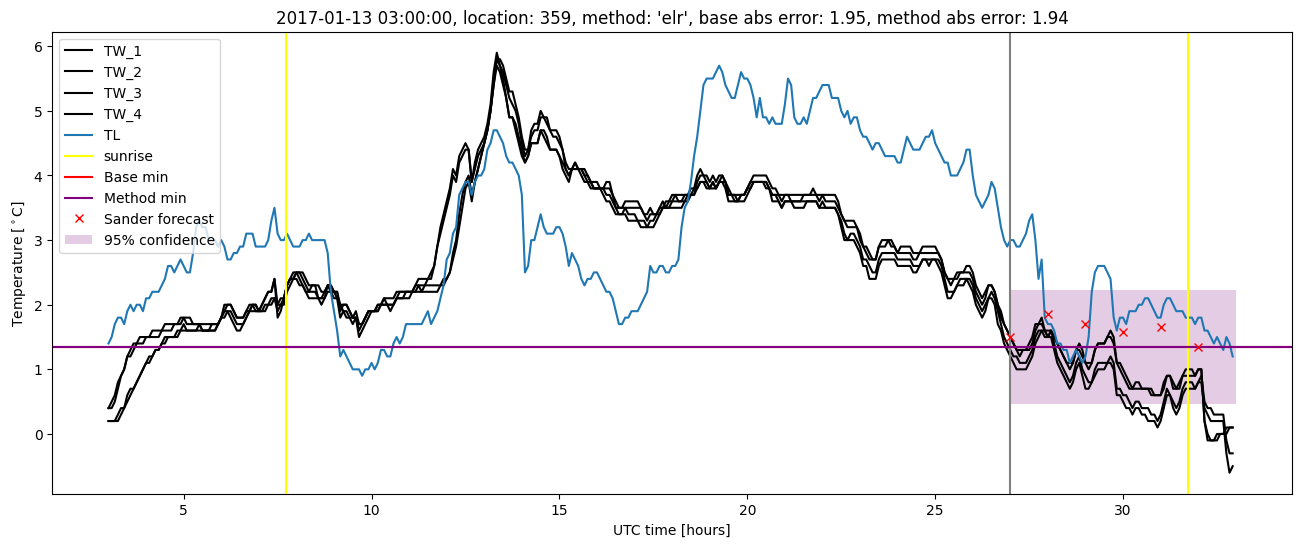
Extended logistic regression results
| names |
period |
power |
significance |
meanSquareError |
absError |
maxError |
CRPS |
IGN |
| baseline |
winter 2016 |
0.995 |
0.000e+00 |
0.381 |
0.467 |
1.974 |
NaN |
NaN |
| elr |
winter 2016 |
0.995 |
0.133 |
0.254 |
0.388 |
1.435 |
0.440 |
2.018 |
| baseline |
winter 2017 |
0.939 |
0.118 |
0.588 |
0.563 |
2.720 |
NaN |
NaN |
| elr |
winter 2017 |
0.959 |
0.118 |
0.374 |
0.455 |
1.941 |
0.468 |
3.227 |
| baseline |
winter 2018 |
0.992 |
0.000e+00 |
0.449 |
0.494 |
3.437 |
NaN |
NaN |
| elr |
winter 2018 |
1.000 |
0.333 |
0.461 |
0.489 |
3.052 |
0.497 |
3.949 |
| baseline |
winter 2019 |
0.989 |
0.000e+00 |
0.481 |
0.511 |
2.099 |
NaN |
NaN |
| elr |
winter 2019 |
1.000 |
0.000e+00 |
0.328 |
0.460 |
1.755 |
0.443 |
2.581 |
| baseline |
all |
0.982 |
0.056 |
0.458 |
0.501 |
3.437 |
NaN |
NaN |
| elr |
all |
0.990 |
0.139 |
0.342 |
0.439 |
3.052 |
0.460 |
2.830 |
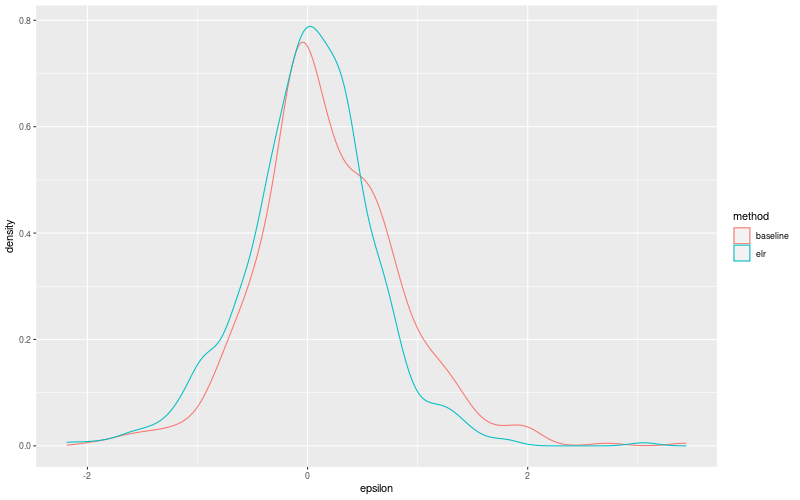
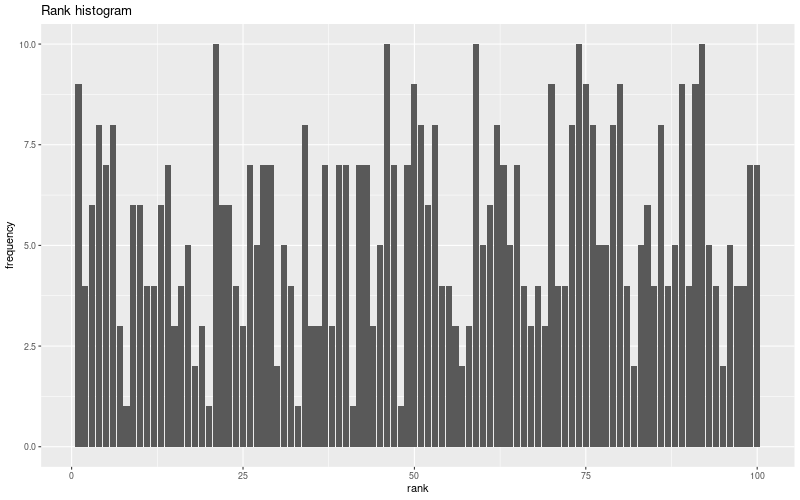
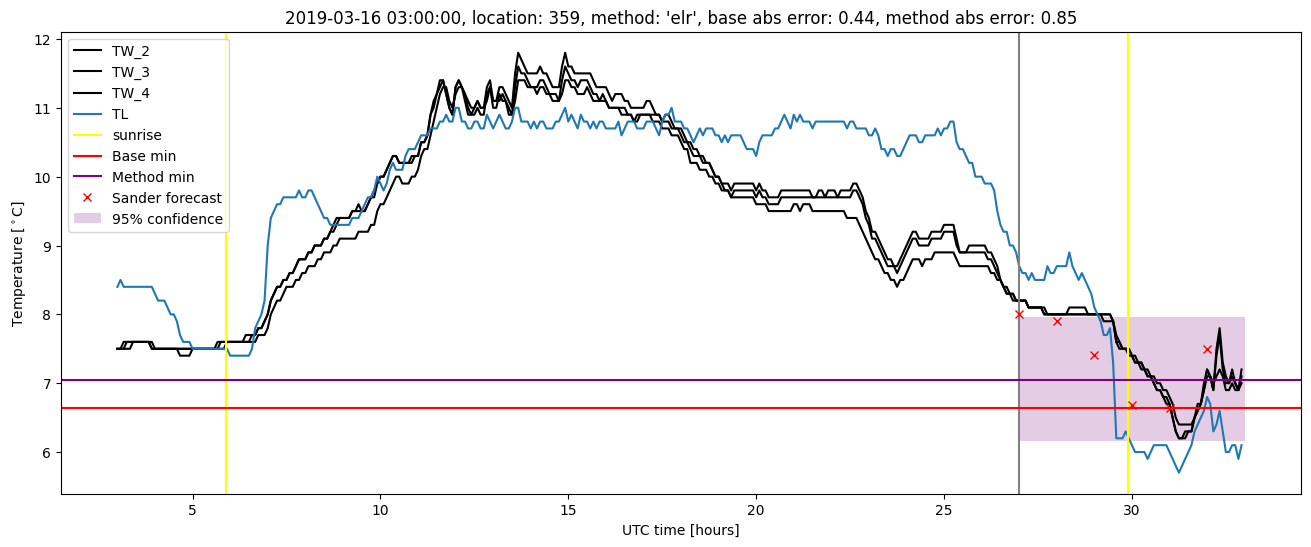
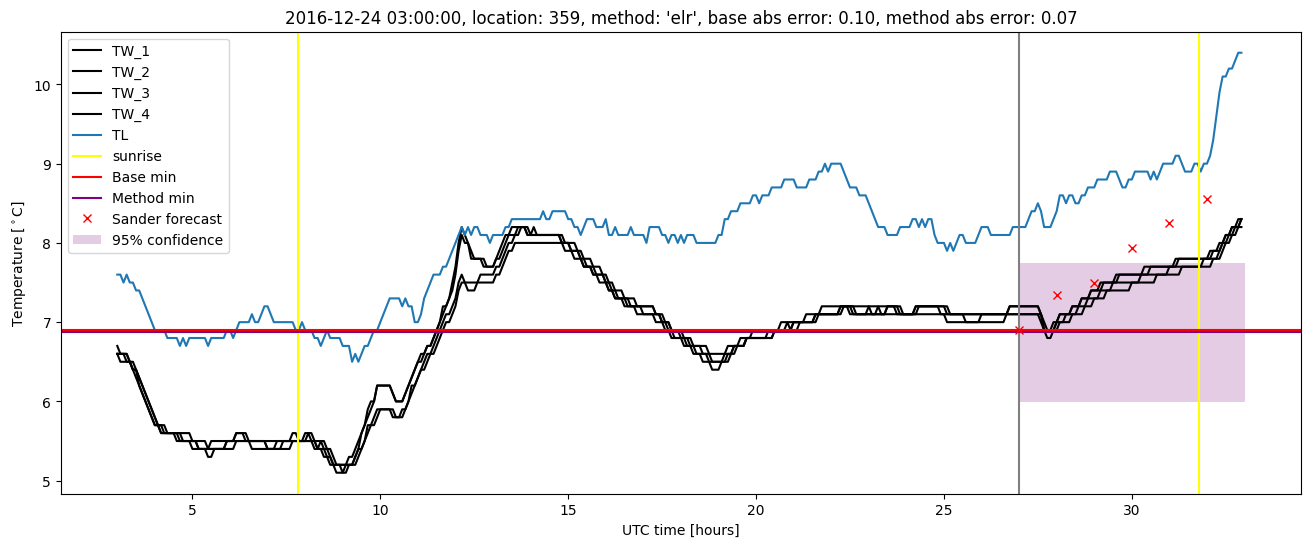
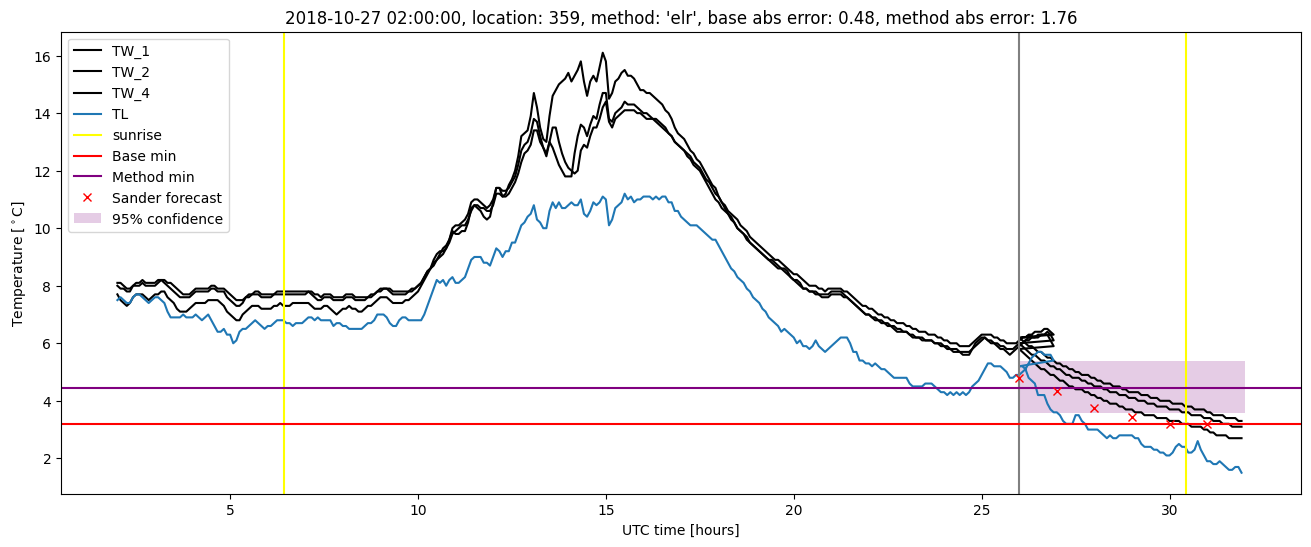
Extended logistic regression plots