GMS location: 358
Random forest results
| names |
period |
power |
significance |
meanSquareError |
absError |
maxError |
CRPS |
IGN |
| baseline |
winter 2016 |
0.973 |
0.000e+00 |
0.432 |
0.517 |
1.630 |
NaN |
NaN |
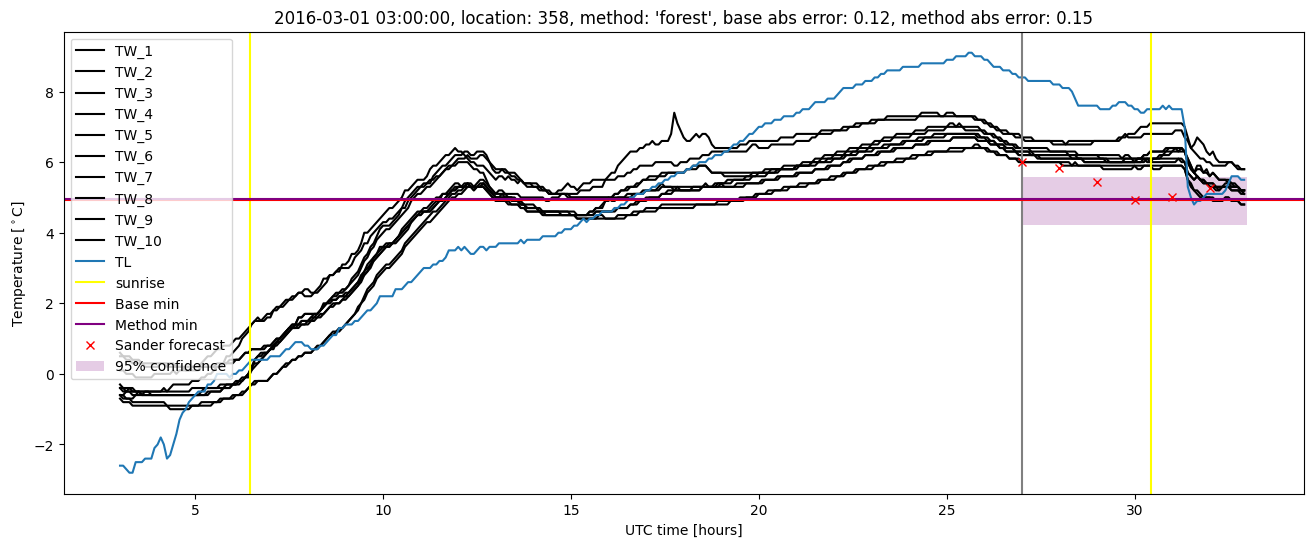
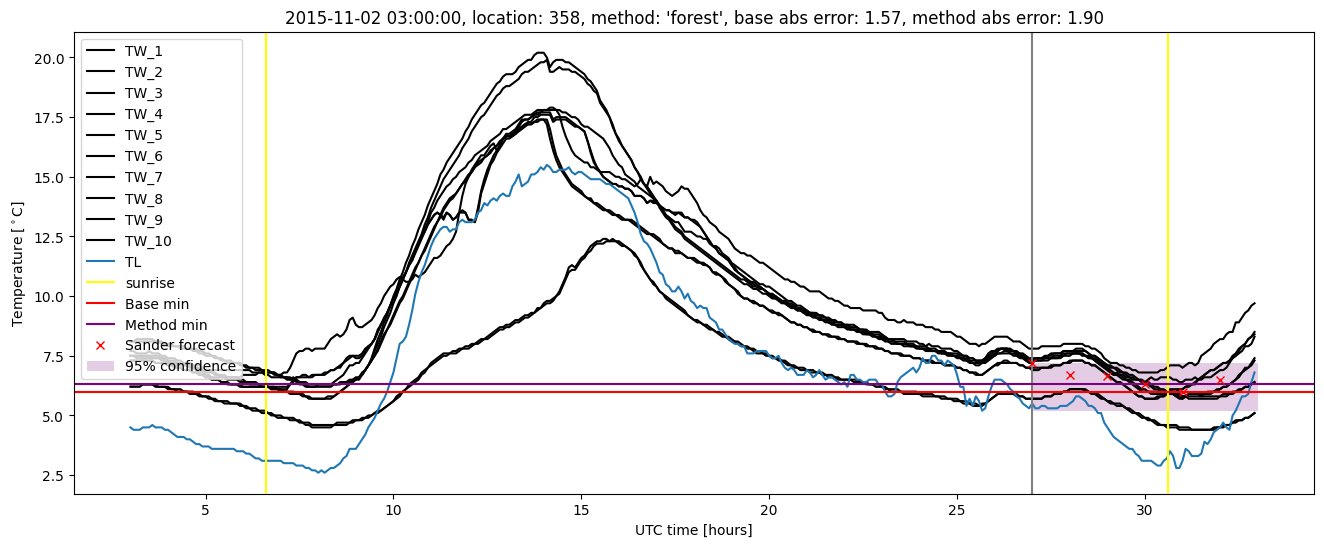
| forest |
winter 2016 |
0.995 |
0.067 |
0.307 |
0.419 |
1.903 |
0.414 |
2.882 |
| baseline |
winter 2017 |
0.951 |
0.000e+00 |
0.365 |
0.473 |
1.853 |
NaN |
NaN |
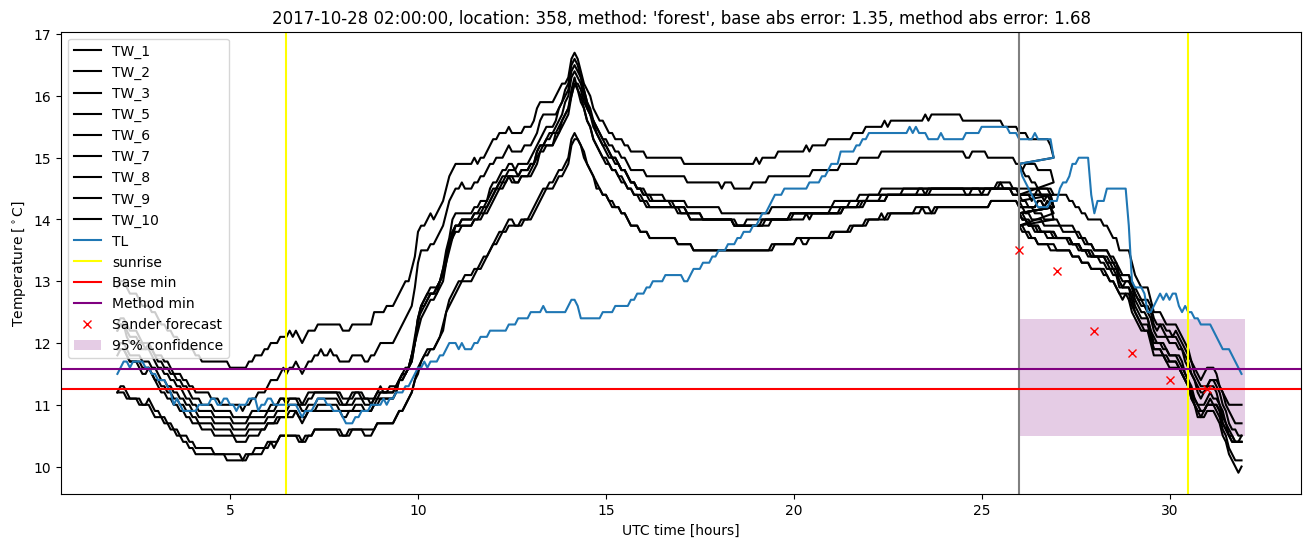
| forest |
winter 2017 |
0.959 |
0.000e+00 |
0.248 |
0.383 |
1.431 |
0.442 |
3.197 |
| baseline |
winter 2018 |
0.980 |
0.107 |
0.366 |
0.464 |
1.897 |
NaN |
NaN |
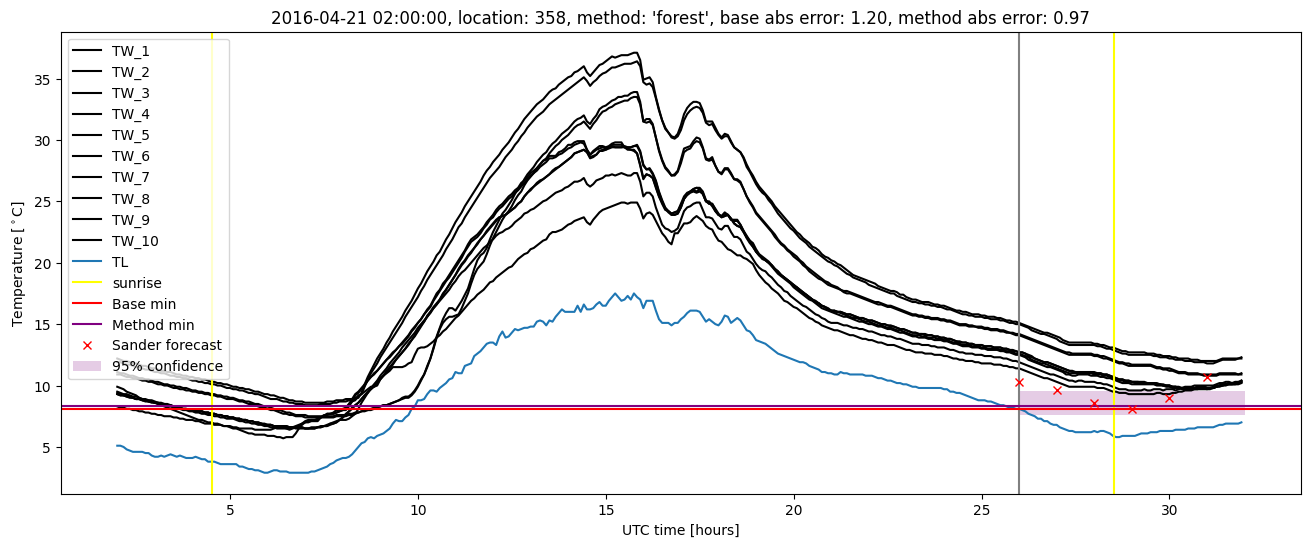
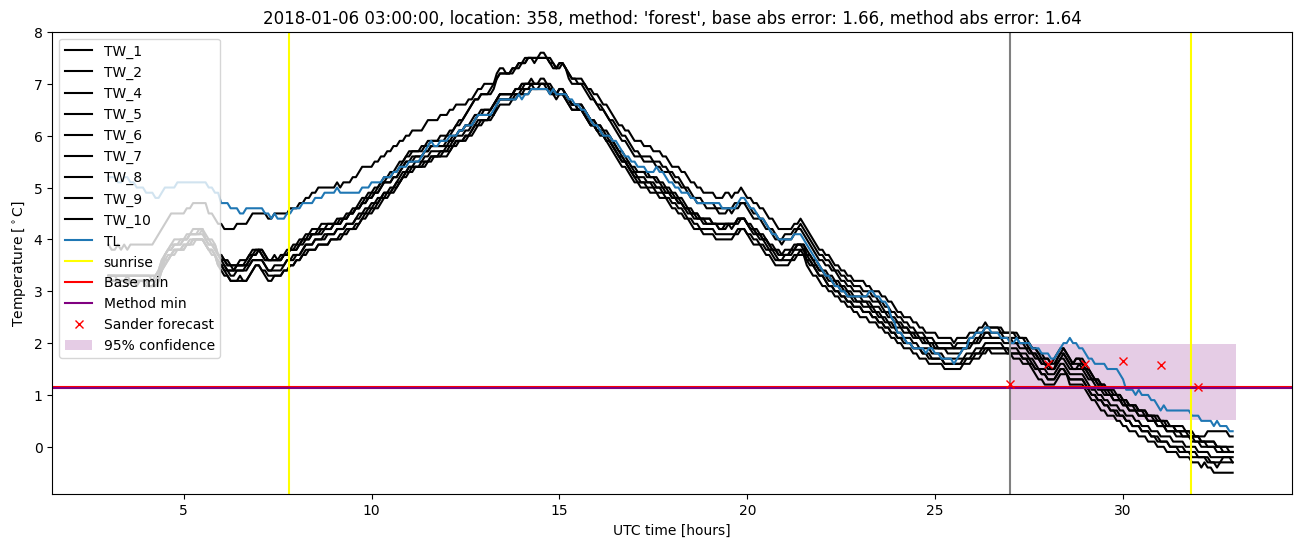
| forest |
winter 2018 |
0.987 |
0.107 |
0.292 |
0.415 |
1.678 |
0.430 |
2.626 |
| baseline |
winter 2019 |
0.993 |
0.000e+00 |
0.336 |
0.433 |
1.953 |
NaN |
NaN |
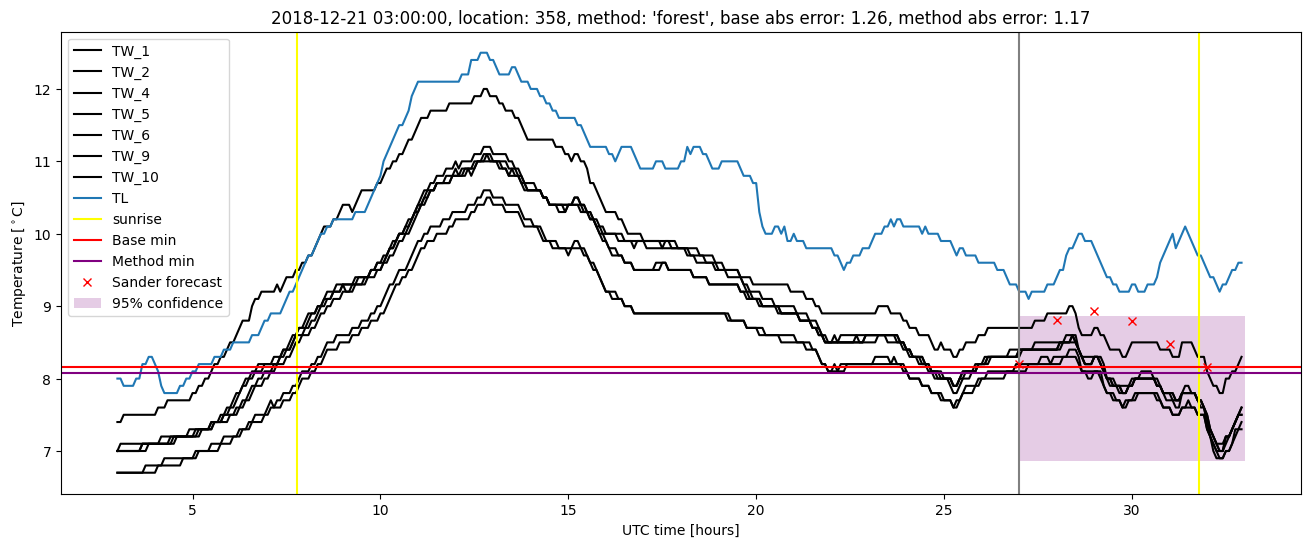
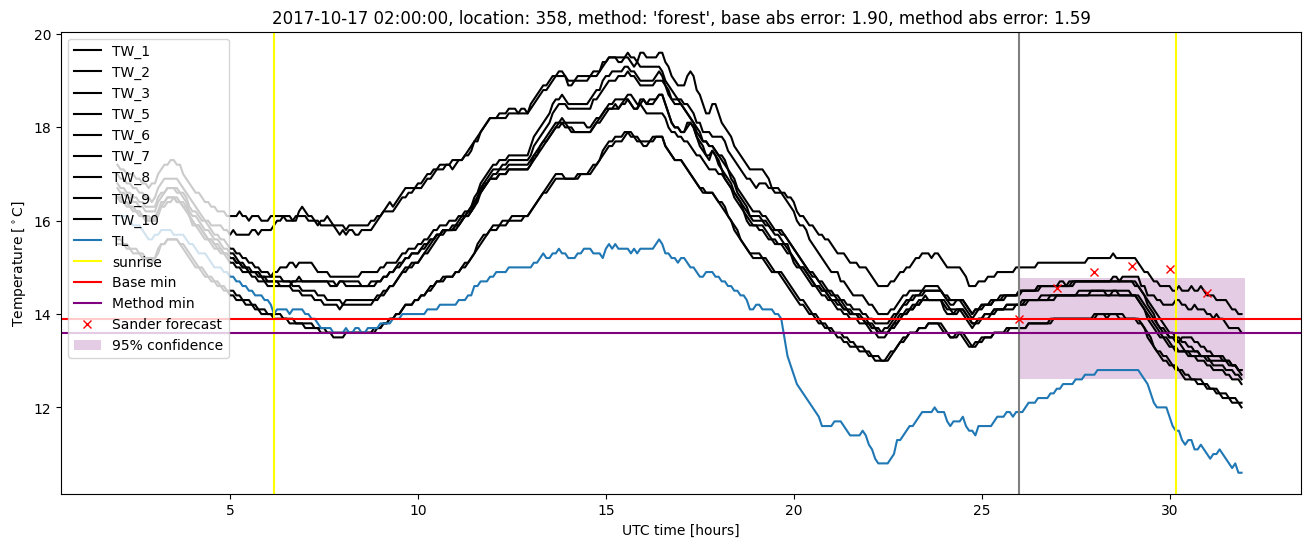
| forest |
winter 2019 |
0.993 |
0.000e+00 |
0.230 |
0.359 |
1.950 |
0.413 |
2.359 |
| baseline |
all |
0.975 |
0.036 |
0.378 |
0.474 |
1.953 |
NaN |
NaN |
| forest |
all |
0.985 |
0.048 |
0.273 |
0.396 |
1.950 |
0.424 |
2.765 |
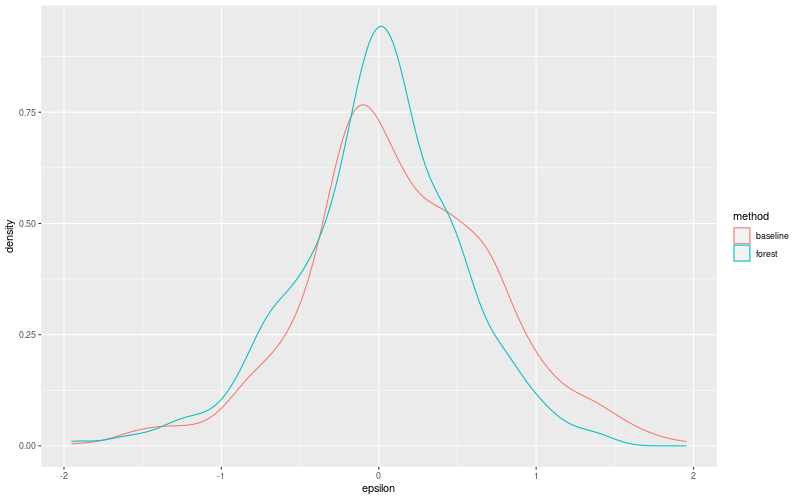
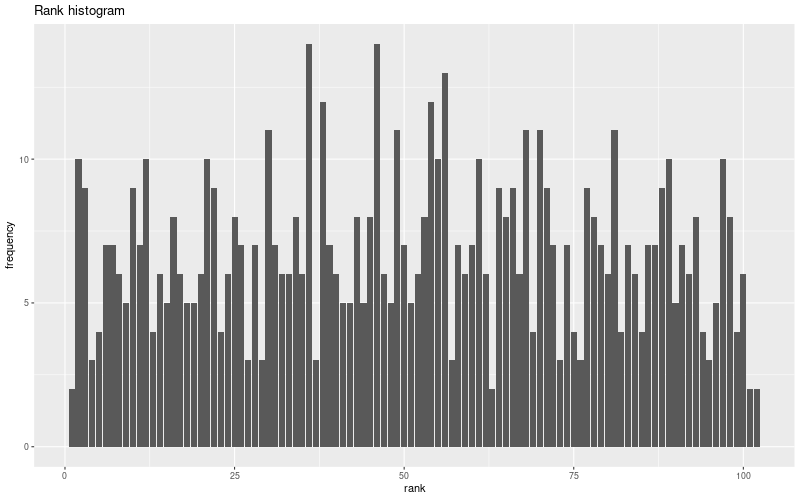
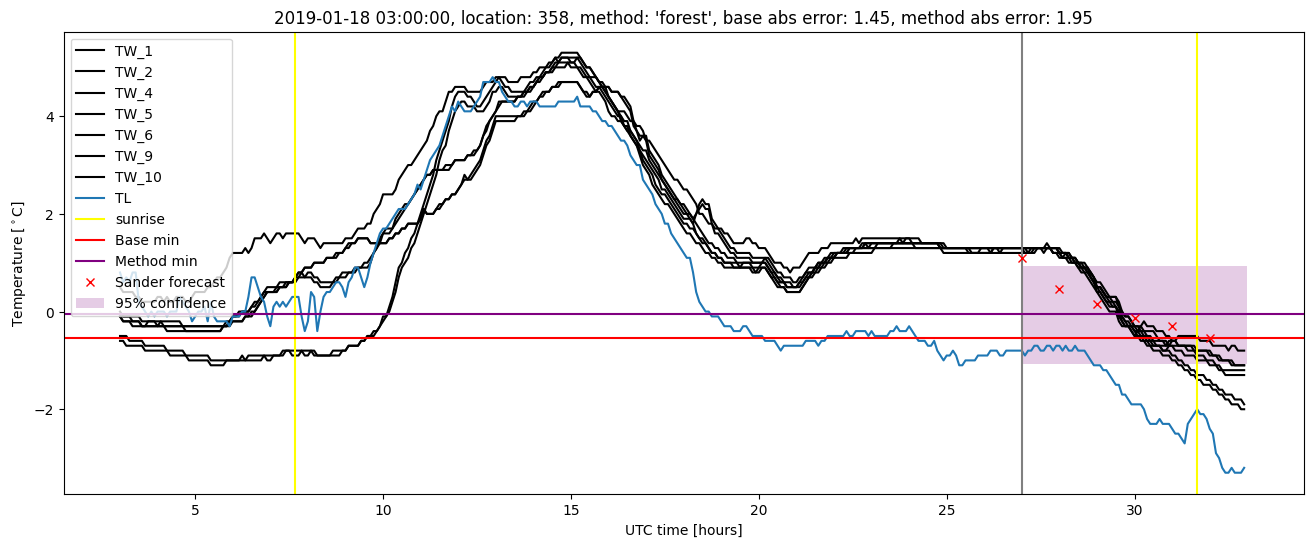
Random forest plots
Extended logistic regression results
| names |
period |
power |
significance |
meanSquareError |
absError |
maxError |
CRPS |
IGN |
| baseline |
winter 2016 |
0.973 |
0.000e+00 |
0.432 |
0.517 |
1.630 |
NaN |
NaN |
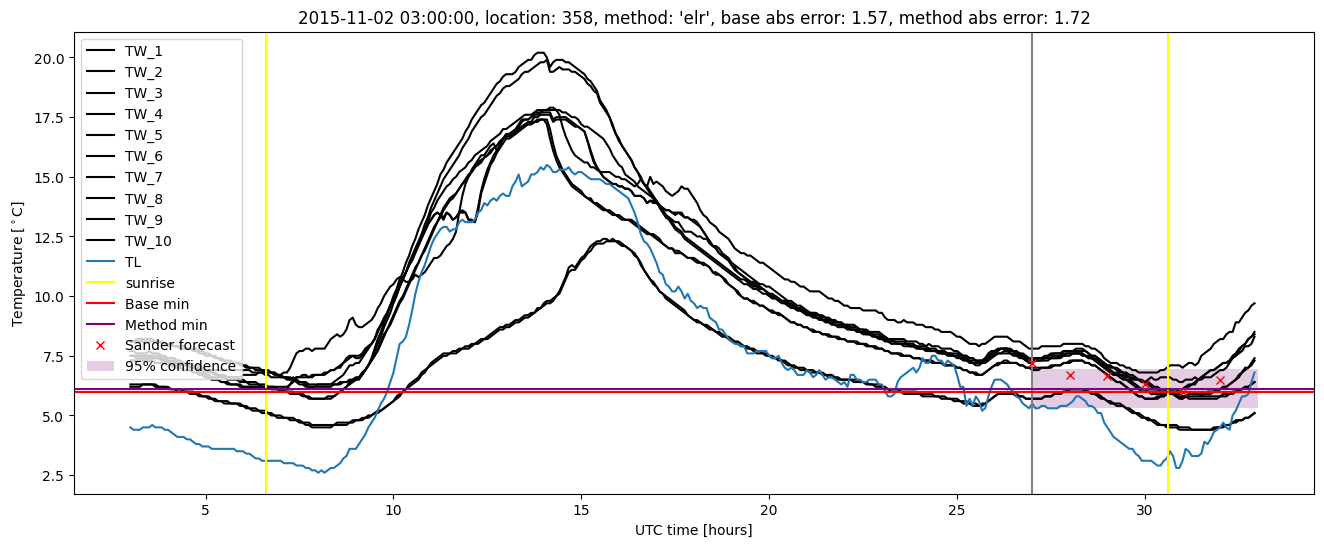
| elr |
winter 2016 |
0.984 |
0.000e+00 |
0.328 |
0.451 |
1.723 |
0.476 |
4.140 |
| baseline |
winter 2017 |
0.951 |
0.000e+00 |
0.365 |
0.473 |
1.853 |
NaN |
NaN |
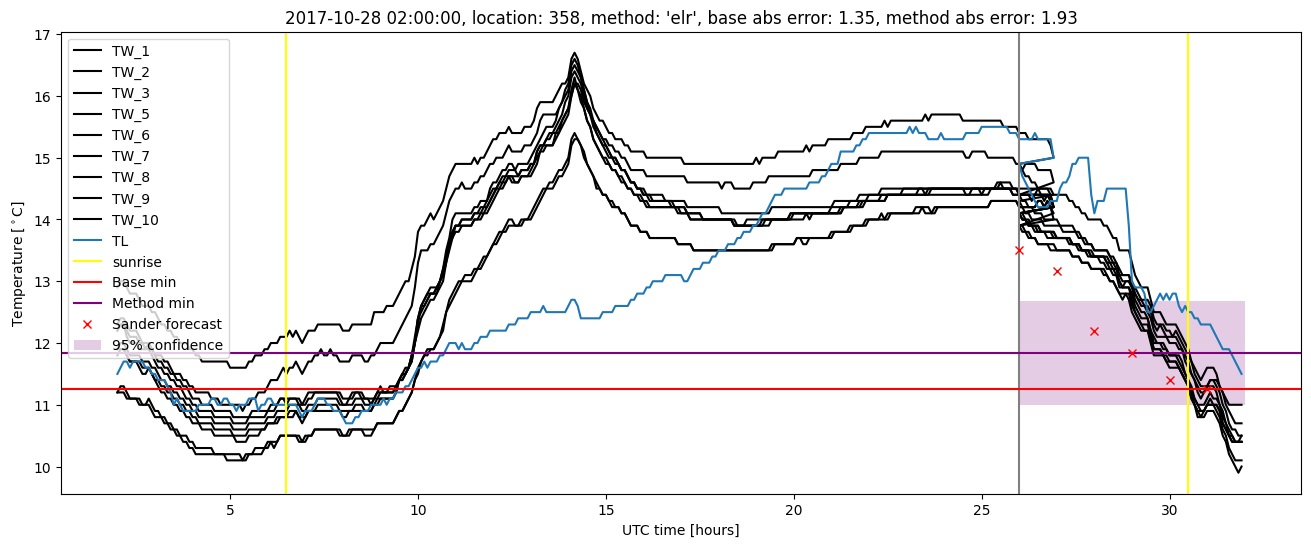
| elr |
winter 2017 |
0.951 |
0.000e+00 |
0.277 |
0.408 |
1.506 |
0.499 |
3.778 |
| baseline |
winter 2018 |
0.980 |
0.107 |
0.366 |
0.464 |
1.897 |
NaN |
NaN |
| elr |
winter 2018 |
0.980 |
0.071 |
0.308 |
0.424 |
1.931 |
0.489 |
4.133 |
| baseline |
winter 2019 |
0.993 |
0.000e+00 |
0.336 |
0.433 |
1.953 |
NaN |
NaN |
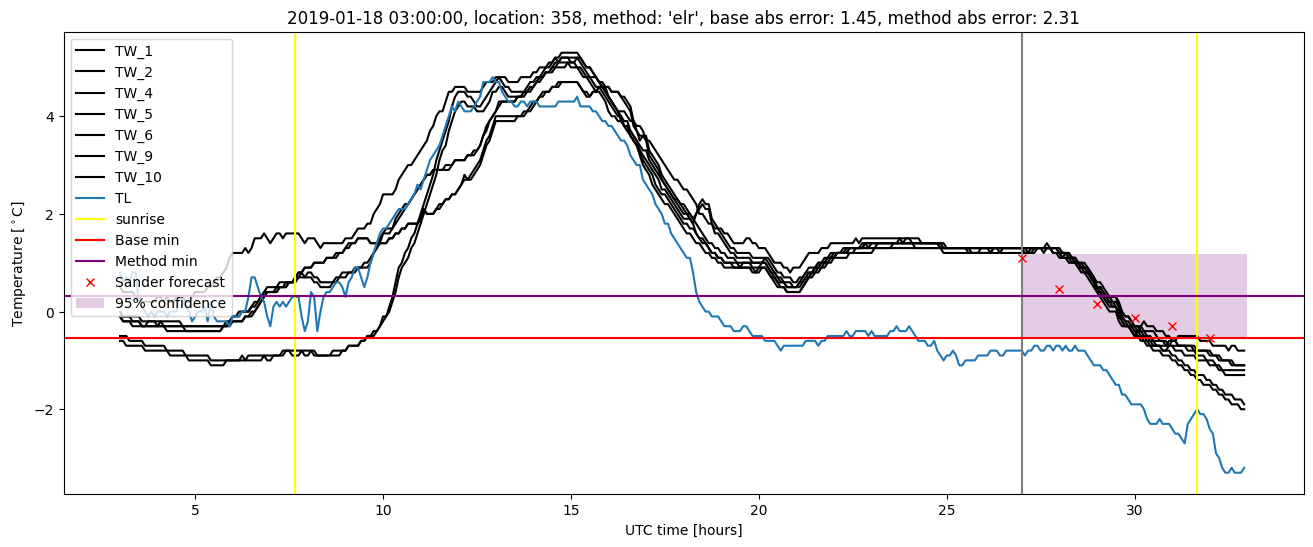
| elr |
winter 2019 |
0.993 |
0.091 |
0.270 |
0.382 |
2.309 |
0.463 |
3.413 |
| baseline |
all |
0.975 |
0.036 |
0.378 |
0.474 |
1.953 |
NaN |
NaN |
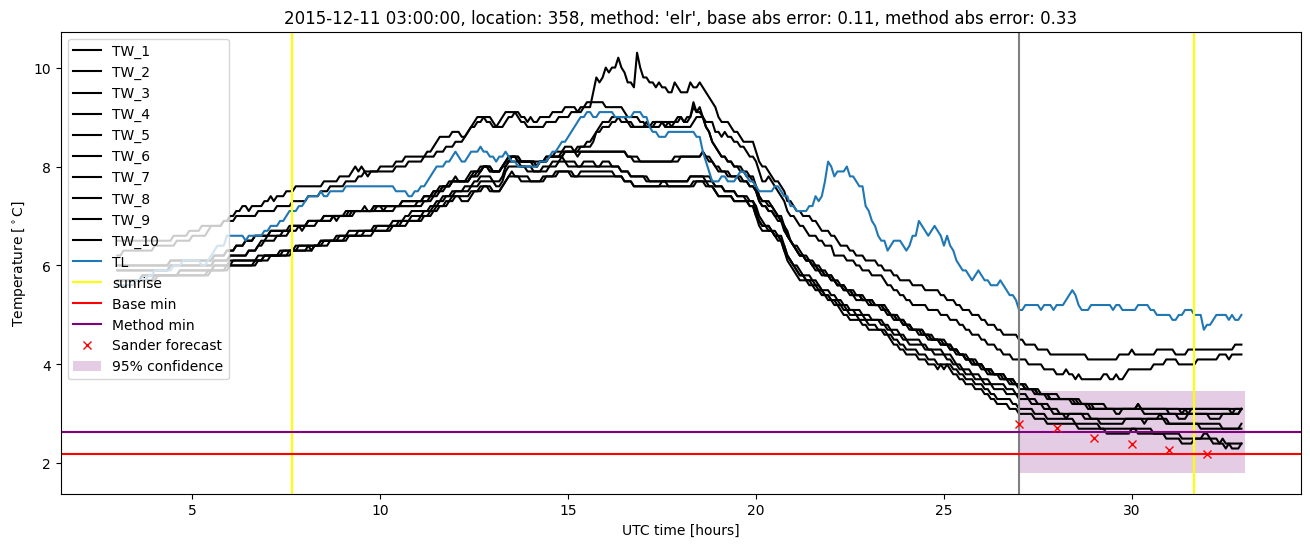
| elr |
all |
0.979 |
0.036 |
0.298 |
0.419 |
2.309 |
0.481 |
3.892 |
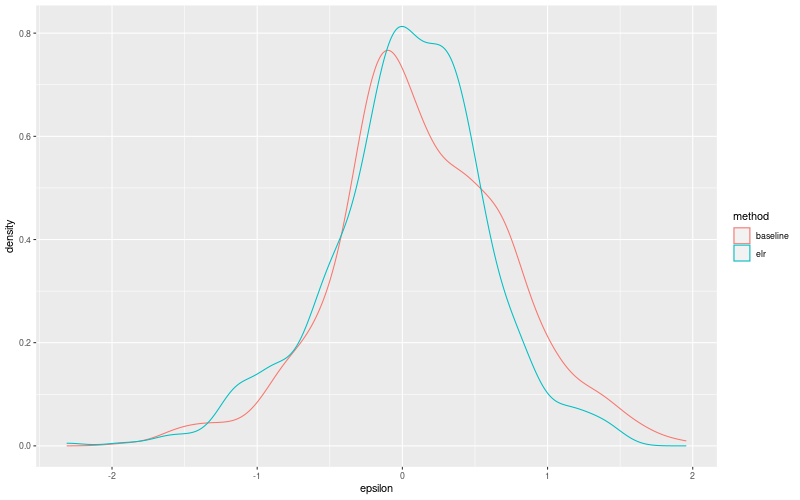
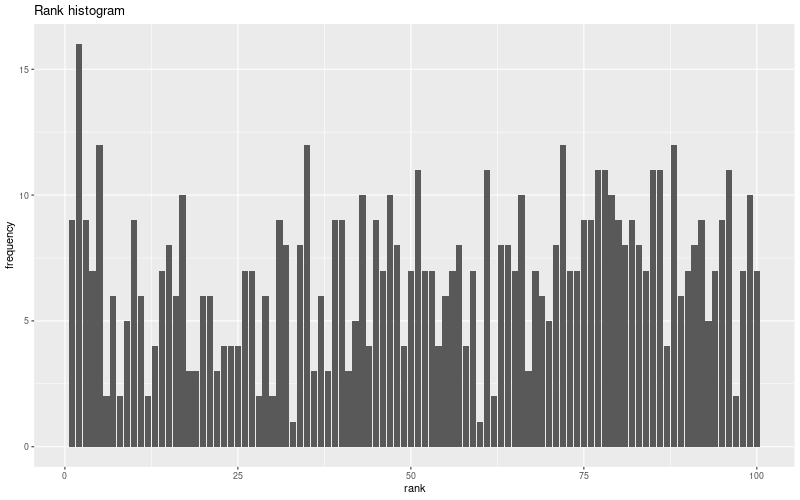
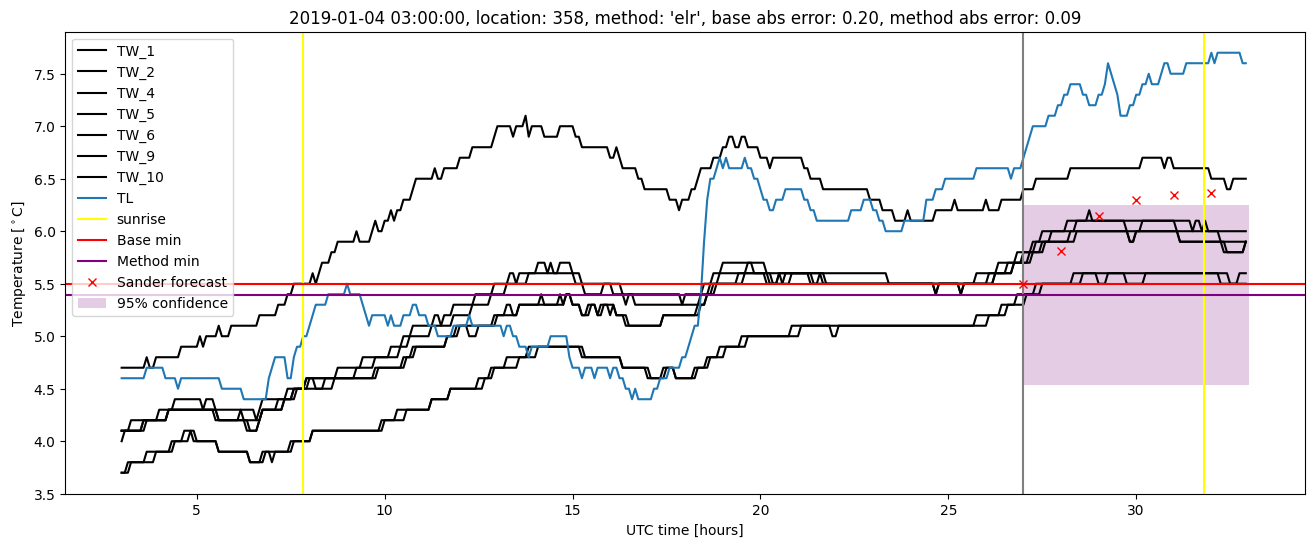
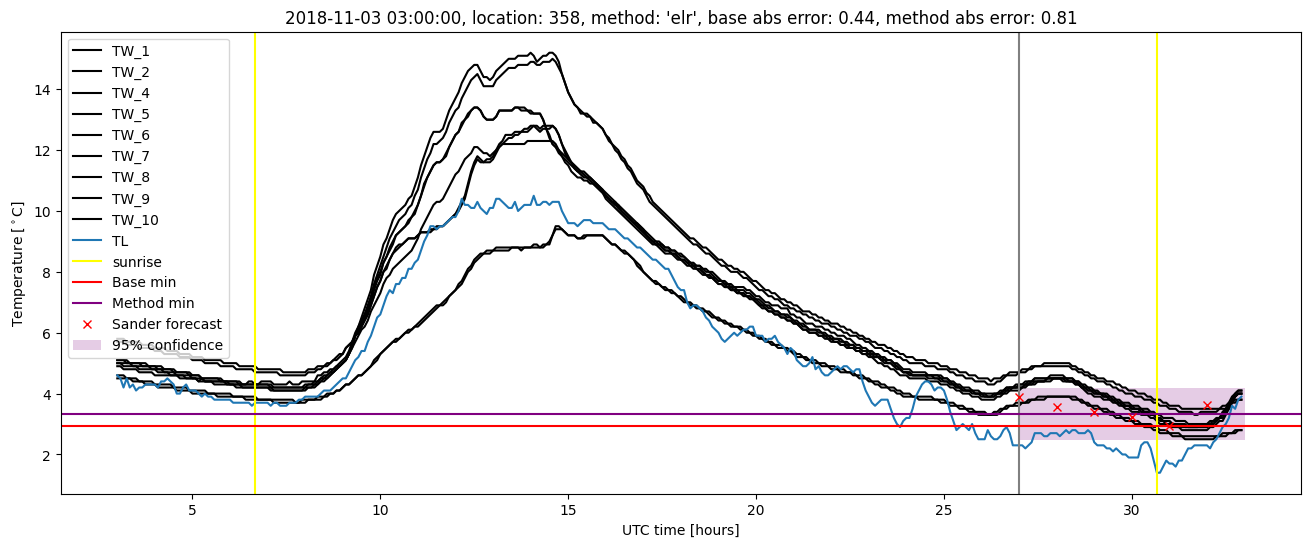
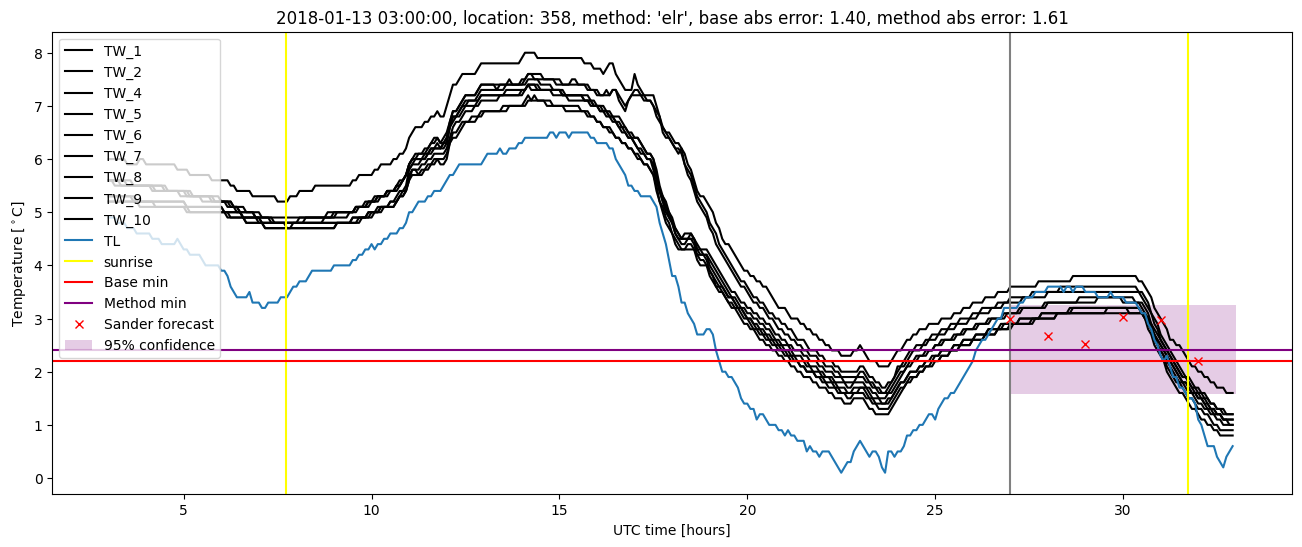
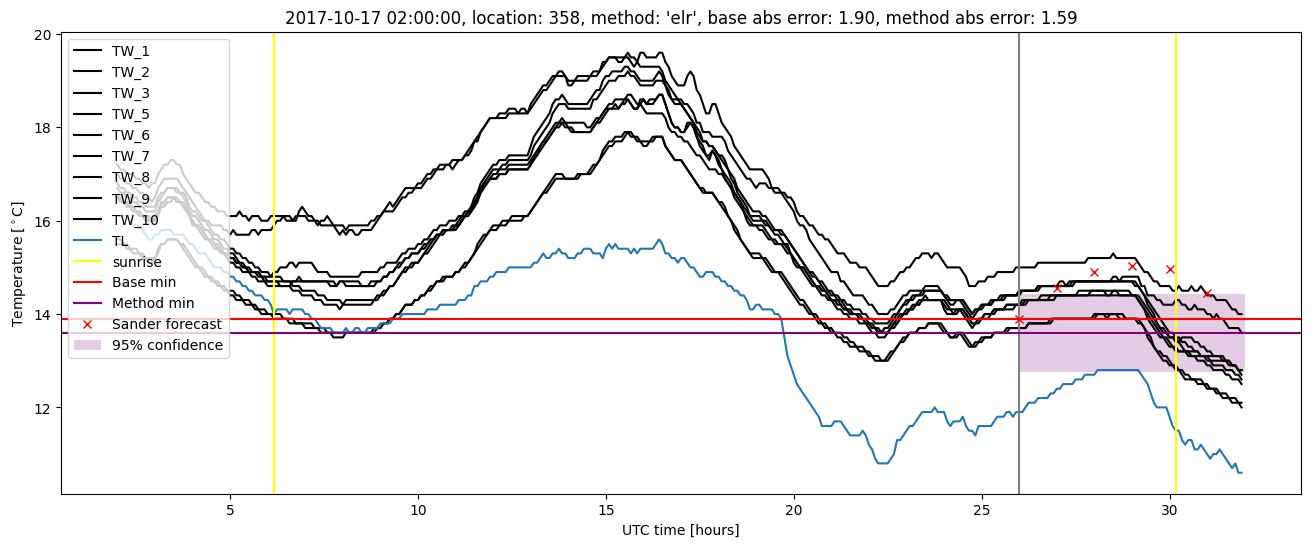
Extended logistic regression plots