GMS location: 357
Random forest results
| names |
period |
power |
significance |
meanSquareError |
absError |
maxError |
CRPS |
IGN |
| baseline |
winter 2016 |
0.990 |
0.000e+00 |
0.319 |
0.429 |
1.538 |
NaN |
NaN |
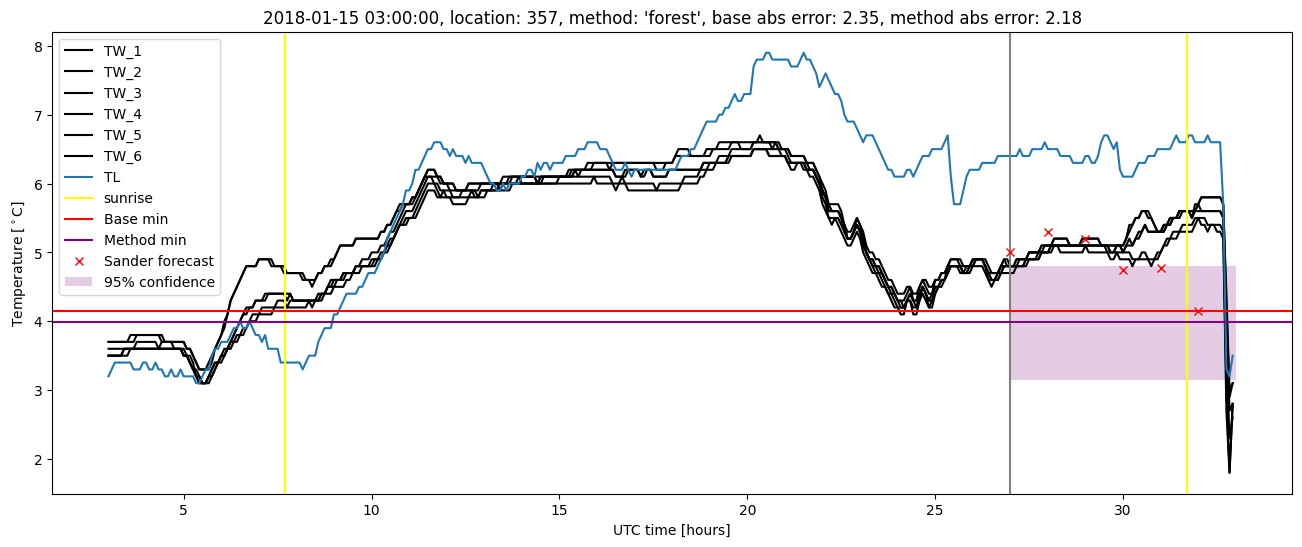
| forest |
winter 2016 |
0.990 |
0.000e+00 |
0.249 |
0.378 |
1.422 |
0.434 |
2.428 |
| baseline |
winter 2017 |
0.977 |
0.045 |
0.353 |
0.452 |
2.118 |
NaN |
NaN |
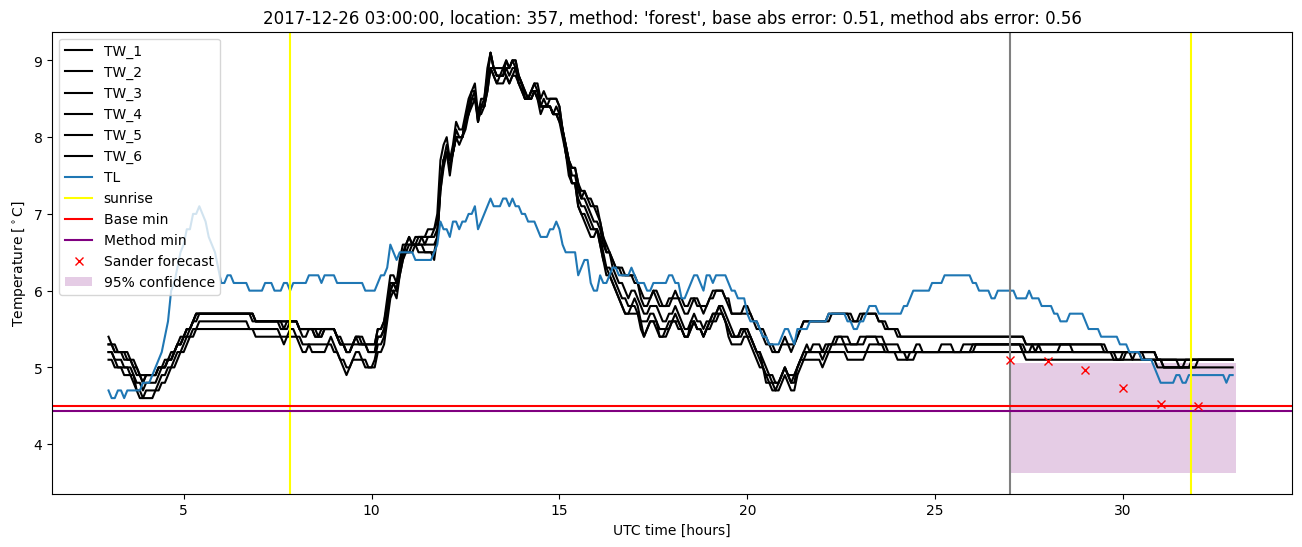
| forest |
winter 2017 |
0.992 |
0.045 |
0.248 |
0.380 |
1.460 |
0.459 |
2.732 |
| baseline |
winter 2018 |
0.993 |
0.000e+00 |
0.393 |
0.467 |
2.350 |
NaN |
NaN |
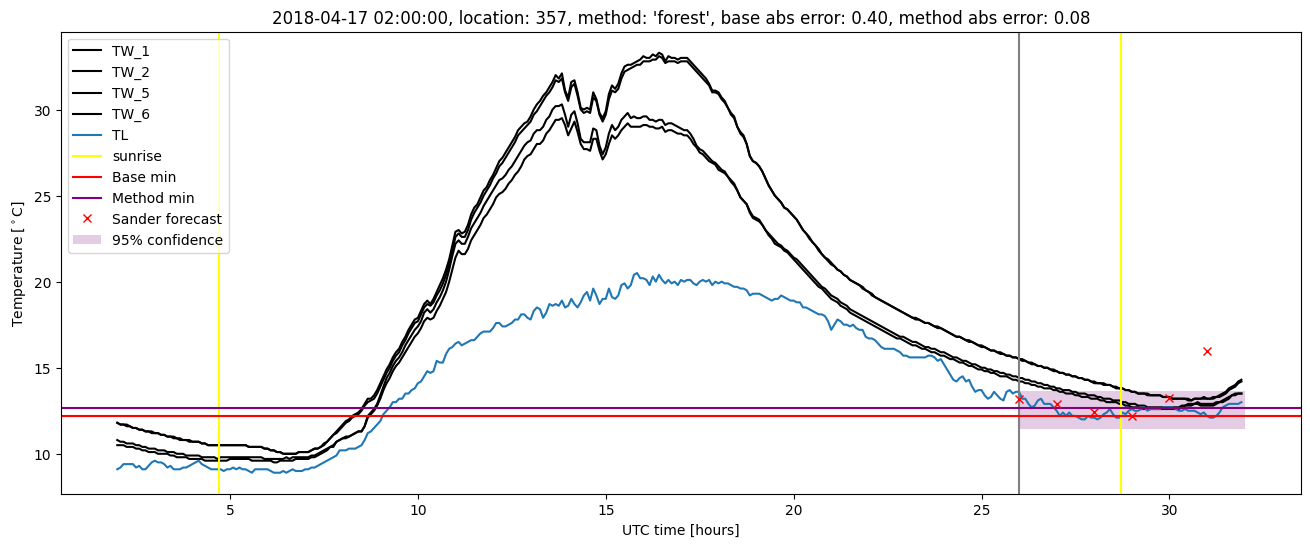
| forest |
winter 2018 |
1.000 |
0.000e+00 |
0.353 |
0.435 |
2.182 |
0.458 |
3.371 |
| baseline |
winter 2019 |
0.973 |
0.000e+00 |
0.259 |
0.376 |
1.831 |
NaN |
NaN |
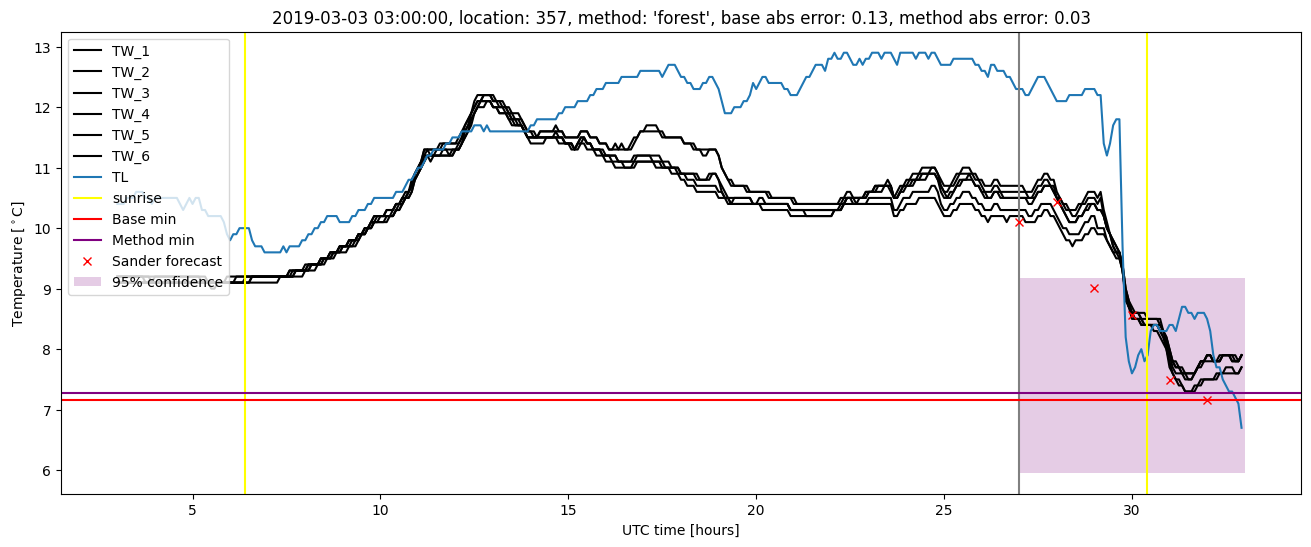
| forest |
winter 2019 |
0.973 |
0.000e+00 |
0.211 |
0.350 |
1.329 |
0.458 |
2.721 |
| baseline |
all |
0.985 |
0.016 |
0.335 |
0.434 |
2.350 |
NaN |
NaN |
| forest |
all |
0.990 |
0.016 |
0.268 |
0.387 |
2.182 |
0.451 |
2.795 |
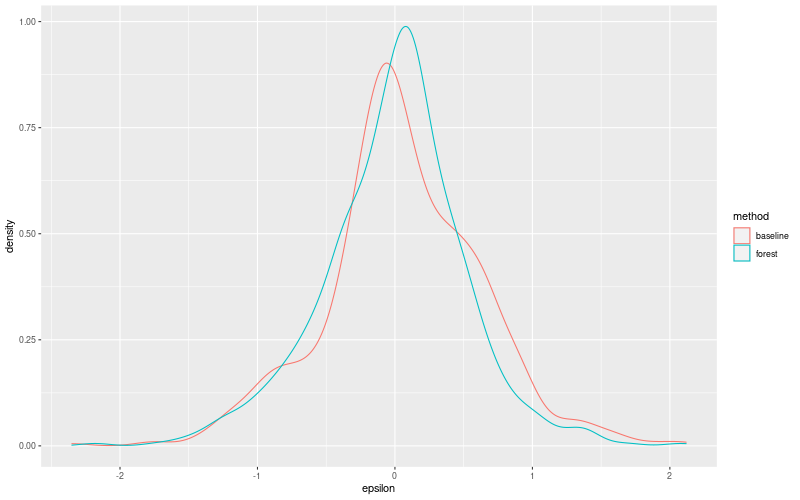
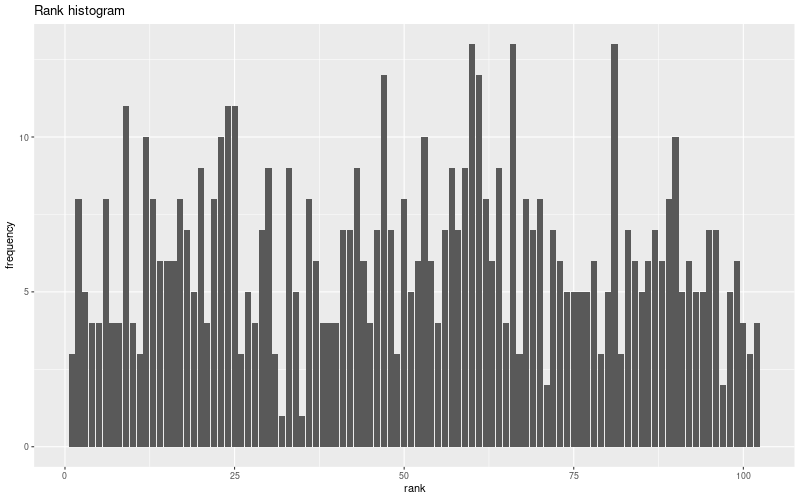
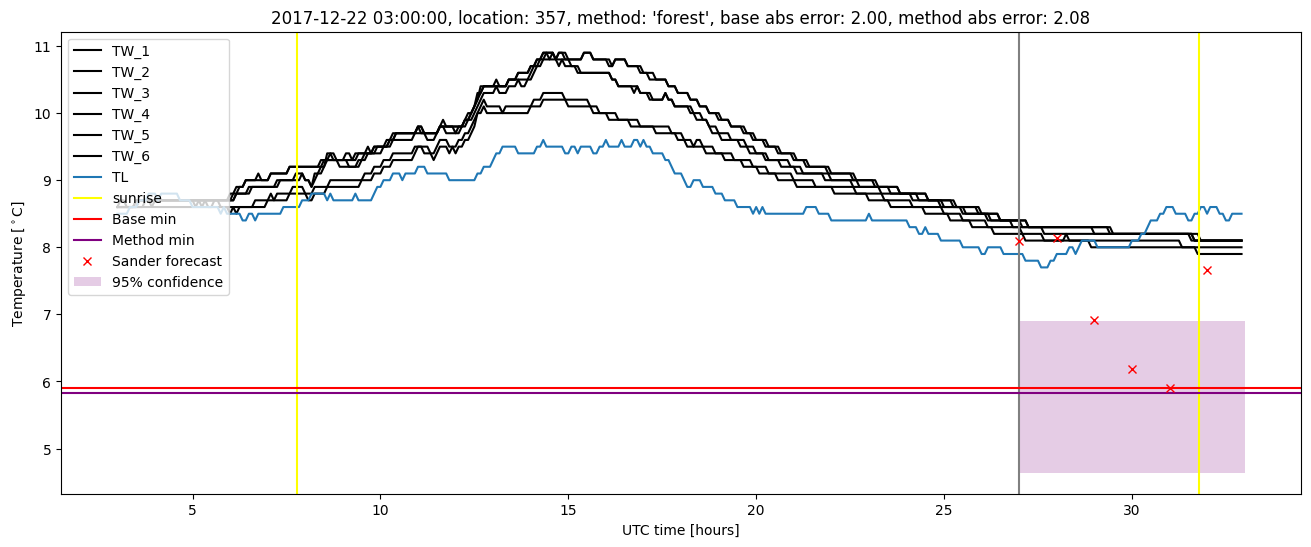
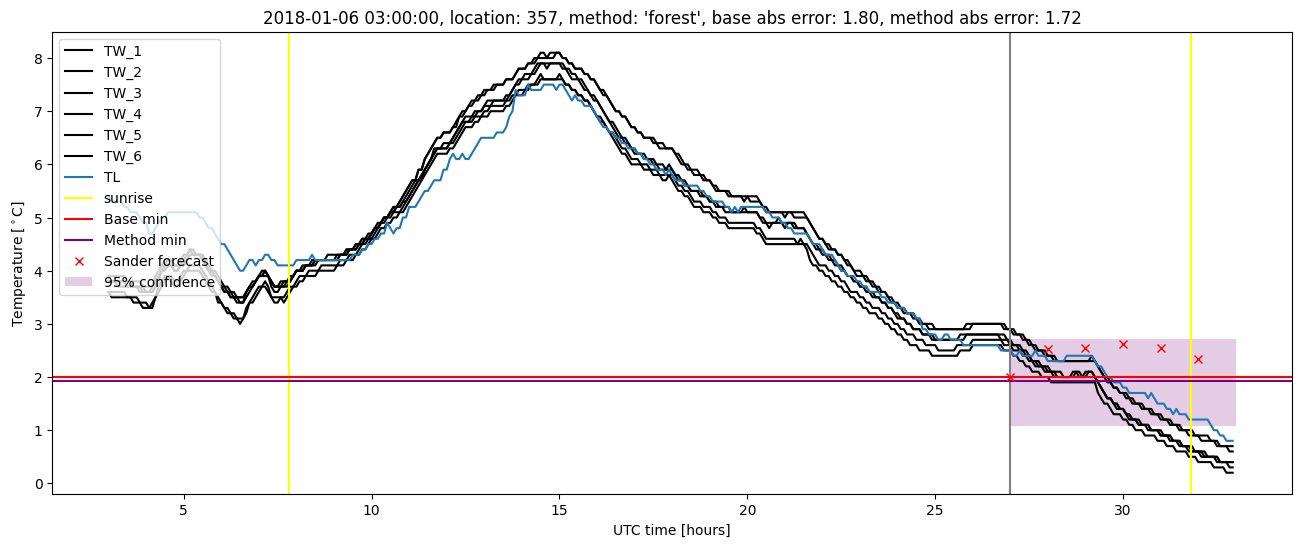
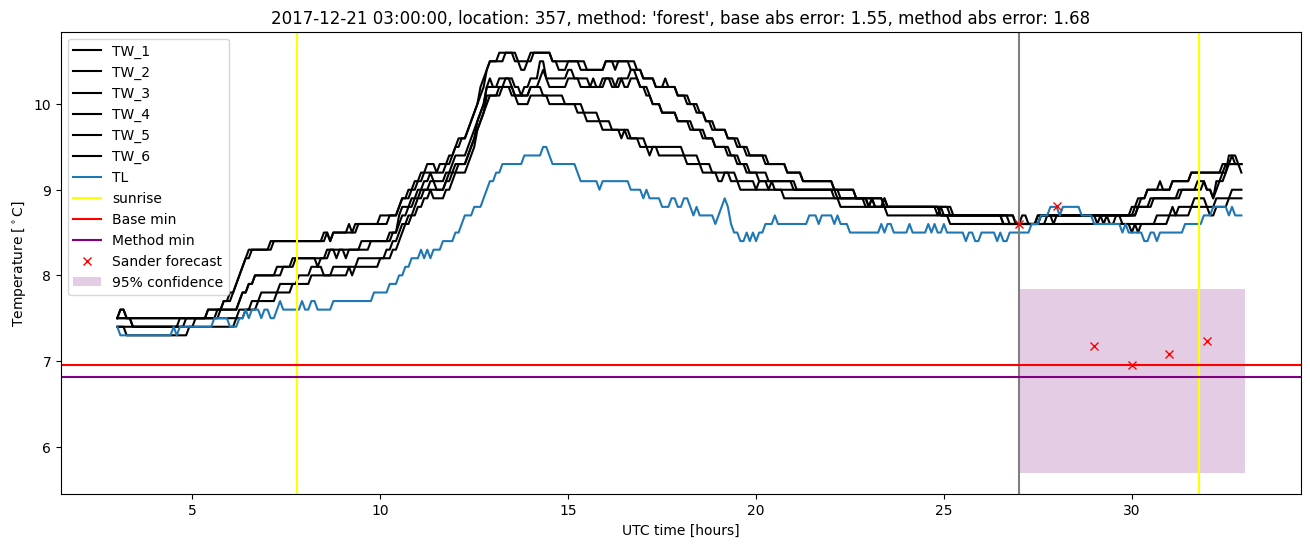
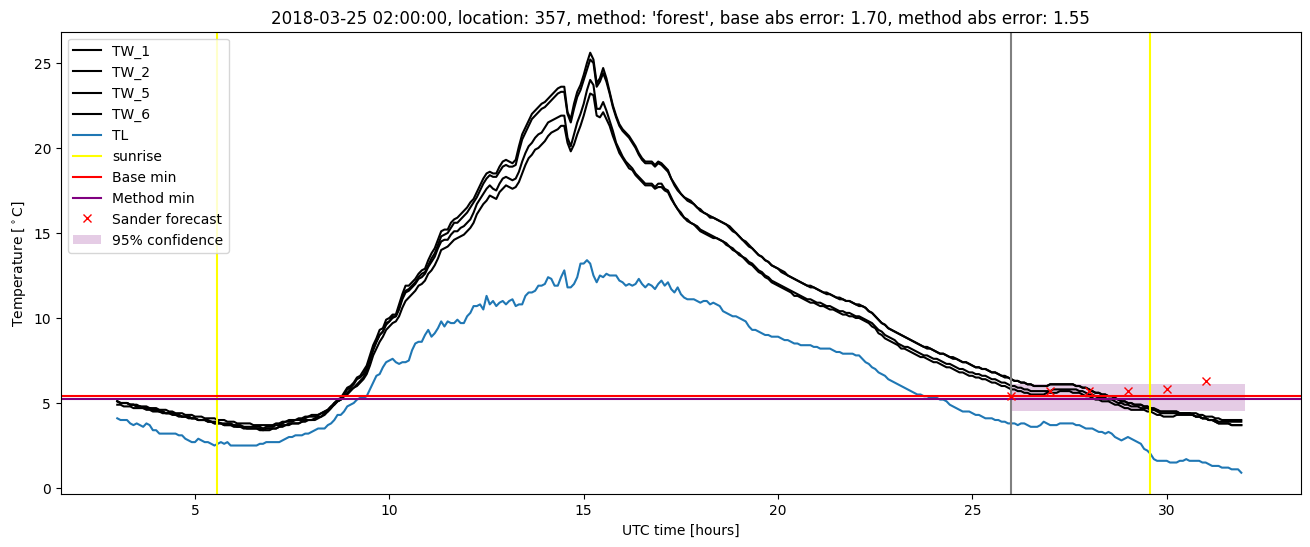
Random forest plots
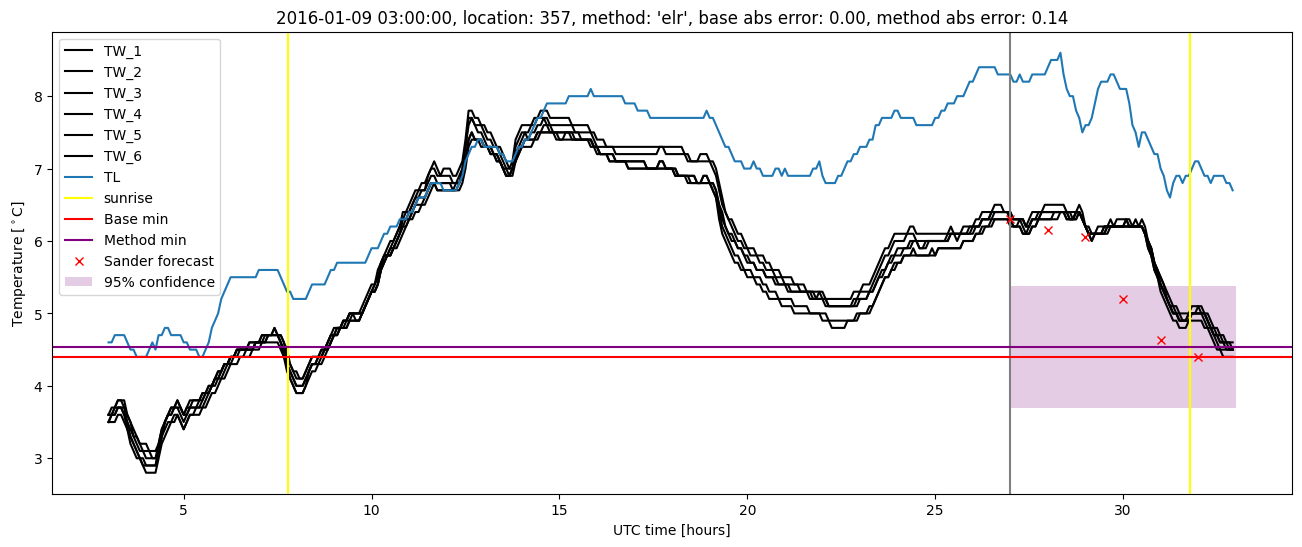
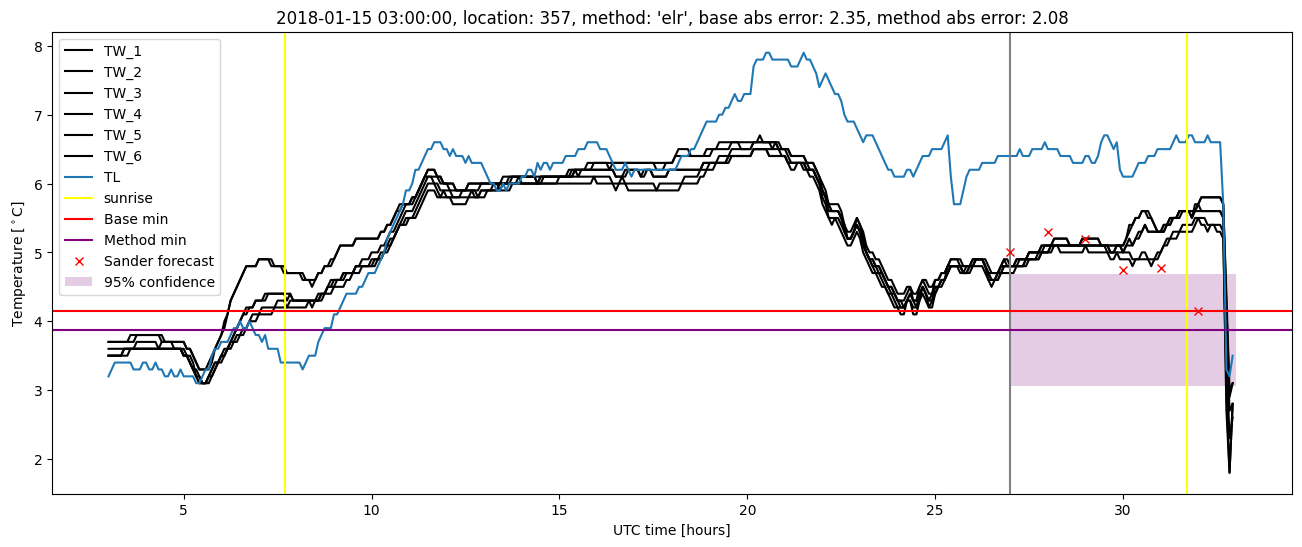
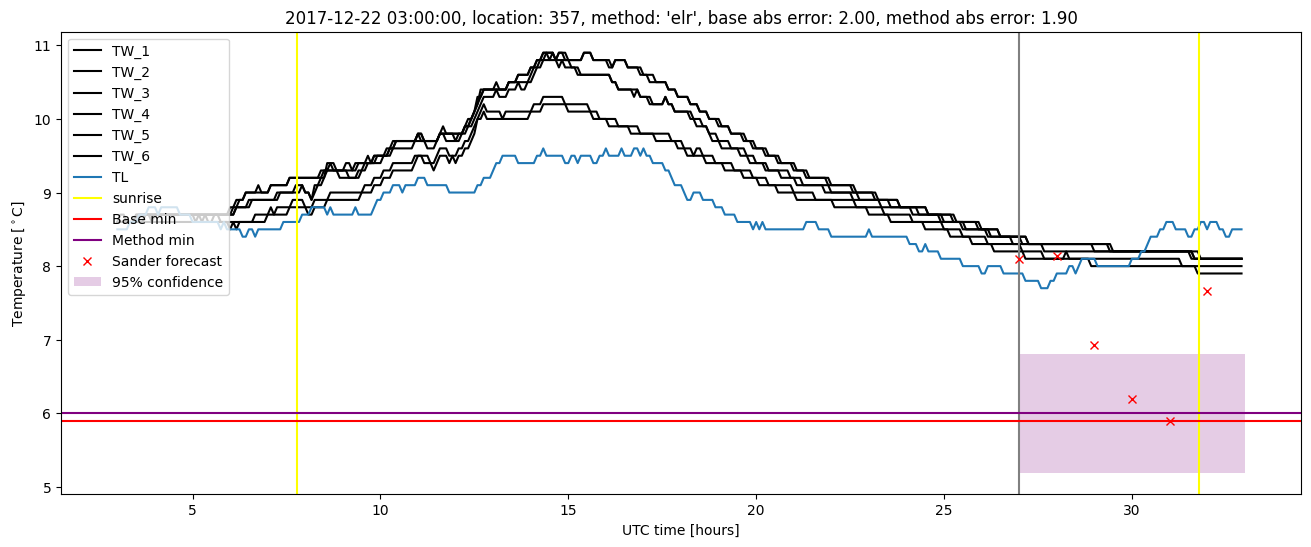
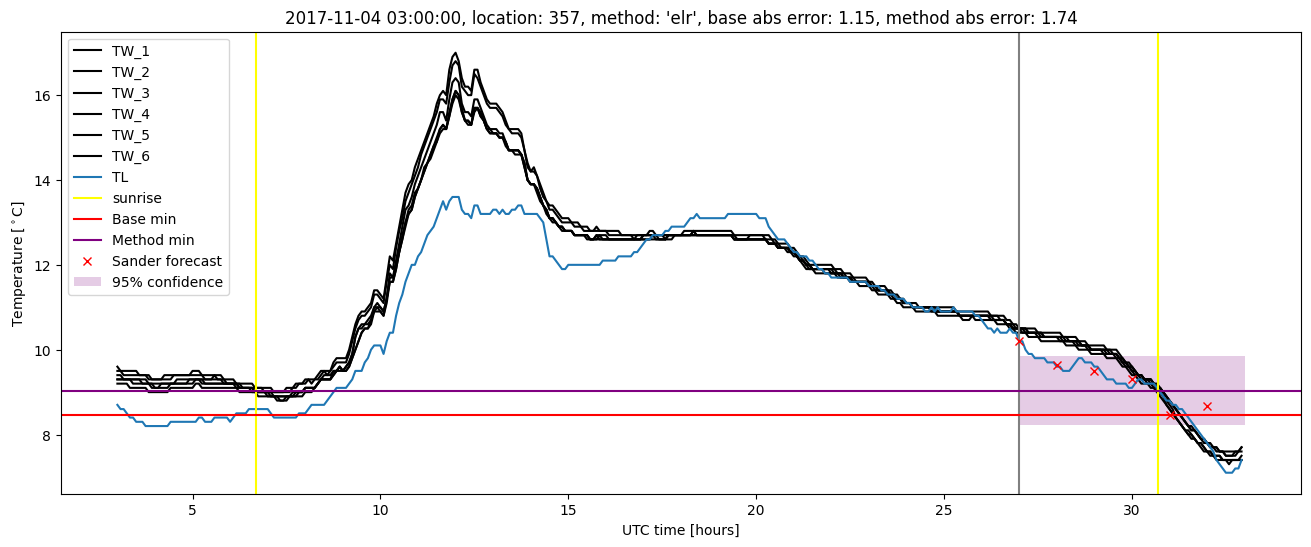
Extended logistic regression results
| names |
period |
power |
significance |
meanSquareError |
absError |
maxError |
CRPS |
IGN |
| baseline |
winter 2016 |
0.990 |
0.000e+00 |
0.319 |
0.429 |
1.538 |
NaN |
NaN |
| elr |
winter 2016 |
0.980 |
0.000e+00 |
0.254 |
0.391 |
1.619 |
0.519 |
4.656 |
| baseline |
winter 2017 |
0.977 |
0.045 |
0.353 |
0.452 |
2.118 |
NaN |
NaN |
| elr |
winter 2017 |
0.985 |
0.000e+00 |
0.279 |
0.399 |
1.683 |
0.504 |
4.086 |
| baseline |
winter 2018 |
0.993 |
0.000e+00 |
0.393 |
0.467 |
2.350 |
NaN |
NaN |
| elr |
winter 2018 |
0.993 |
0.000e+00 |
0.357 |
0.451 |
2.077 |
0.509 |
5.051 |
| baseline |
winter 2019 |
0.973 |
0.000e+00 |
0.259 |
0.376 |
1.831 |
NaN |
NaN |
| elr |
winter 2019 |
0.982 |
0.111 |
0.226 |
0.347 |
1.718 |
0.489 |
3.629 |
| baseline |
all |
0.985 |
0.016 |
0.335 |
0.434 |
2.350 |
NaN |
NaN |
| elr |
all |
0.985 |
0.016 |
0.281 |
0.400 |
2.077 |
0.507 |
4.427 |
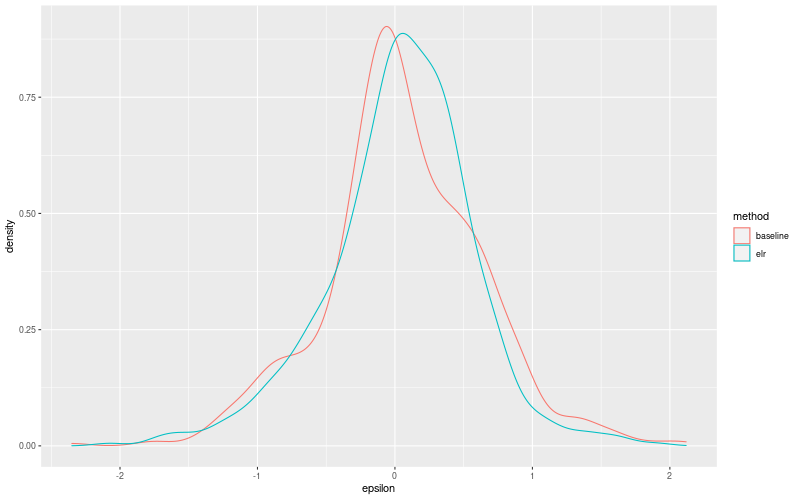
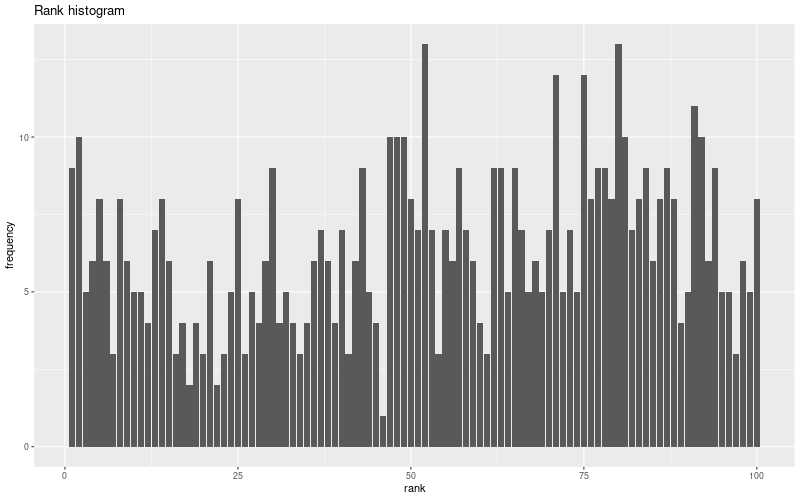
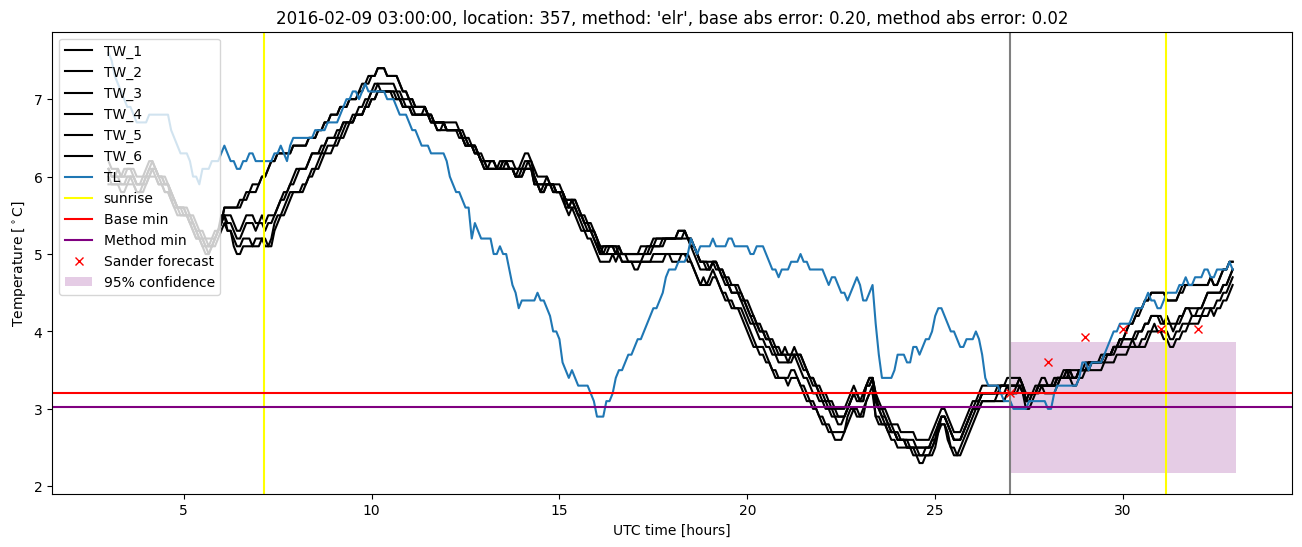
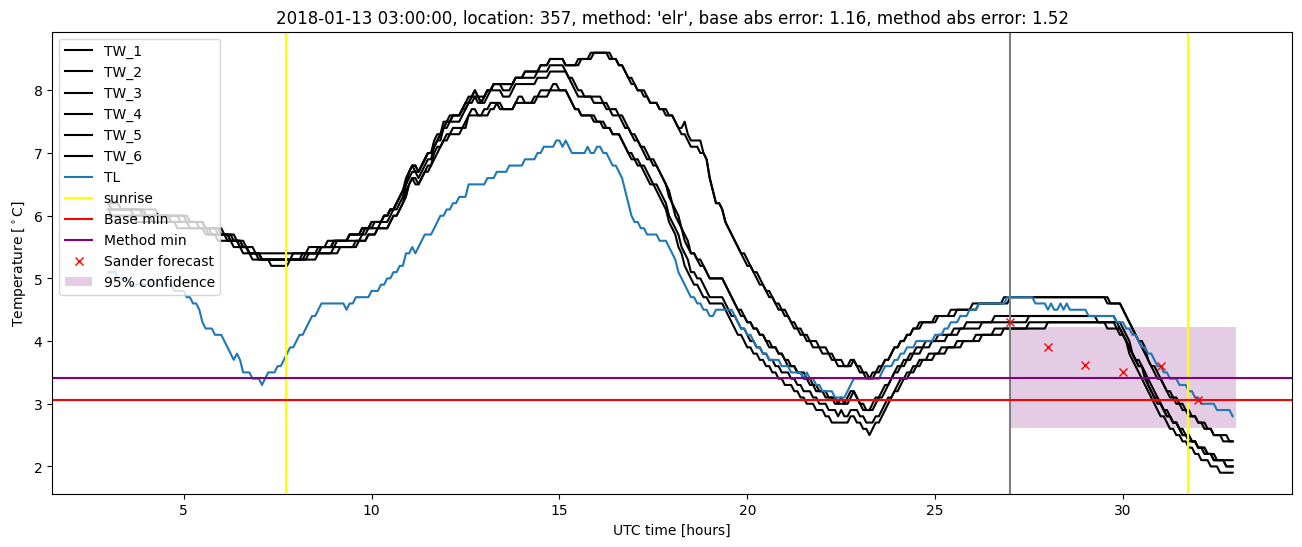
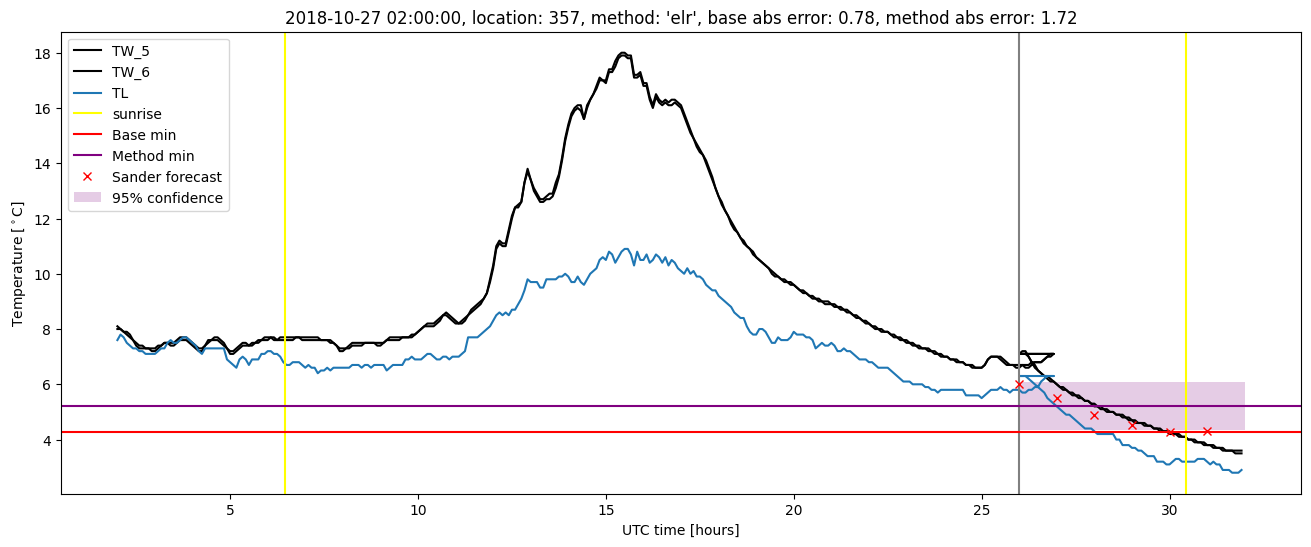
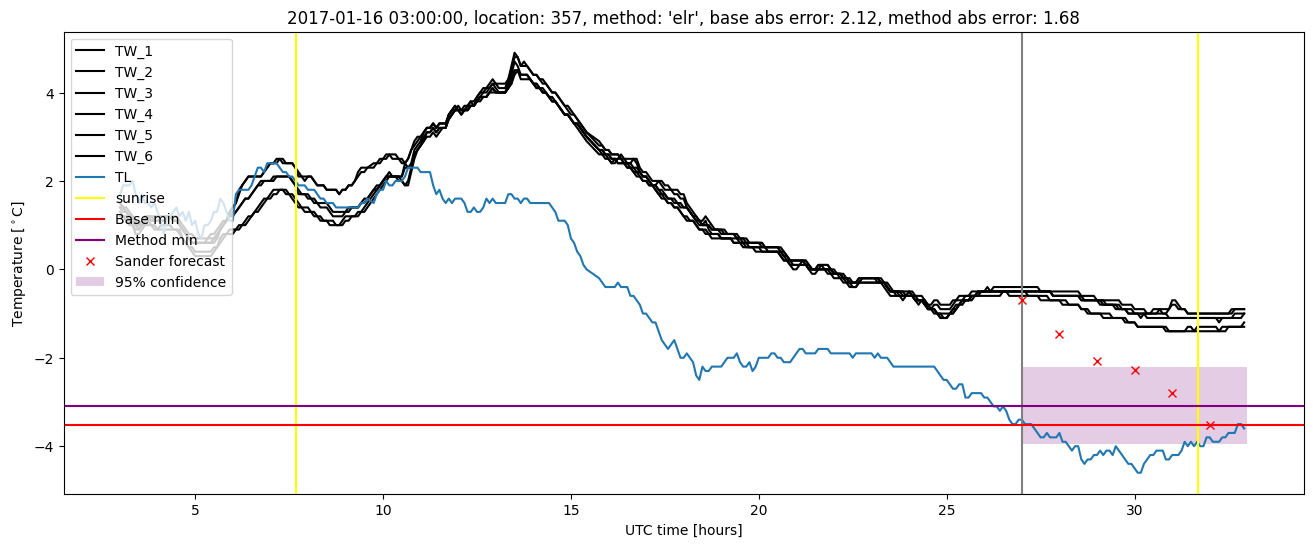
Extended logistic regression plots