GMS location: 355
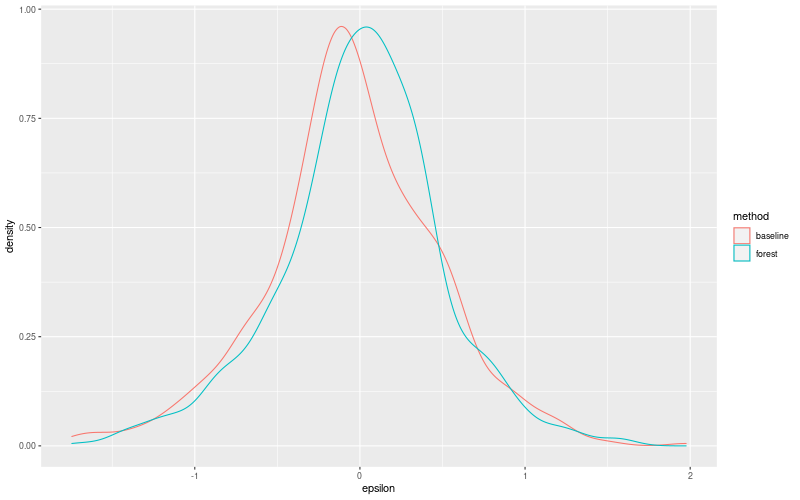
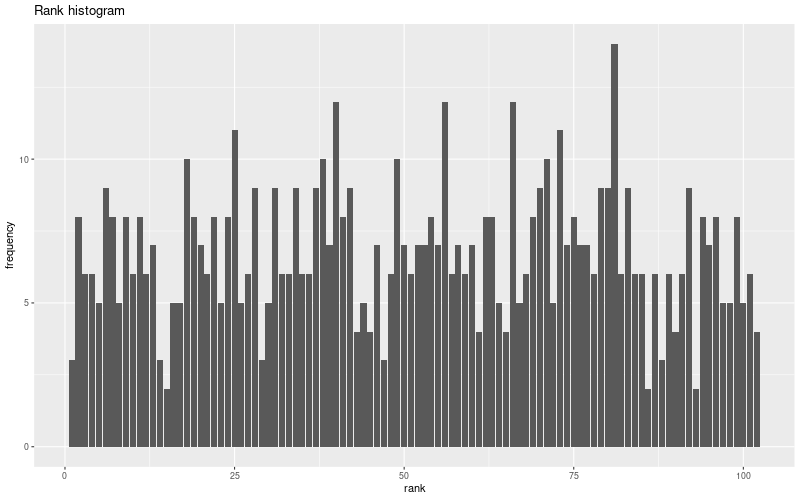
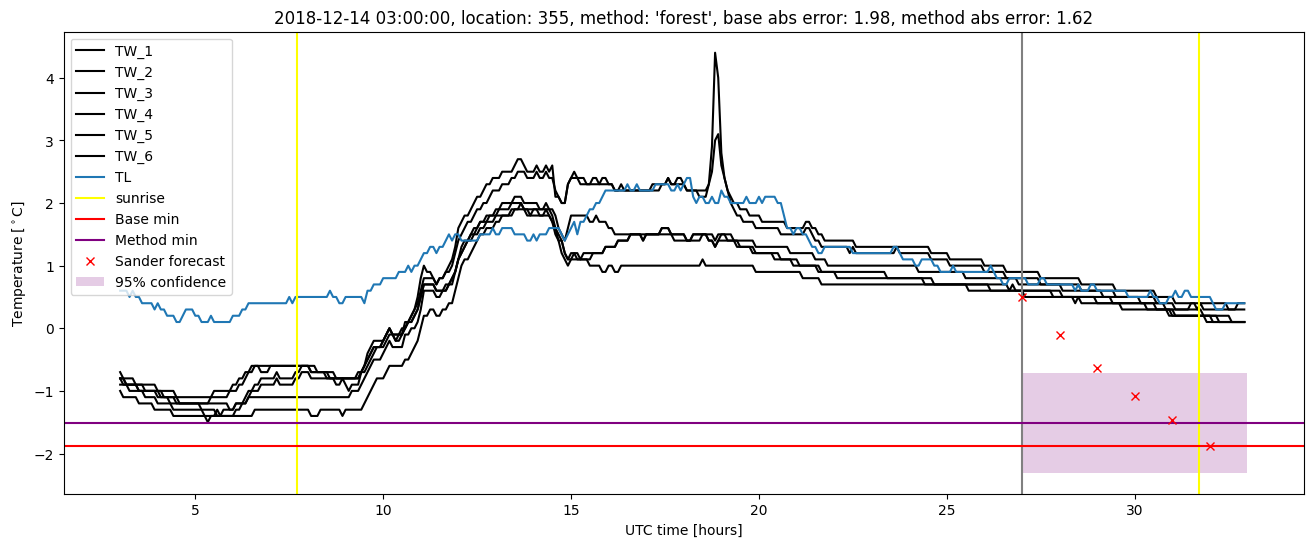
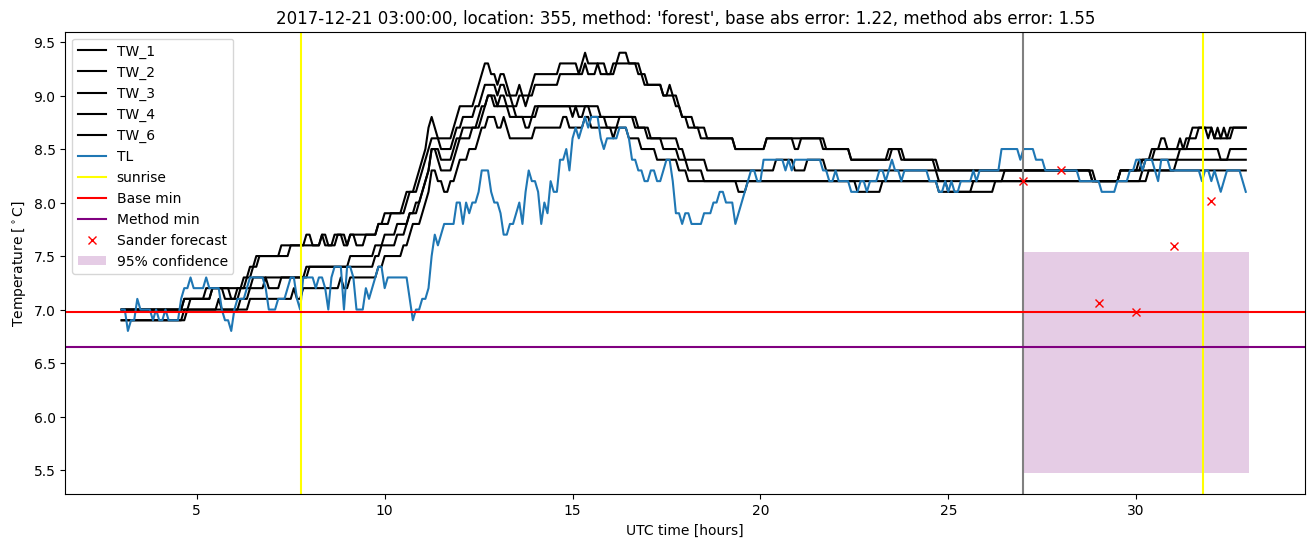
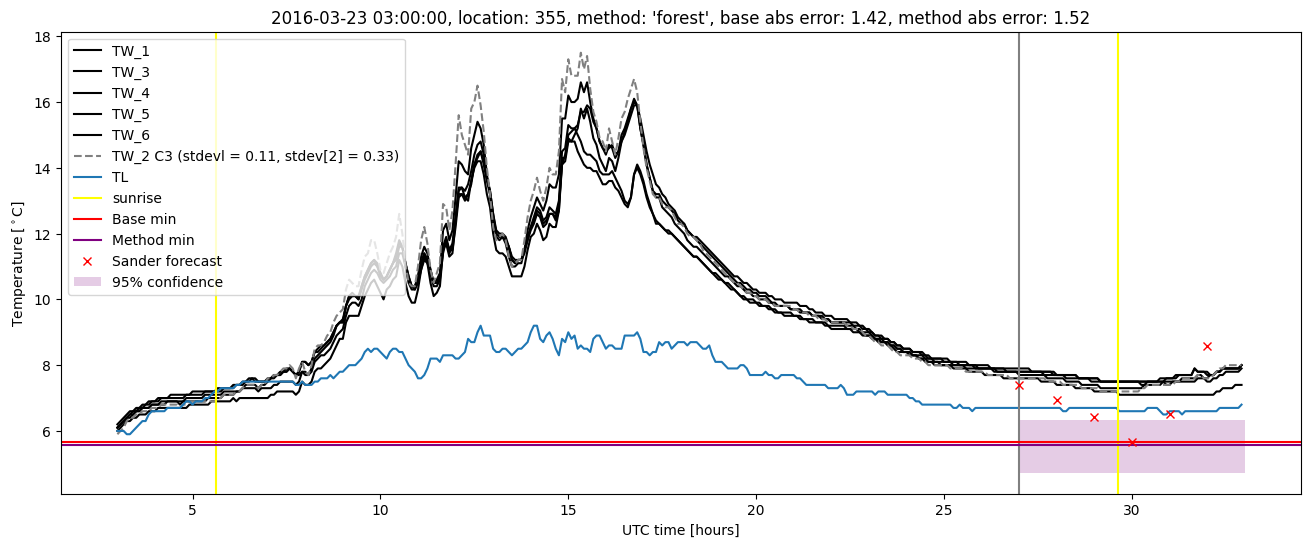
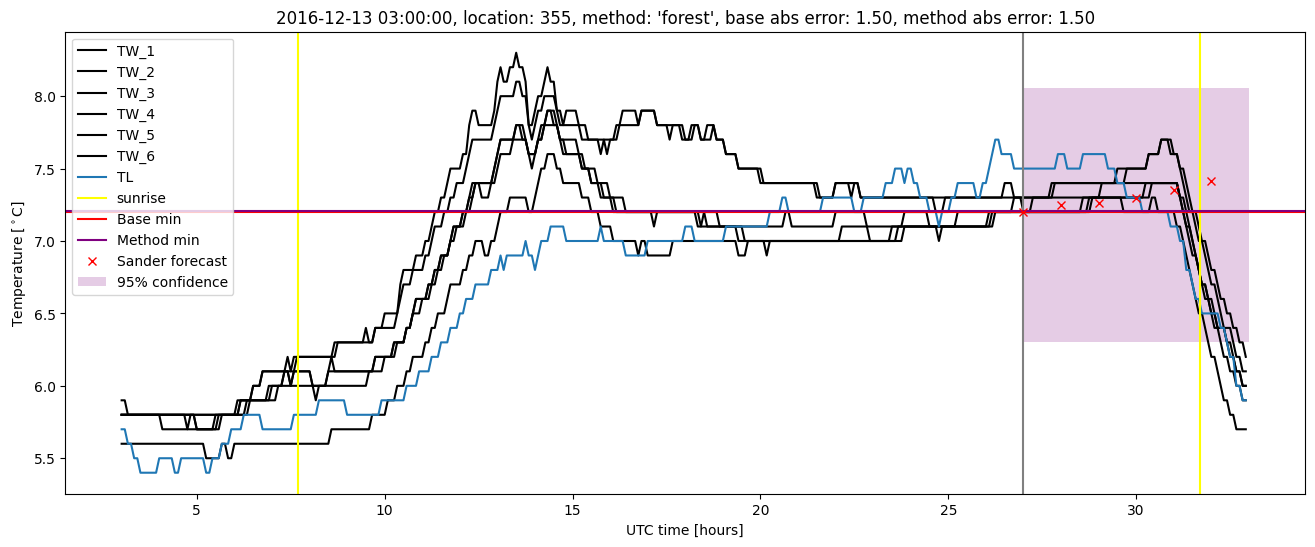
Random forest results
| names |
period |
power |
significance |
meanSquareError |
absError |
maxError |
CRPS |
IGN |
| baseline |
winter 2016 |
0.990 |
0.000e+00 |
0.261 |
0.390 |
1.604 |
NaN |
NaN |
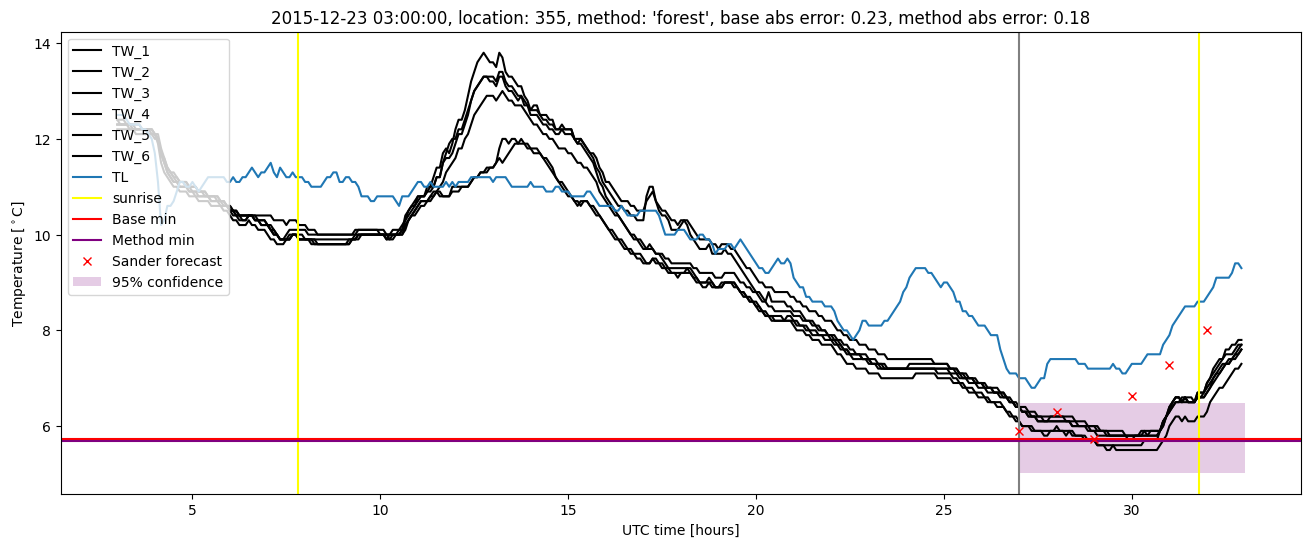
| forest |
winter 2016 |
0.995 |
0.000e+00 |
0.233 |
0.361 |
1.693 |
0.501 |
4.452 |
| baseline |
winter 2017 |
0.984 |
0.067 |
0.273 |
0.407 |
1.500 |
NaN |
NaN |
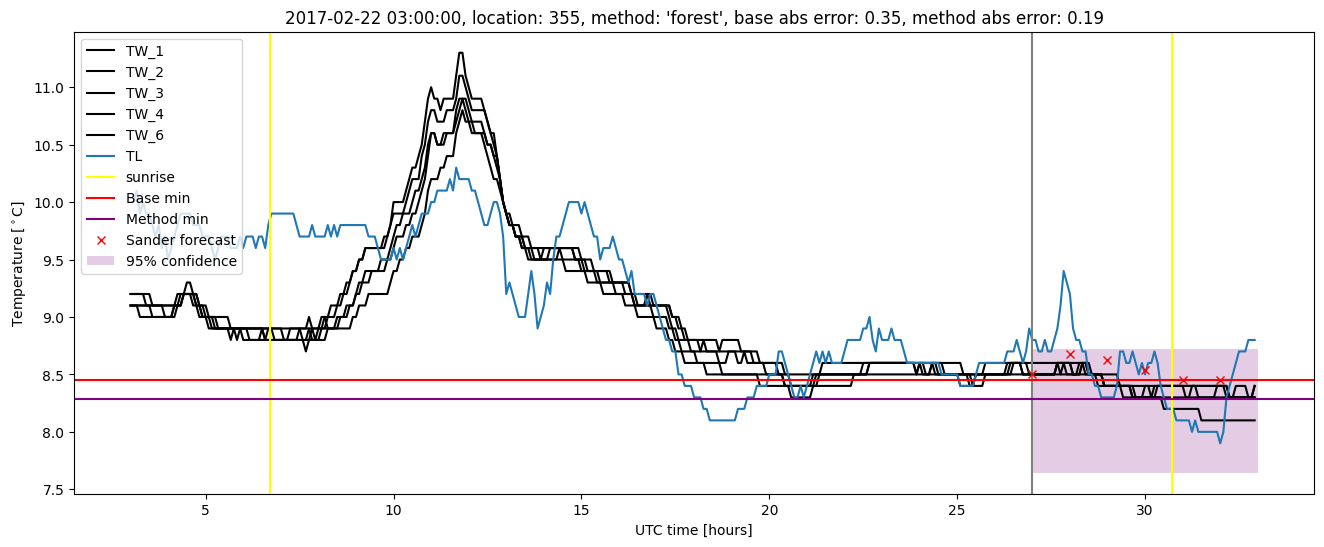
| forest |
winter 2017 |
0.992 |
0.067 |
0.249 |
0.385 |
1.504 |
0.499 |
4.468 |
| baseline |
winter 2018 |
0.994 |
0.095 |
0.308 |
0.425 |
1.744 |
NaN |
NaN |
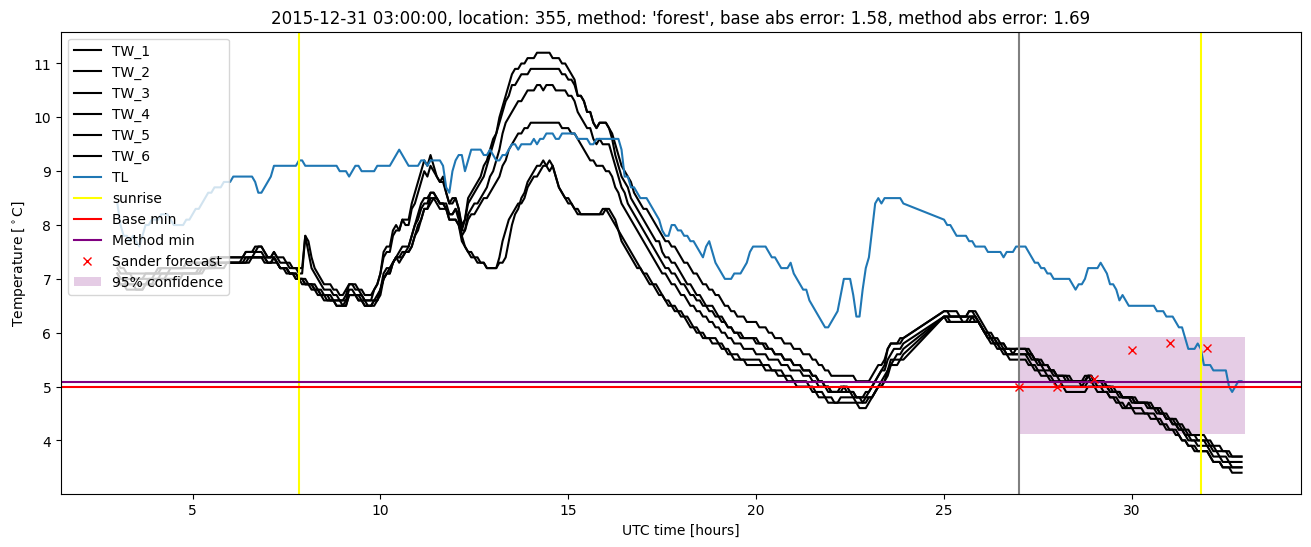
| forest |
winter 2018 |
0.987 |
0.048 |
0.265 |
0.391 |
1.551 |
0.514 |
4.725 |
| baseline |
winter 2019 |
0.986 |
0.000e+00 |
0.258 |
0.372 |
1.975 |
NaN |
NaN |
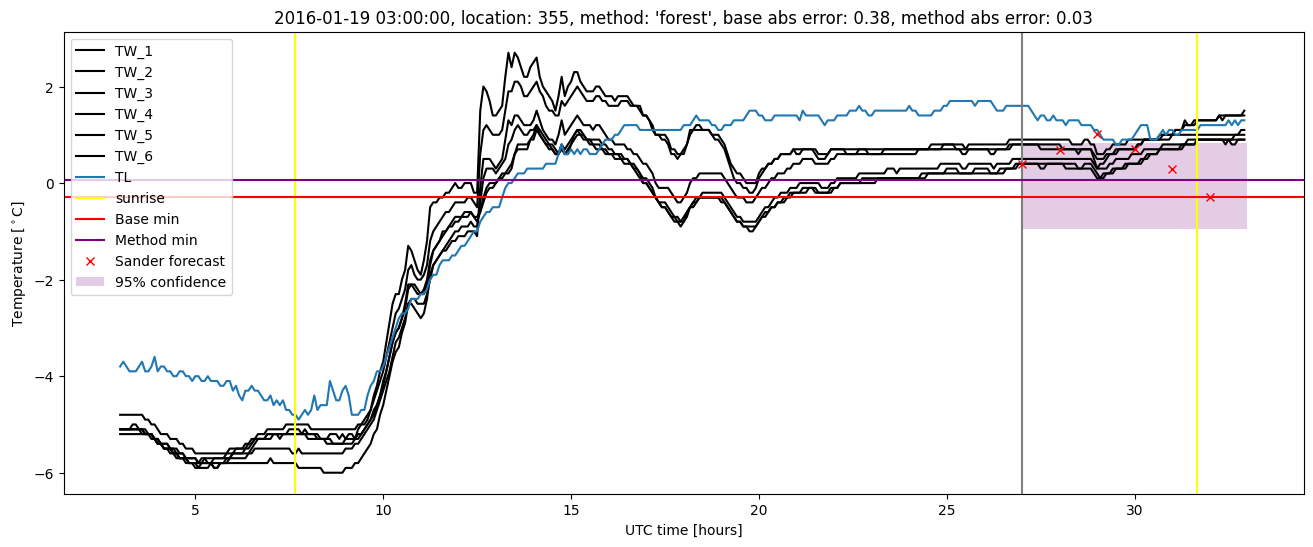
| forest |
winter 2019 |
0.986 |
0.000e+00 |
0.208 |
0.339 |
1.617 |
0.505 |
4.030 |
| baseline |
all |
0.989 |
0.051 |
0.275 |
0.398 |
1.975 |
NaN |
NaN |
| forest |
all |
0.990 |
0.038 |
0.239 |
0.369 |
1.693 |
0.504 |
4.427 |
Random forest plots
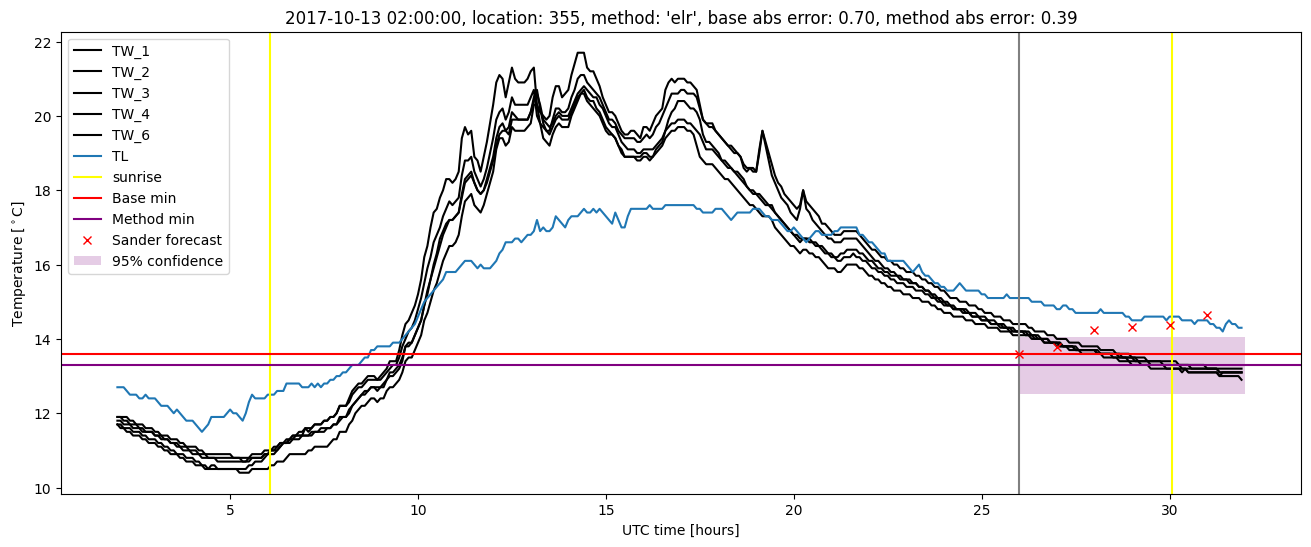
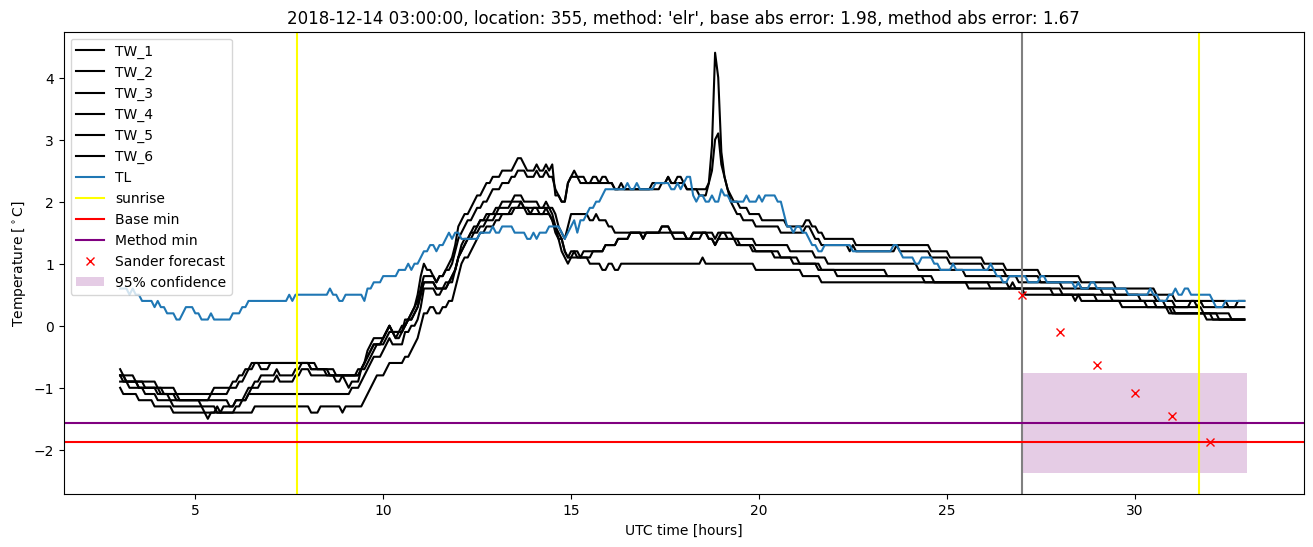
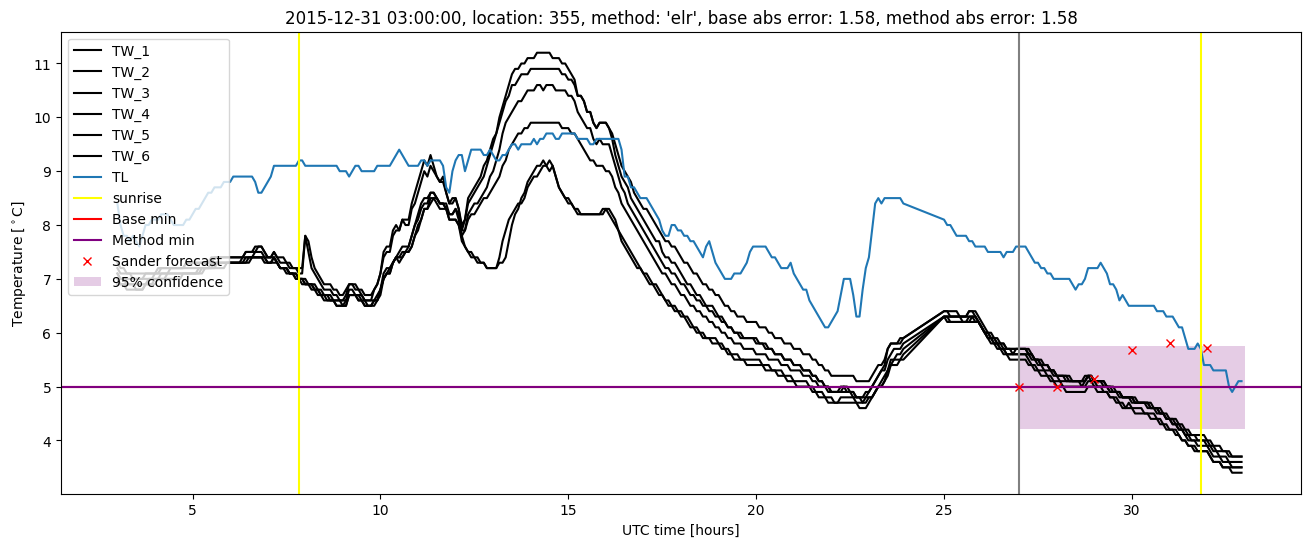
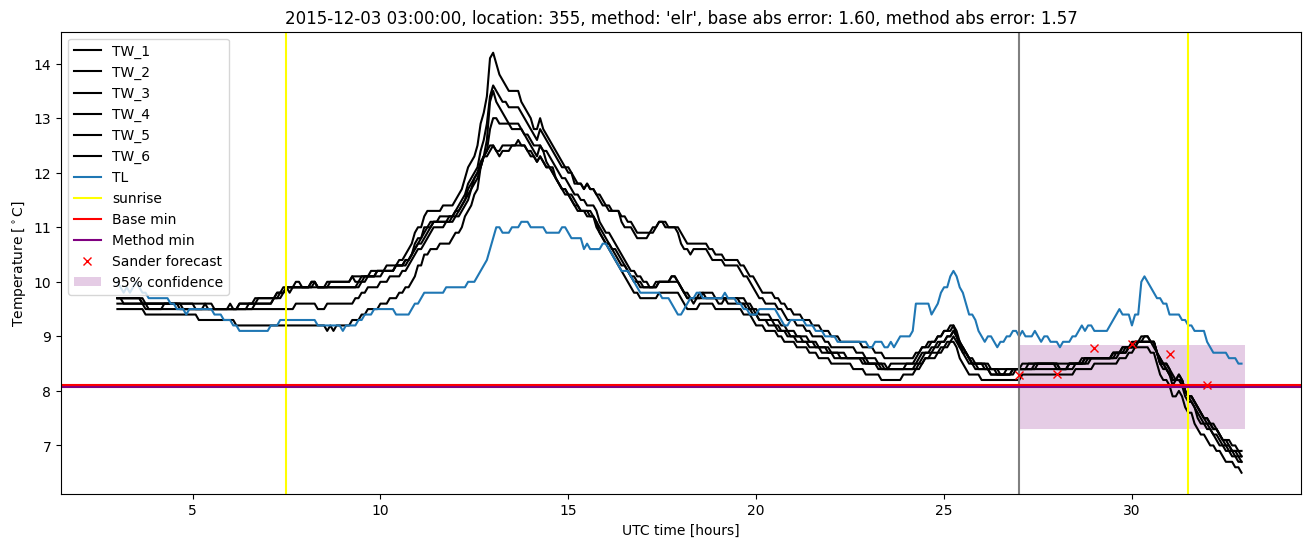
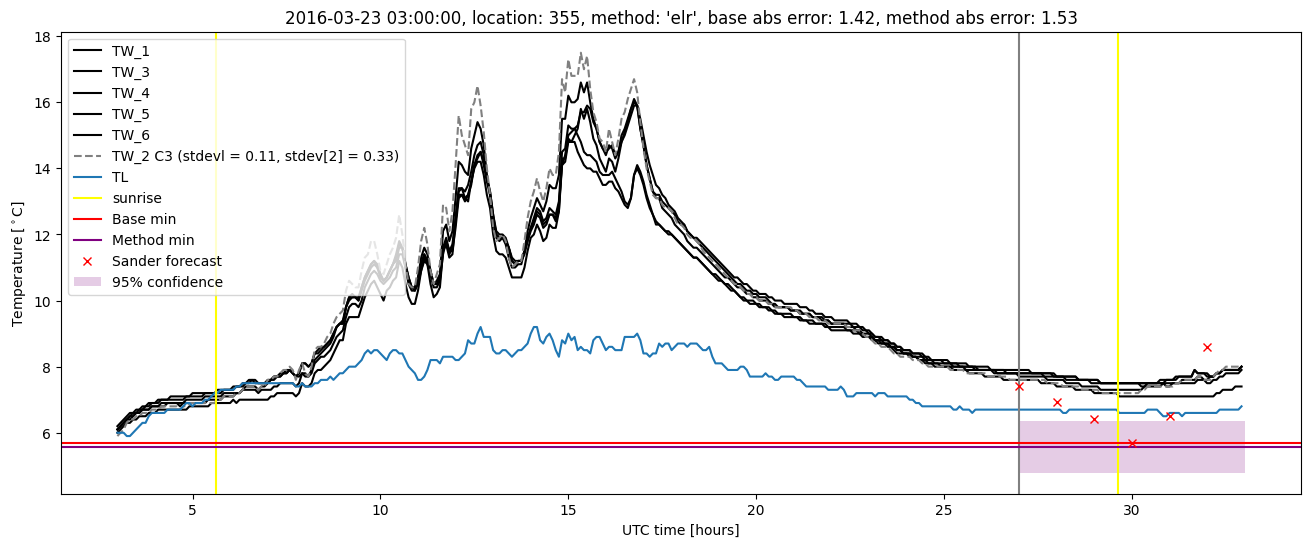
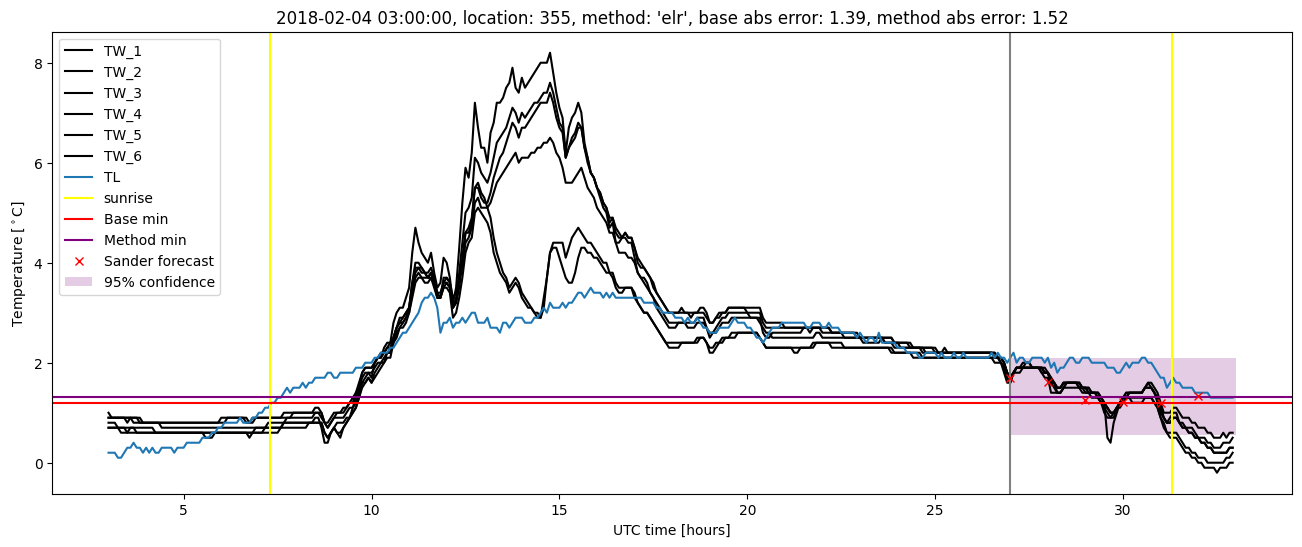
Extended logistic regression results
| names |
period |
power |
significance |
meanSquareError |
absError |
maxError |
CRPS |
IGN |
| baseline |
winter 2016 |
0.990 |
0.000e+00 |
0.261 |
0.390 |
1.604 |
NaN |
NaN |
| elr |
winter 2016 |
0.990 |
0.000e+00 |
0.253 |
0.393 |
1.583 |
0.575 |
7.583 |
| baseline |
winter 2017 |
0.984 |
0.067 |
0.273 |
0.407 |
1.500 |
NaN |
NaN |
| elr |
winter 2017 |
0.992 |
0.100 |
0.247 |
0.392 |
1.295 |
0.555 |
7.530 |
| baseline |
winter 2018 |
0.994 |
0.095 |
0.308 |
0.425 |
1.744 |
NaN |
NaN |
| elr |
winter 2018 |
0.994 |
0.095 |
0.275 |
0.404 |
1.524 |
0.553 |
7.472 |
| baseline |
winter 2019 |
0.986 |
0.000e+00 |
0.258 |
0.372 |
1.975 |
NaN |
NaN |
| elr |
winter 2019 |
0.986 |
0.000e+00 |
0.206 |
0.330 |
1.669 |
0.539 |
5.929 |
| baseline |
all |
0.989 |
0.051 |
0.275 |
0.398 |
1.975 |
NaN |
NaN |
| elr |
all |
0.990 |
0.064 |
0.246 |
0.381 |
1.669 |
0.557 |
7.164 |
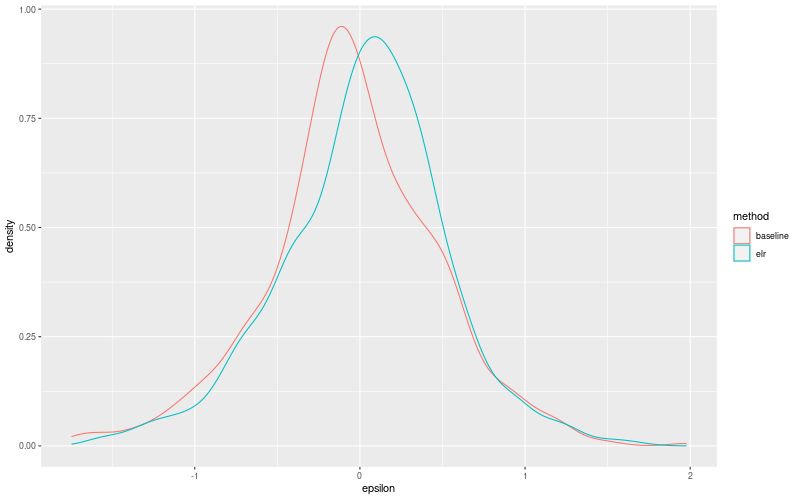
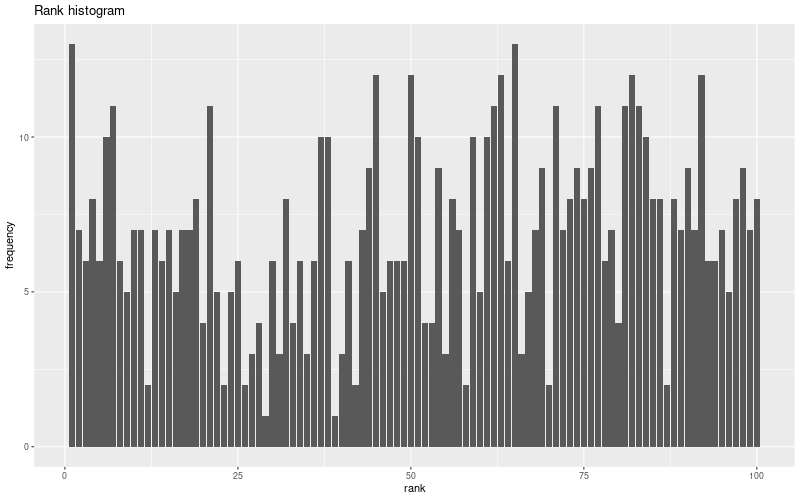
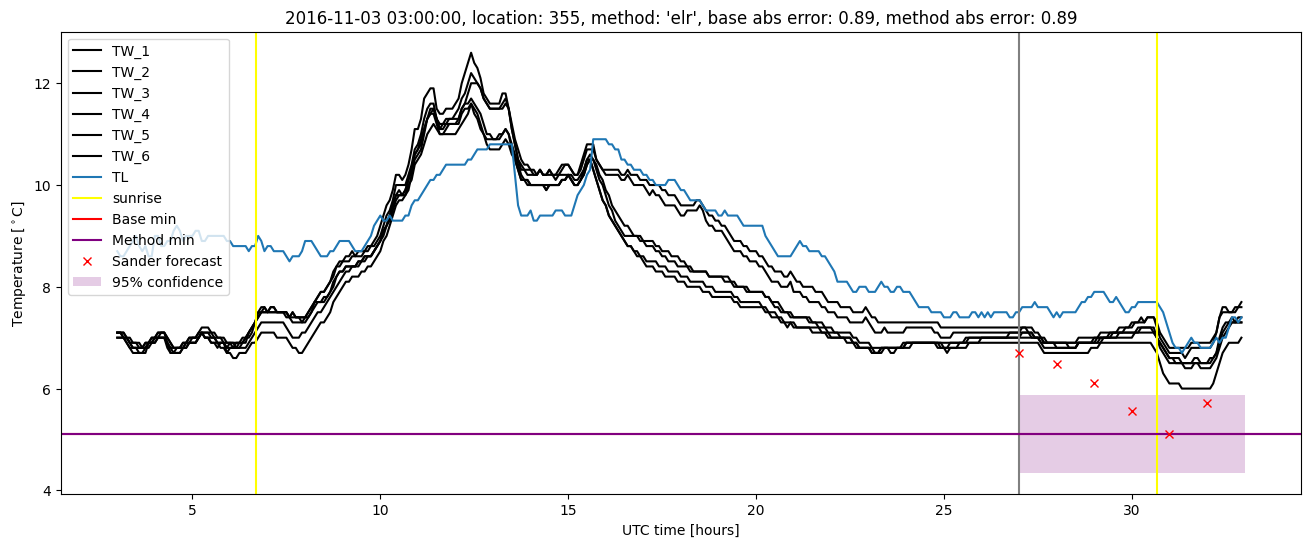
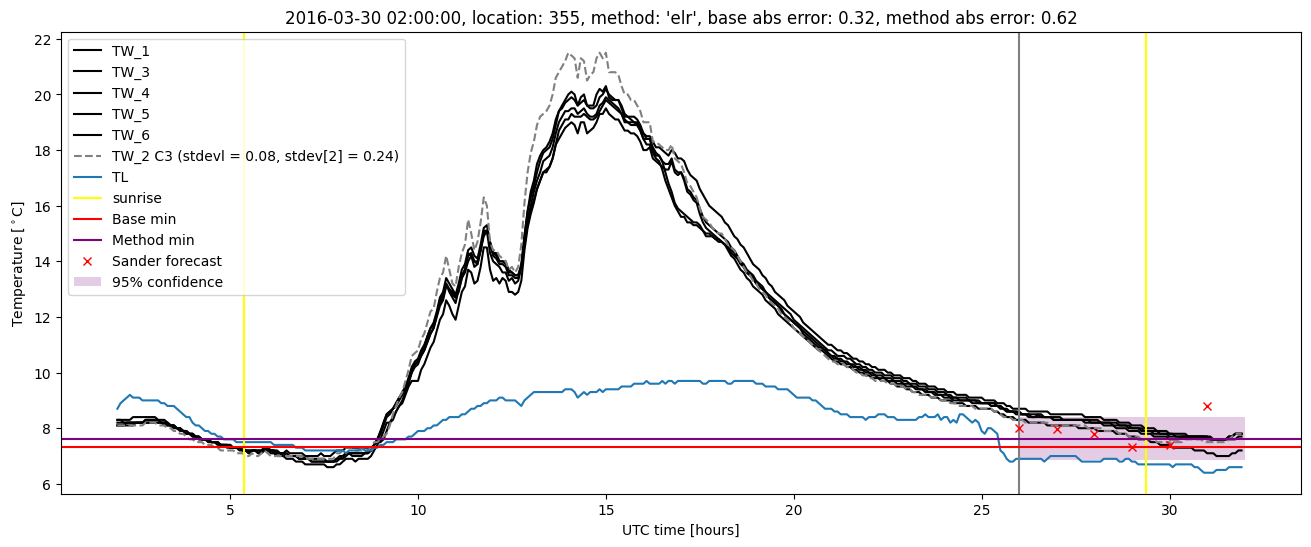
Extended logistic regression plots