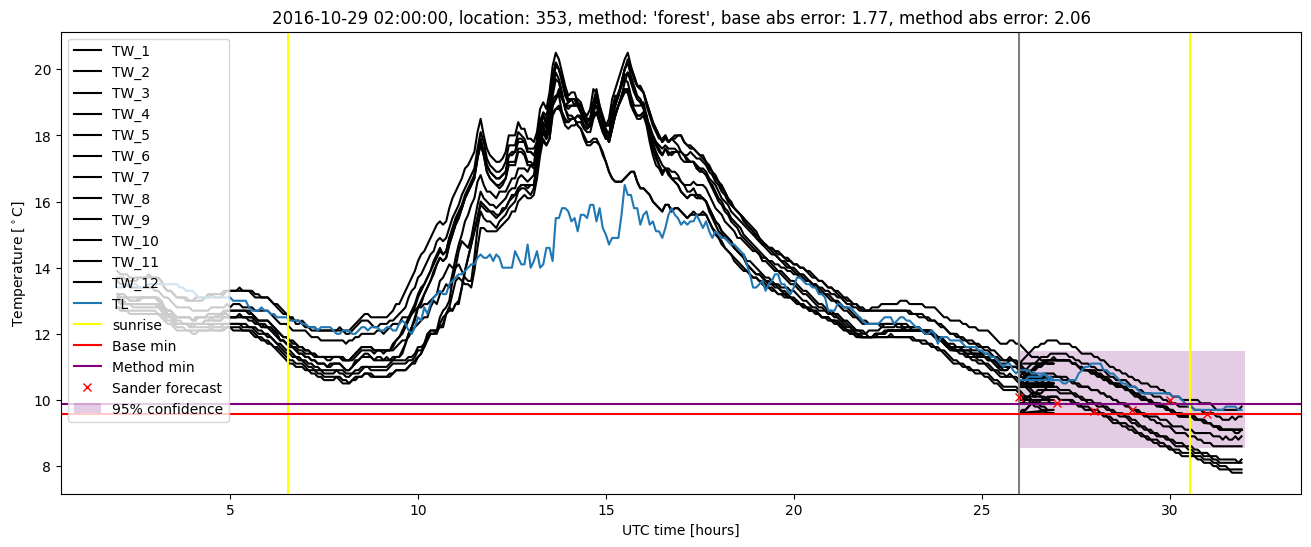
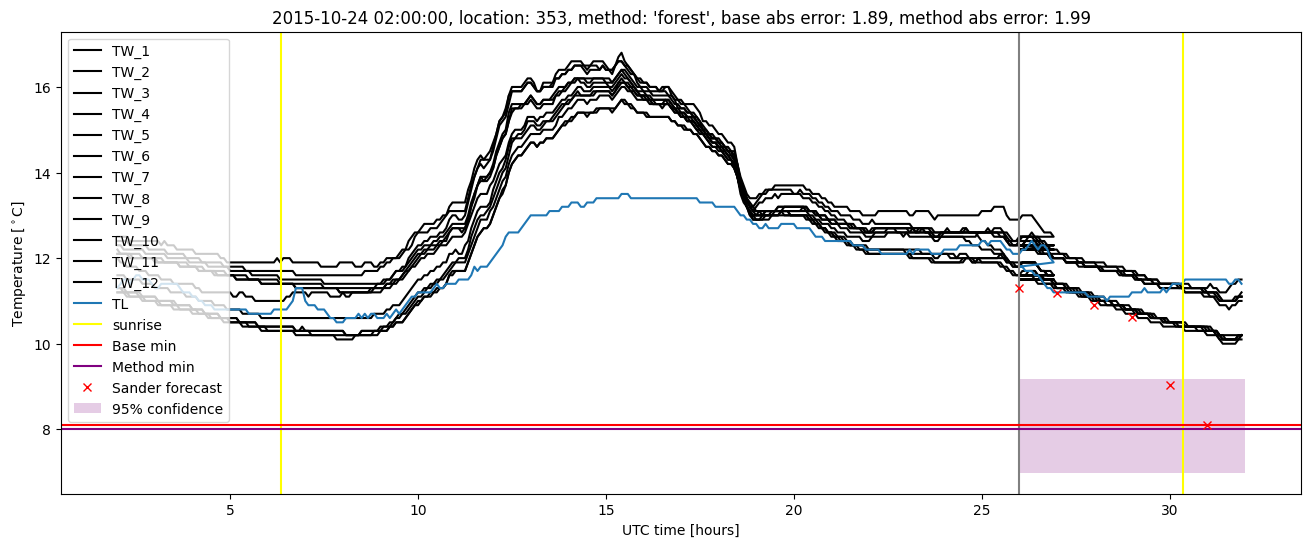
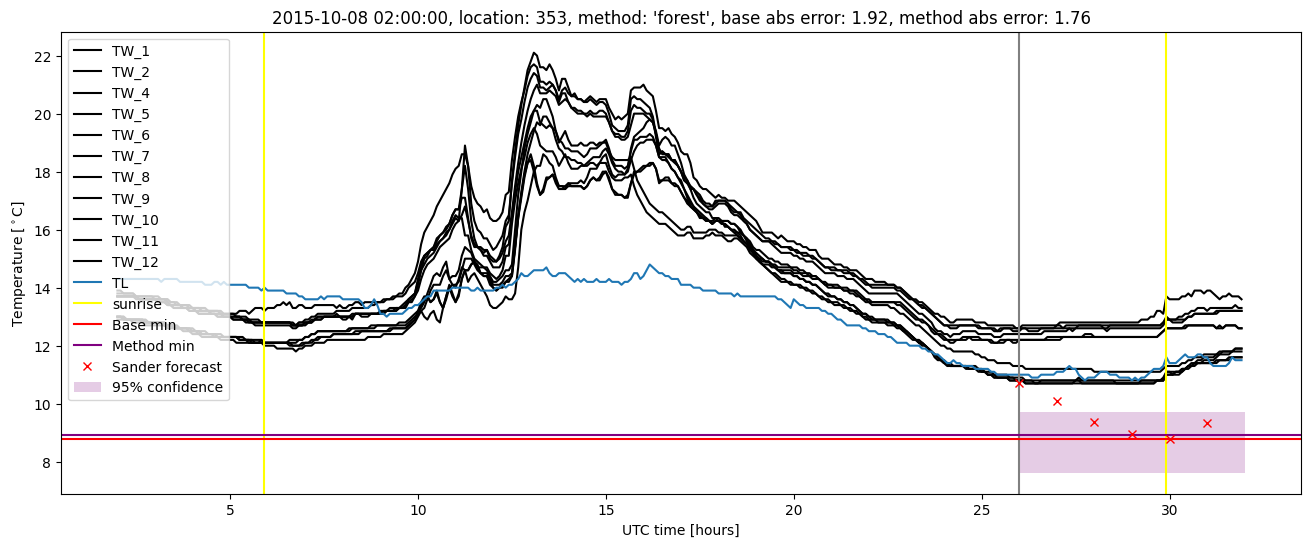
GMS location: 353
Random forest results
| names |
period |
power |
significance |
meanSquareError |
absError |
maxError |
CRPS |
IGN |
| baseline |
winter 2016 |
0.995 |
0.048 |
0.328 |
0.434 |
1.920 |
NaN |
NaN |
| forest |
winter 2016 |
0.995 |
0.048 |
0.291 |
0.402 |
1.990 |
0.468 |
3.185 |
| baseline |
winter 2017 |
0.975 |
0.031 |
0.307 |
0.423 |
1.863 |
NaN |
NaN |
| forest |
winter 2017 |
0.984 |
0.031 |
0.256 |
0.376 |
2.063 |
0.451 |
3.764 |
| baseline |
winter 2018 |
1.000 |
0.000e+00 |
0.354 |
0.407 |
3.397 |
NaN |
NaN |
| forest |
winter 2018 |
1.000 |
0.000e+00 |
0.326 |
0.372 |
3.575 |
0.501 |
4.637 |
| baseline |
winter 2019 |
0.993 |
0.059 |
0.305 |
0.407 |
1.680 |
NaN |
NaN |
| forest |
winter 2019 |
0.993 |
0.059 |
0.280 |
0.386 |
1.536 |
0.467 |
3.346 |
| baseline |
all |
0.991 |
0.032 |
0.324 |
0.419 |
3.397 |
NaN |
NaN |
| forest |
all |
0.993 |
0.032 |
0.288 |
0.385 |
3.575 |
0.471 |
3.678 |
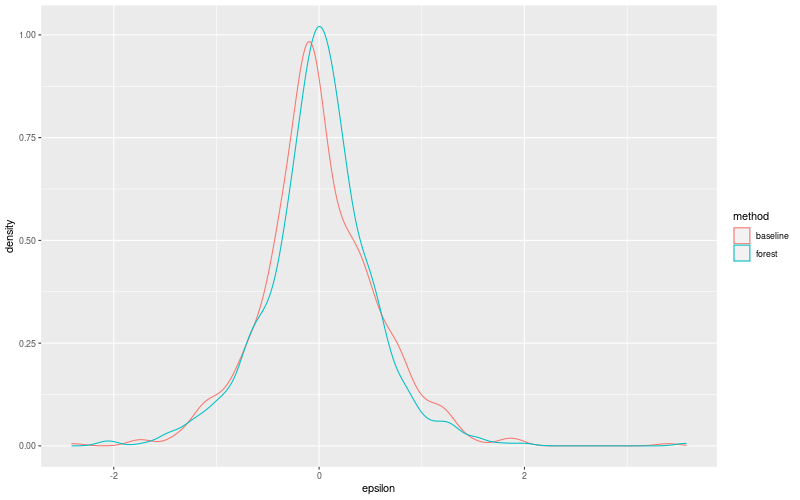
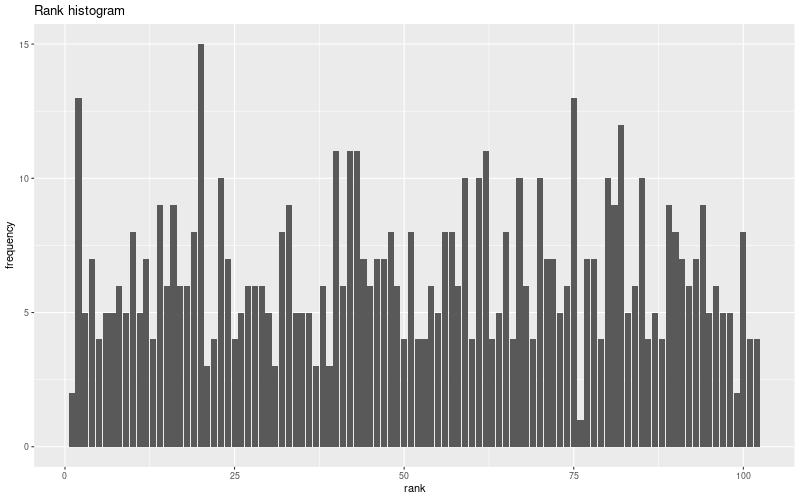
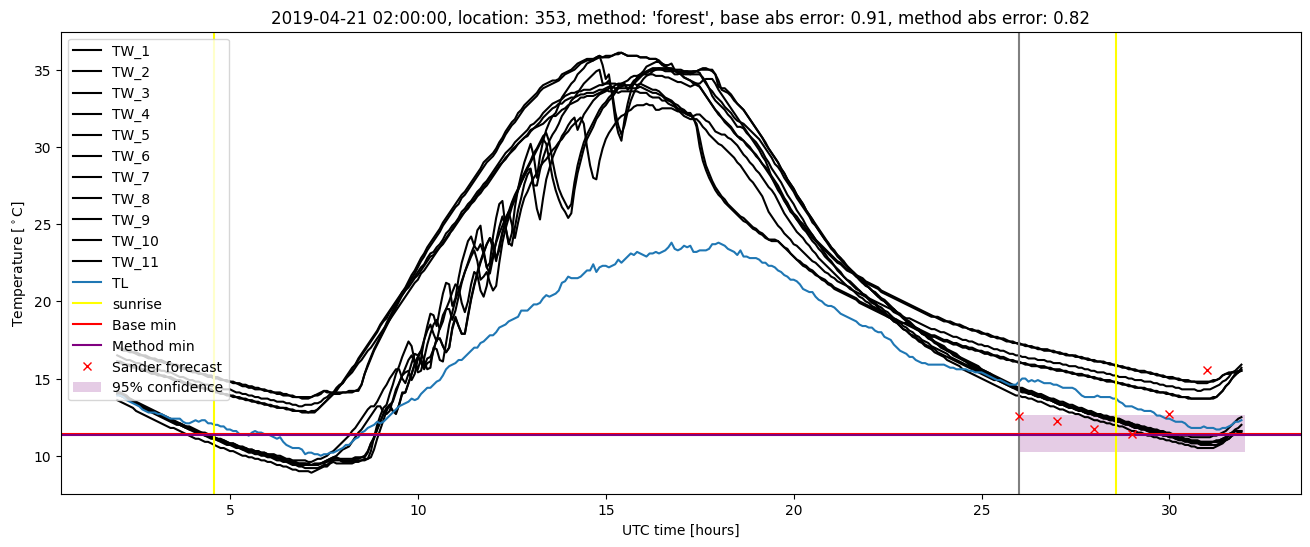
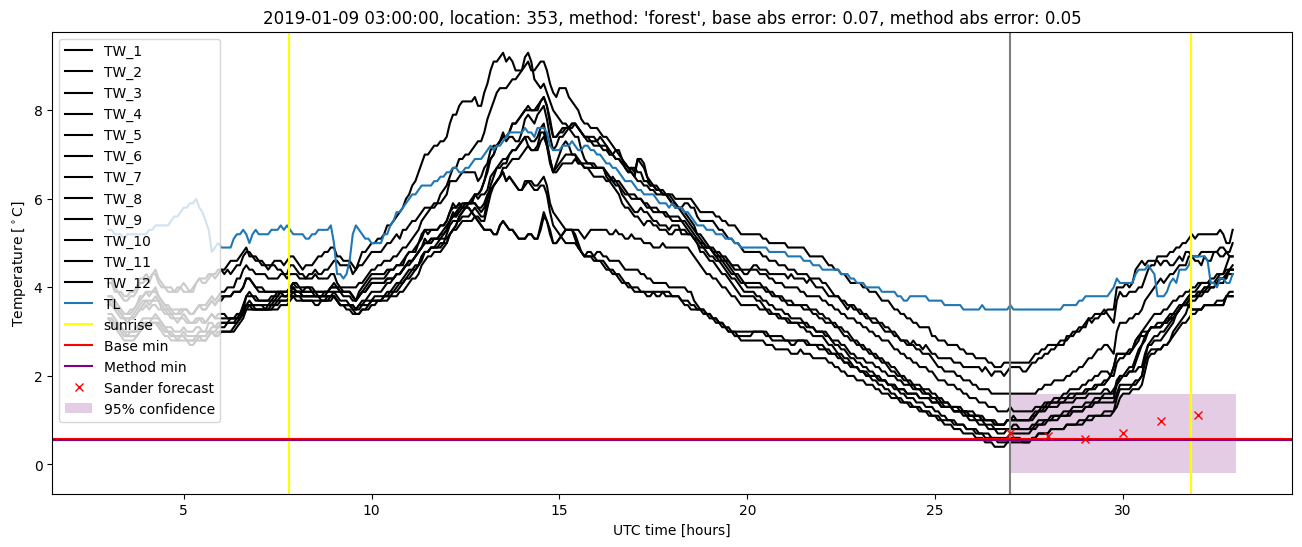
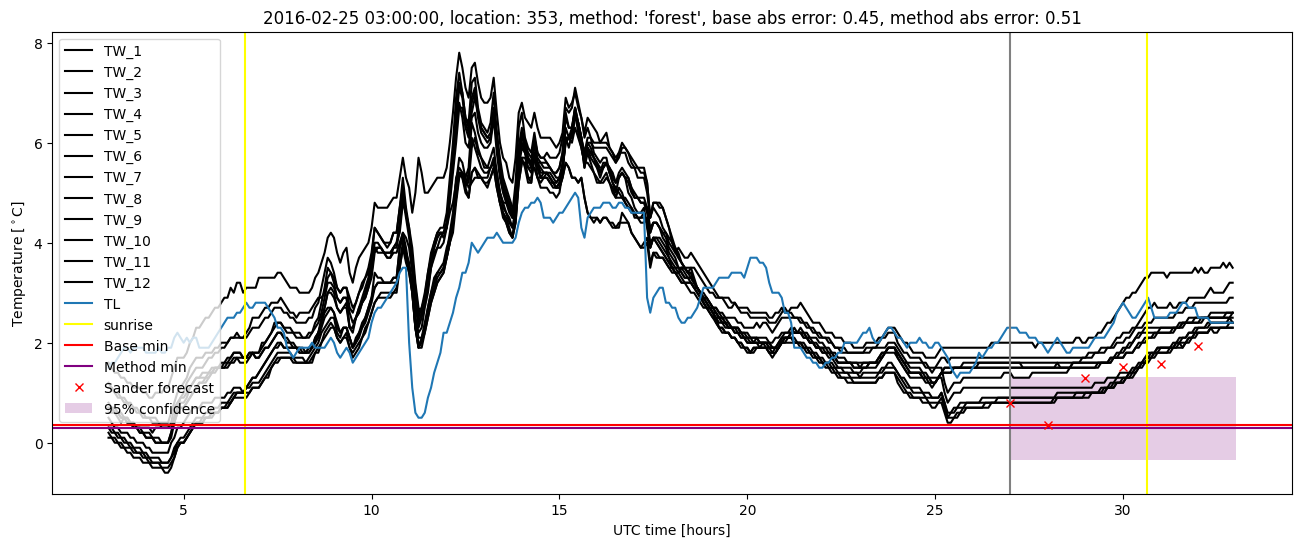
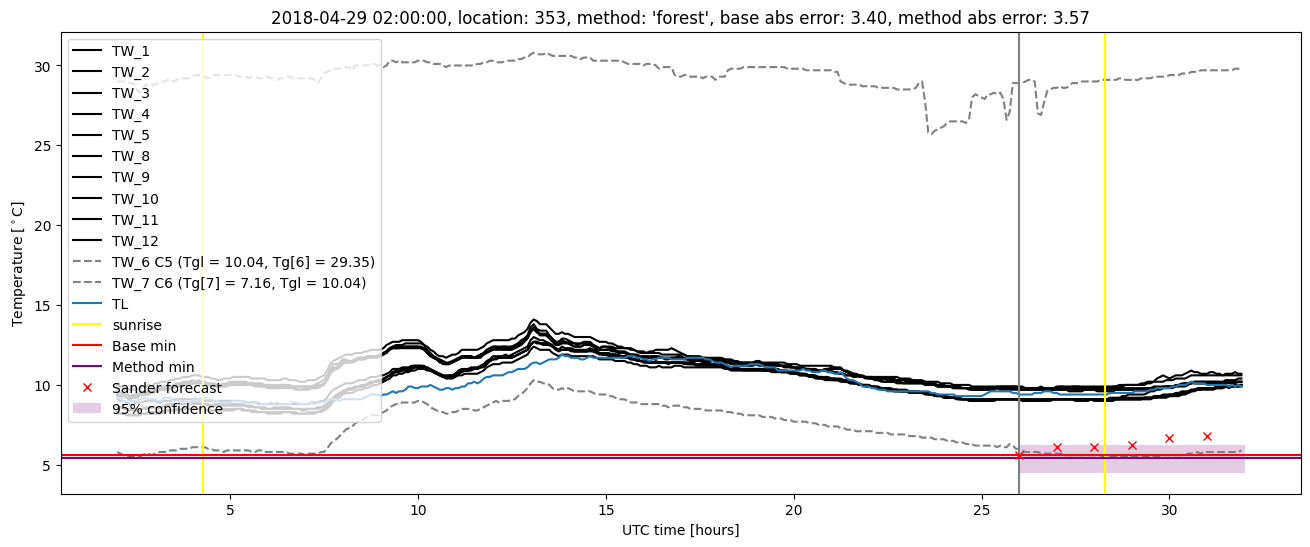
Random forest plots

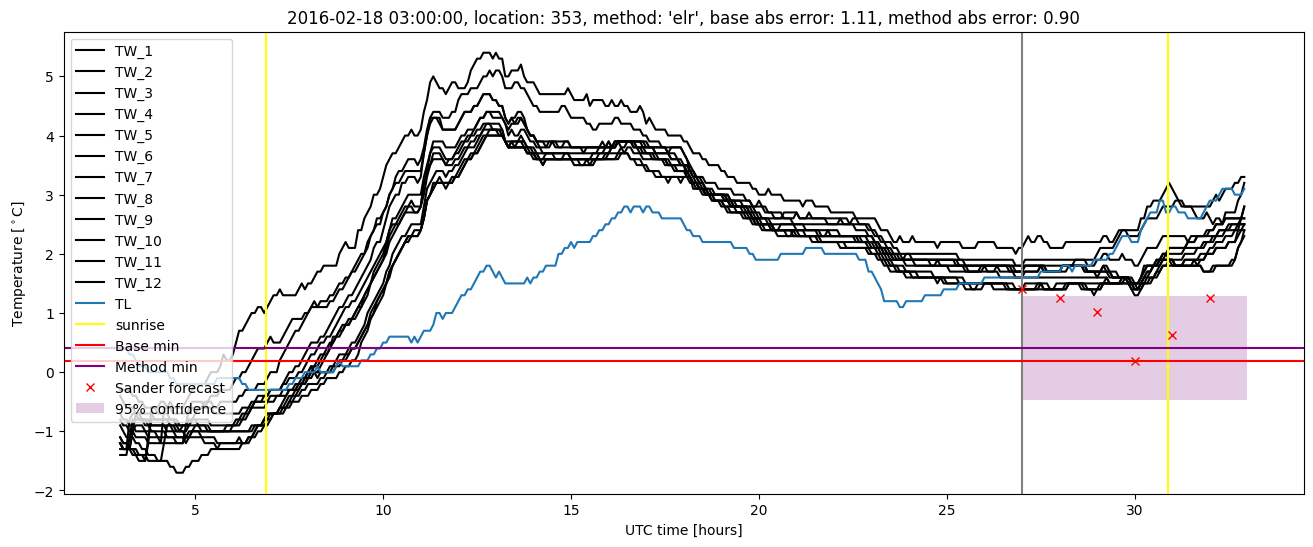
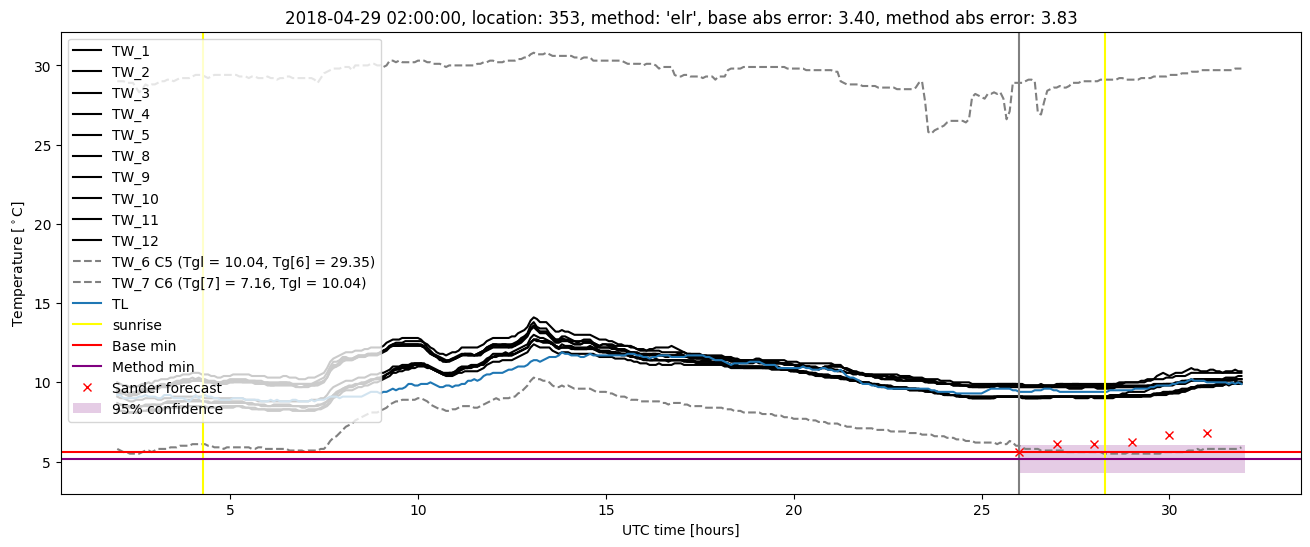
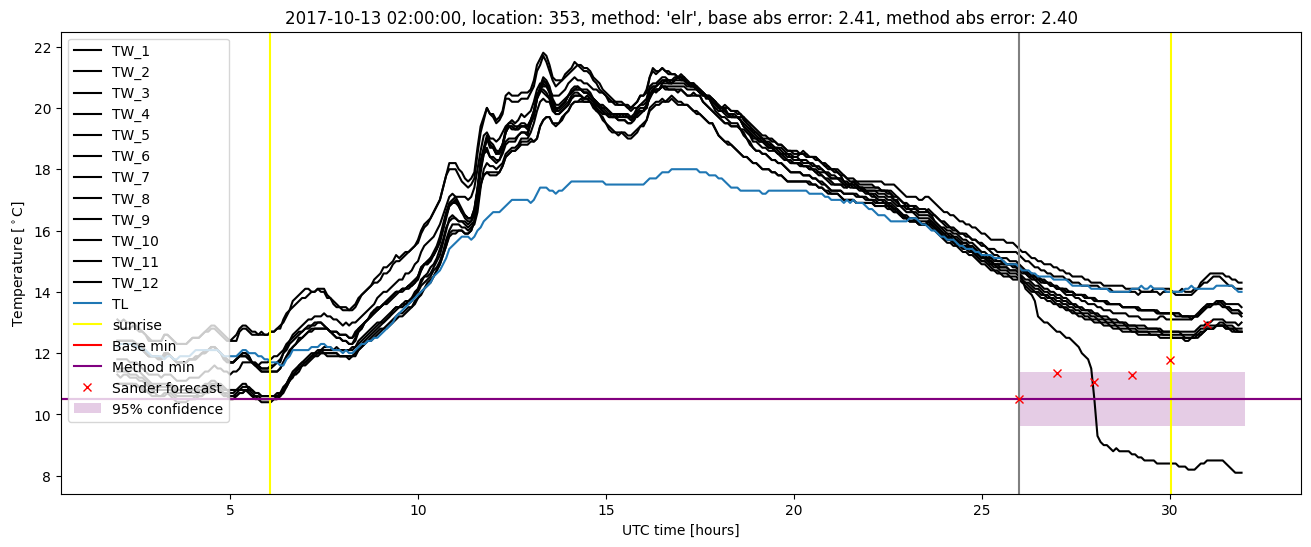
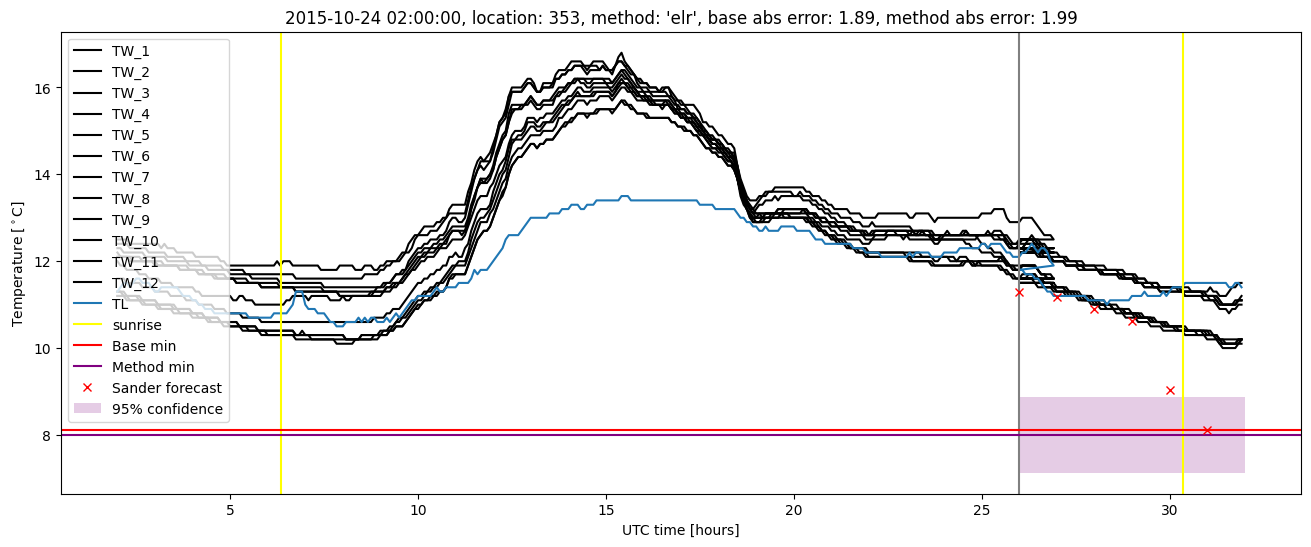
Extended logistic regression results
| names |
period |
power |
significance |
meanSquareError |
absError |
maxError |
CRPS |
IGN |
| baseline |
winter 2016 |
0.995 |
0.048 |
0.328 |
0.434 |
1.920 |
NaN |
NaN |
| elr |
winter 2016 |
0.995 |
0.048 |
0.307 |
0.414 |
1.993 |
0.547 |
4.499 |
| baseline |
winter 2017 |
0.975 |
0.031 |
0.307 |
0.423 |
1.863 |
NaN |
NaN |
| elr |
winter 2017 |
0.975 |
0.000e+00 |
0.281 |
0.398 |
1.891 |
0.511 |
3.394 |
| baseline |
winter 2018 |
1.000 |
0.000e+00 |
0.354 |
0.407 |
3.397 |
NaN |
NaN |
| elr |
winter 2018 |
1.000 |
0.000e+00 |
0.357 |
0.389 |
3.826 |
0.554 |
4.601 |
| baseline |
winter 2019 |
0.993 |
0.059 |
0.305 |
0.407 |
1.680 |
NaN |
NaN |
| elr |
winter 2019 |
0.993 |
0.059 |
0.342 |
0.425 |
1.815 |
0.514 |
3.721 |
| baseline |
all |
0.991 |
0.032 |
0.324 |
0.419 |
3.397 |
NaN |
NaN |
| elr |
all |
0.991 |
0.021 |
0.321 |
0.408 |
3.826 |
0.533 |
4.082 |
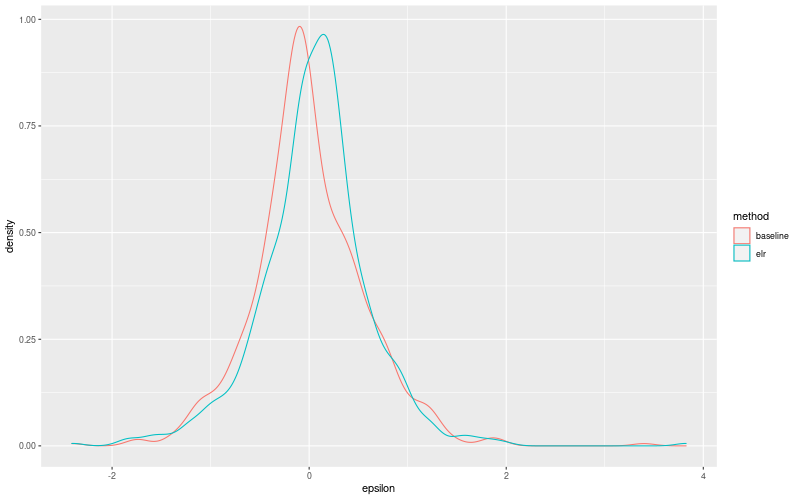
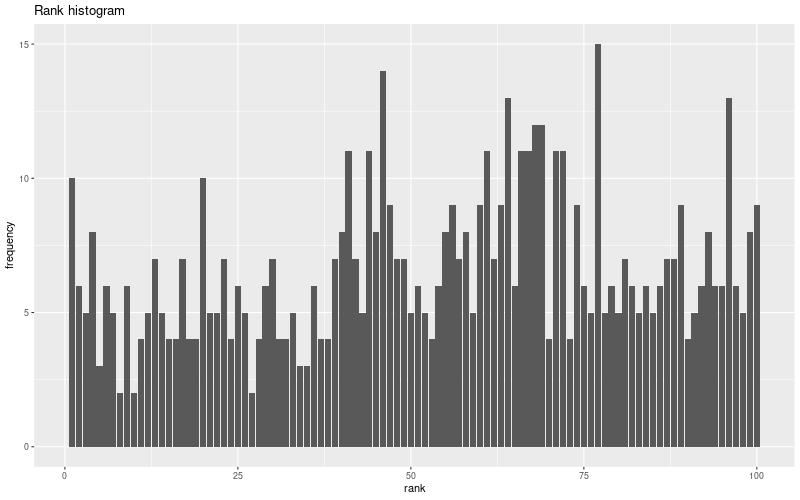
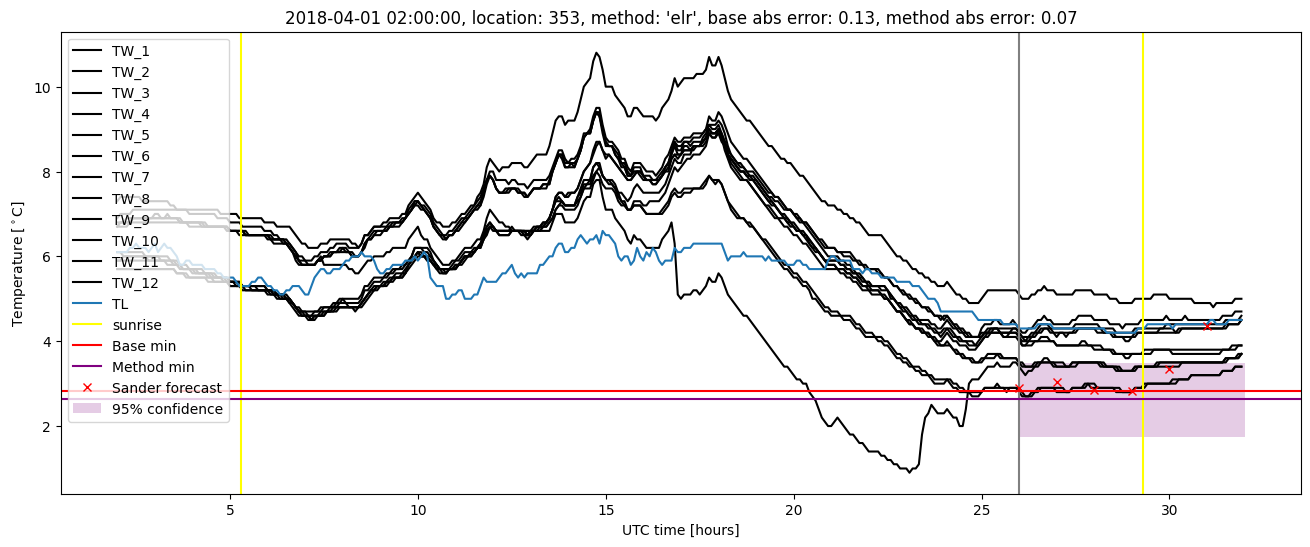
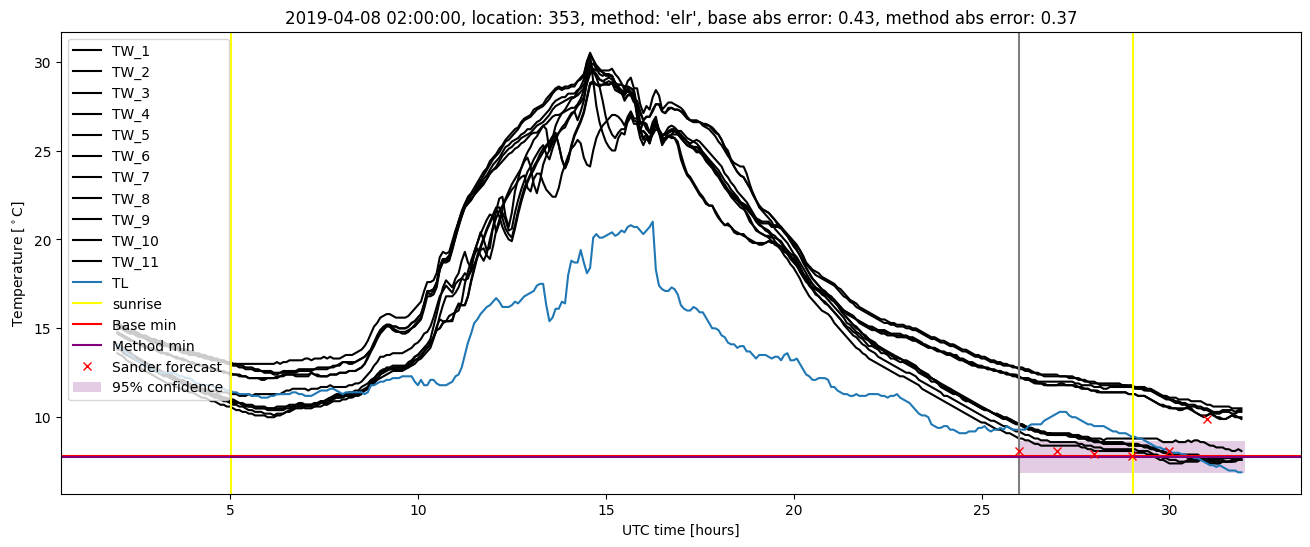
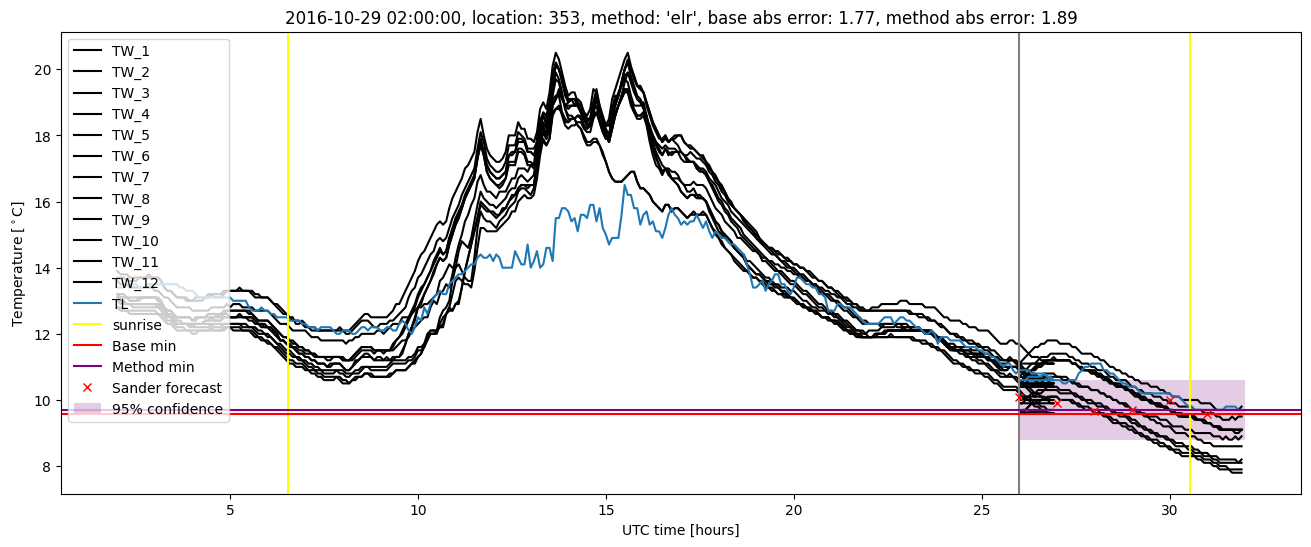
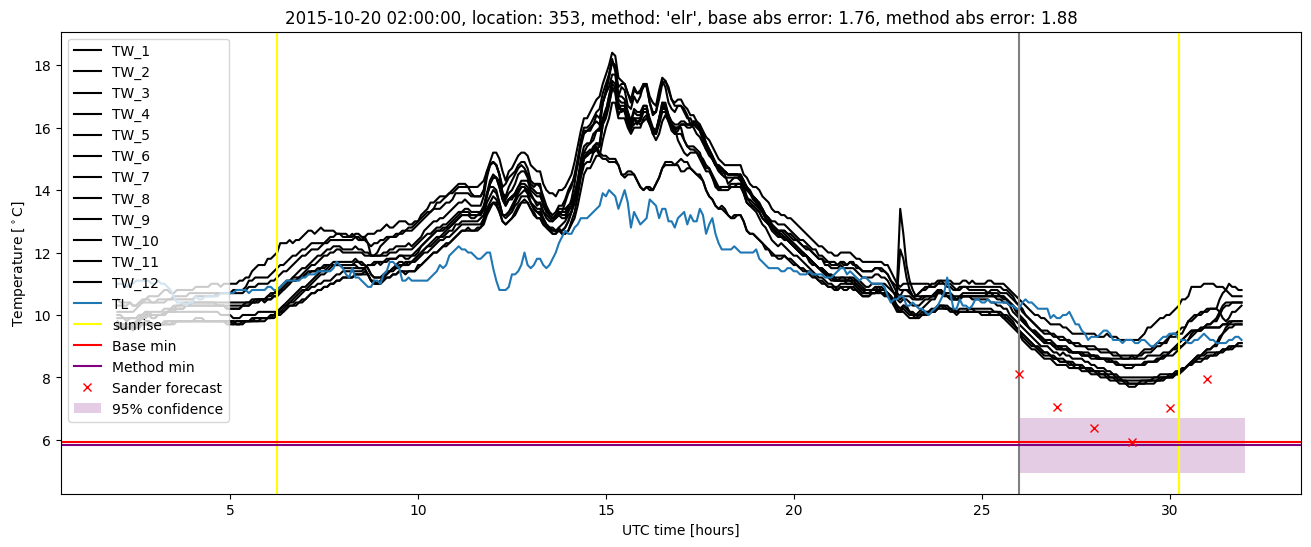
Extended logistic regression plots