GMS location: 352
Random forest results
| names |
period |
power |
significance |
meanSquareError |
absError |
maxError |
CRPS |
IGN |
| baseline |
winter 2016 |
0.995 |
0.000e+00 |
0.356 |
0.462 |
1.630 |
NaN |
NaN |
| forest |
winter 2016 |
1.000 |
0.062 |
0.264 |
0.385 |
1.687 |
0.437 |
4.850 |
| baseline |
winter 2017 |
0.960 |
0.037 |
0.347 |
0.453 |
2.529 |
NaN |
NaN |
| forest |
winter 2017 |
0.984 |
0.000e+00 |
0.247 |
0.372 |
1.974 |
0.456 |
5.796 |
| baseline |
winter 2018 |
0.982 |
0.000e+00 |
0.281 |
0.404 |
1.765 |
NaN |
NaN |
| forest |
winter 2018 |
0.982 |
0.000e+00 |
0.199 |
0.330 |
1.425 |
0.450 |
4.489 |
| baseline |
winter 2019 |
0.987 |
0.000e+00 |
0.262 |
0.378 |
1.586 |
NaN |
NaN |
| forest |
winter 2019 |
0.993 |
0.182 |
0.201 |
0.340 |
1.521 |
0.437 |
4.344 |
| baseline |
all |
0.983 |
0.013 |
0.315 |
0.427 |
2.529 |
NaN |
NaN |
| forest |
all |
0.991 |
0.038 |
0.231 |
0.359 |
1.974 |
0.444 |
4.871 |
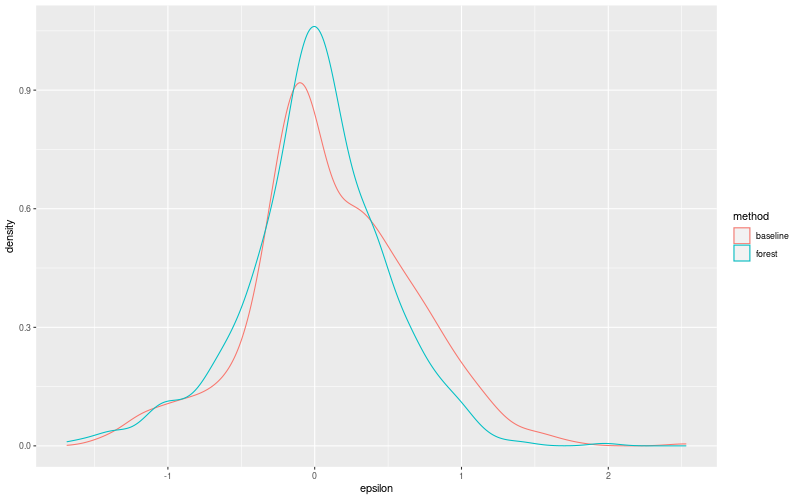
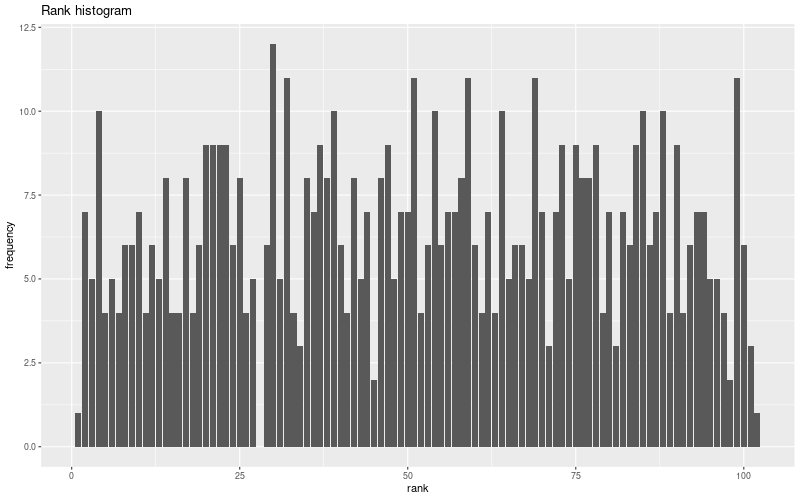
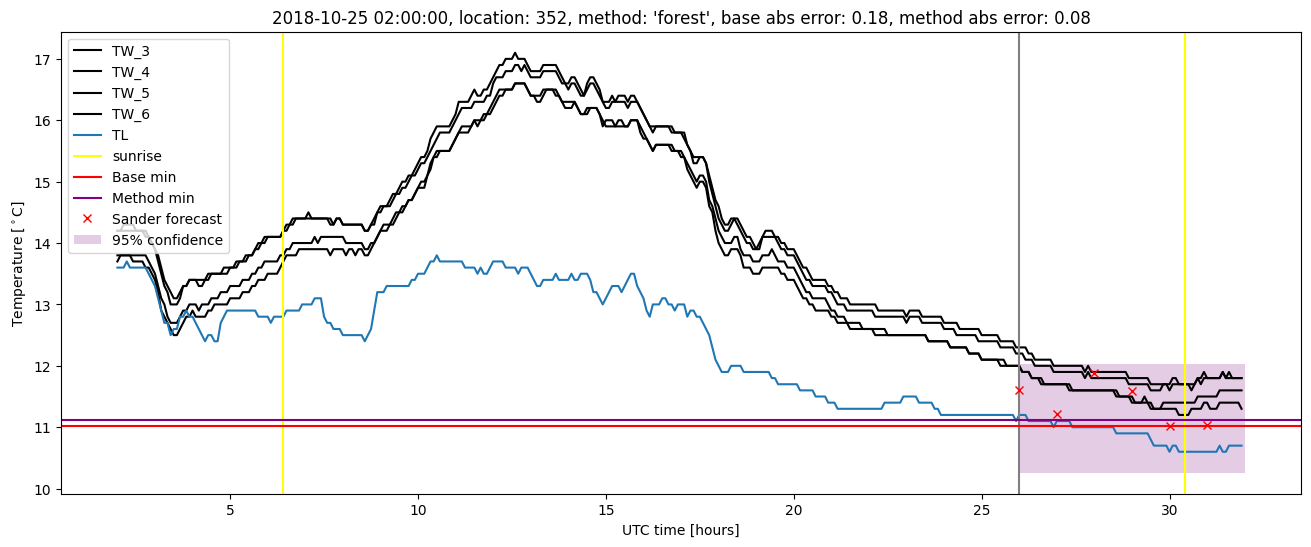
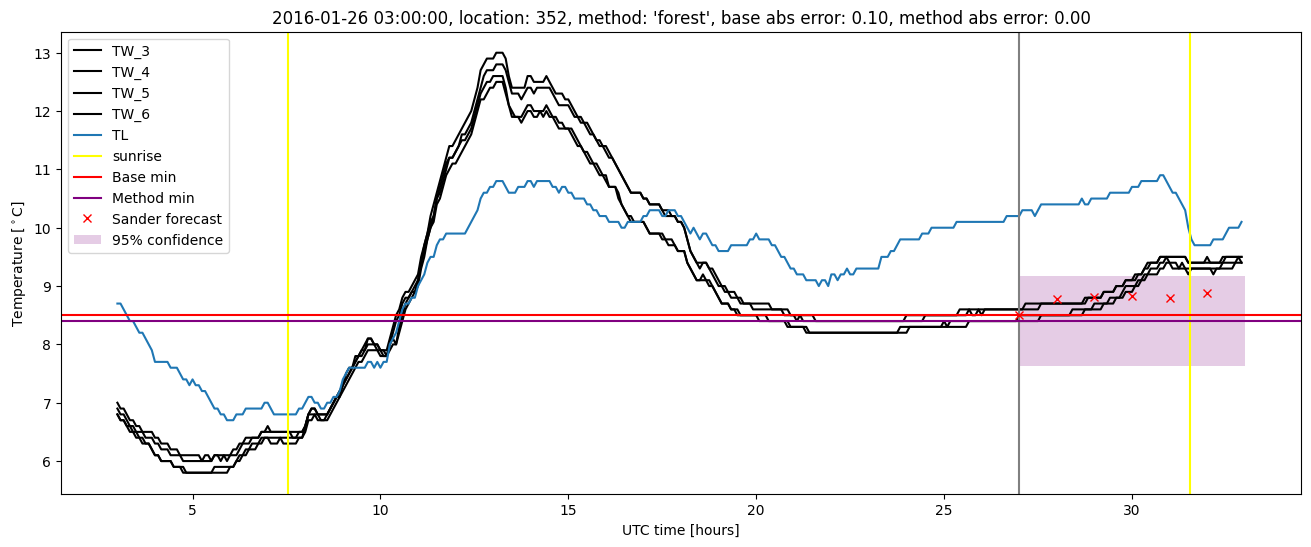
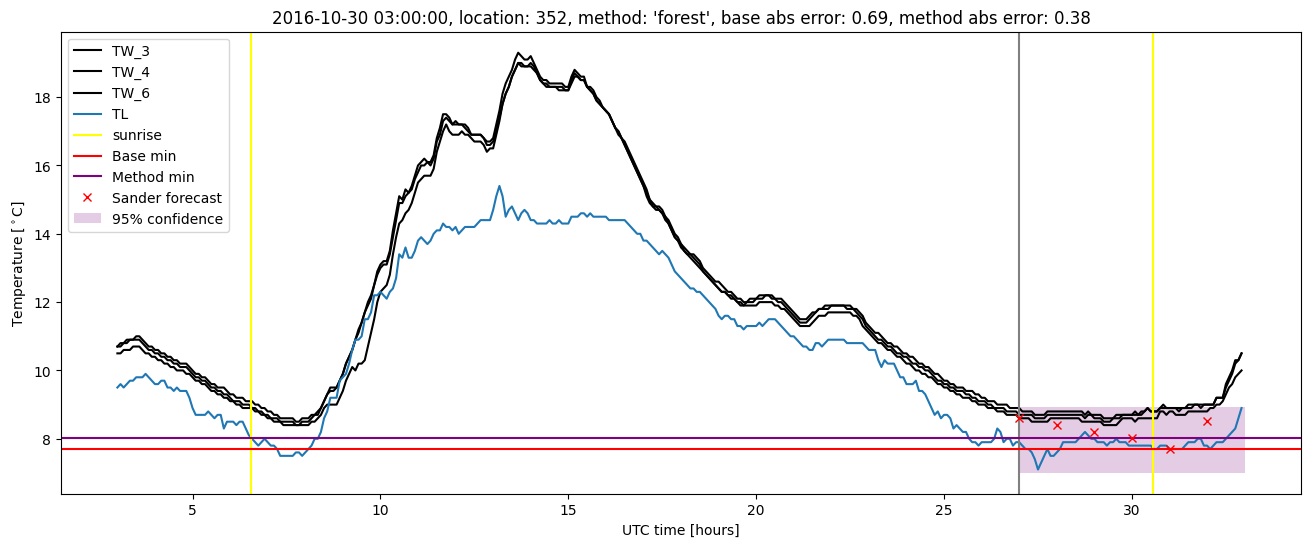
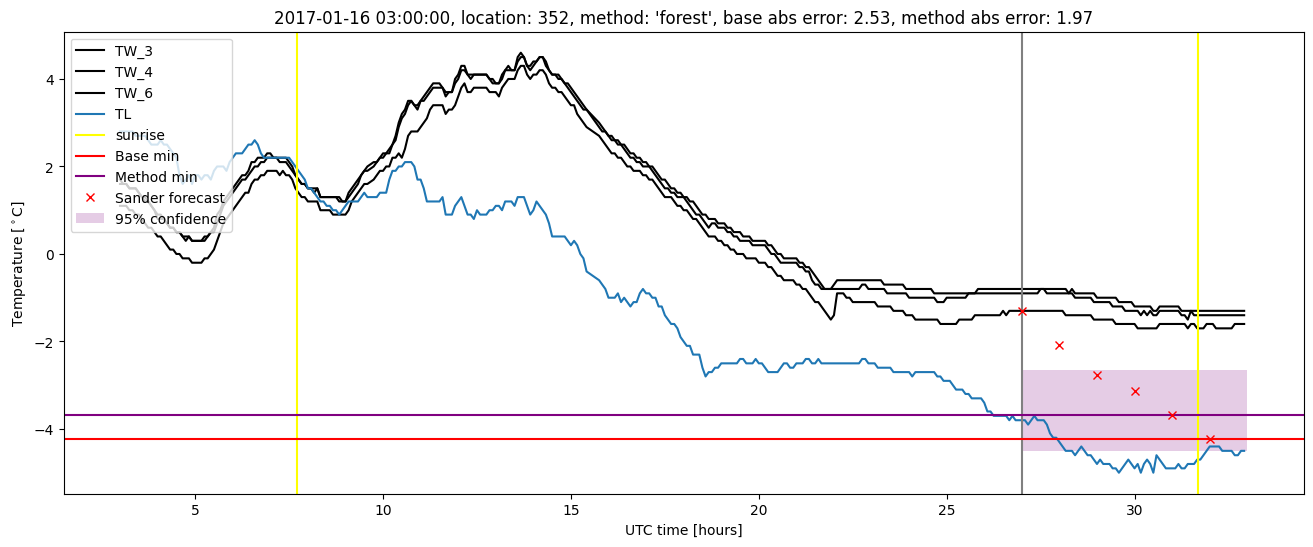
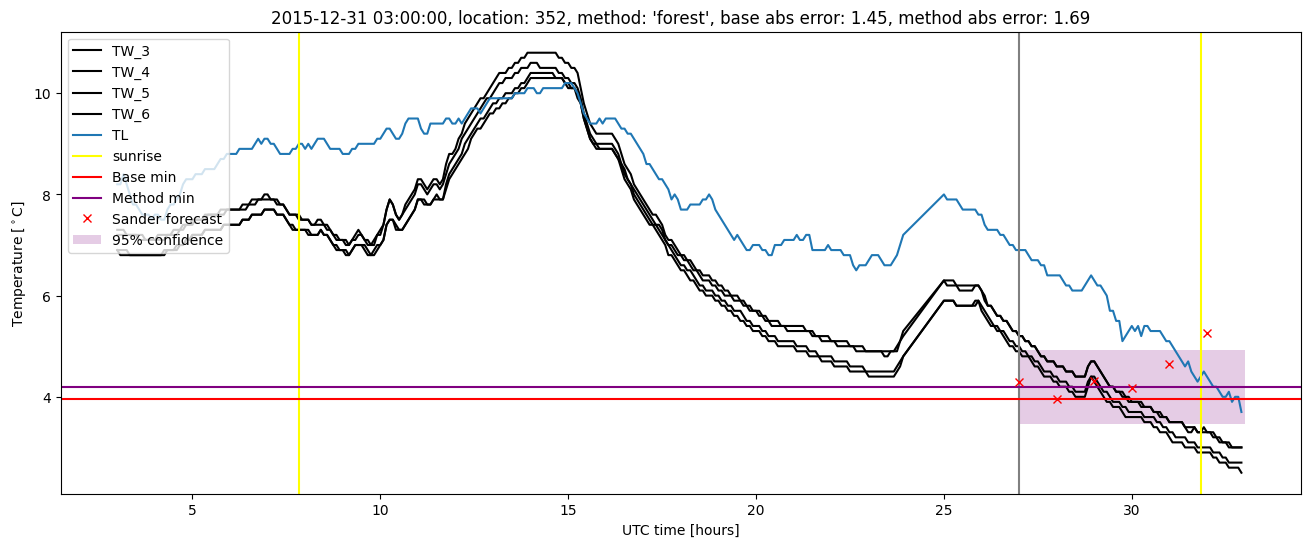
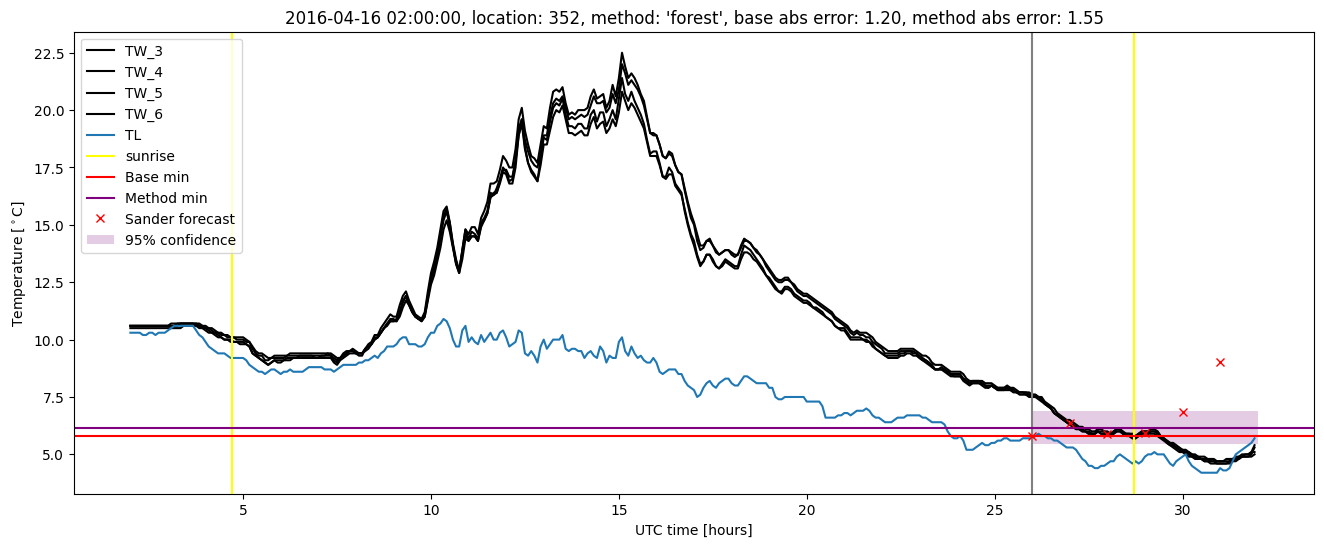
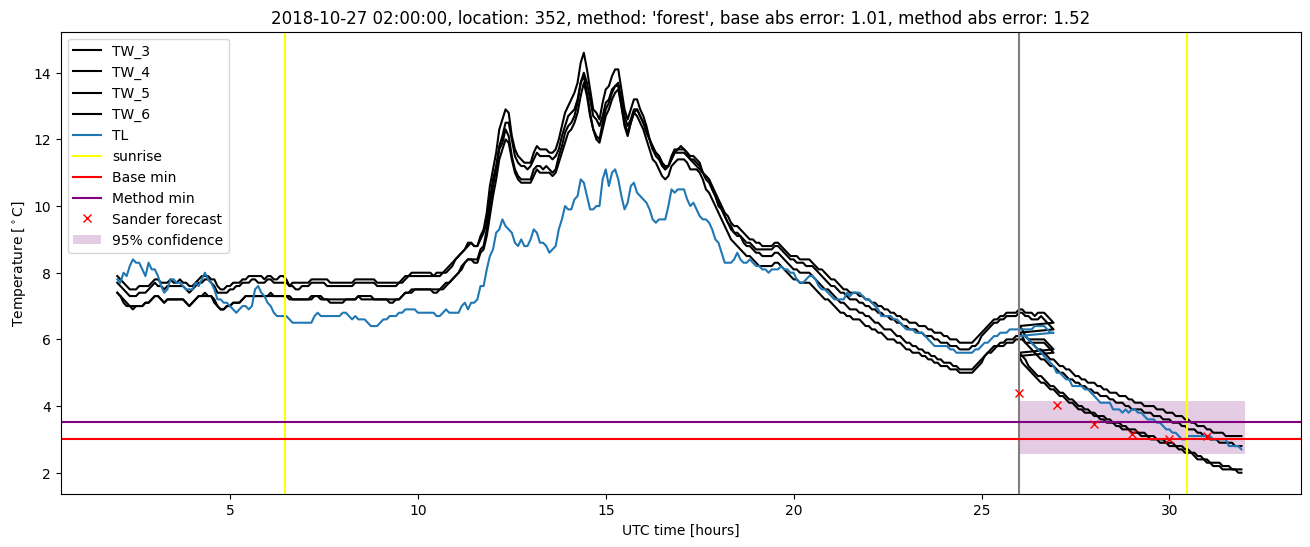
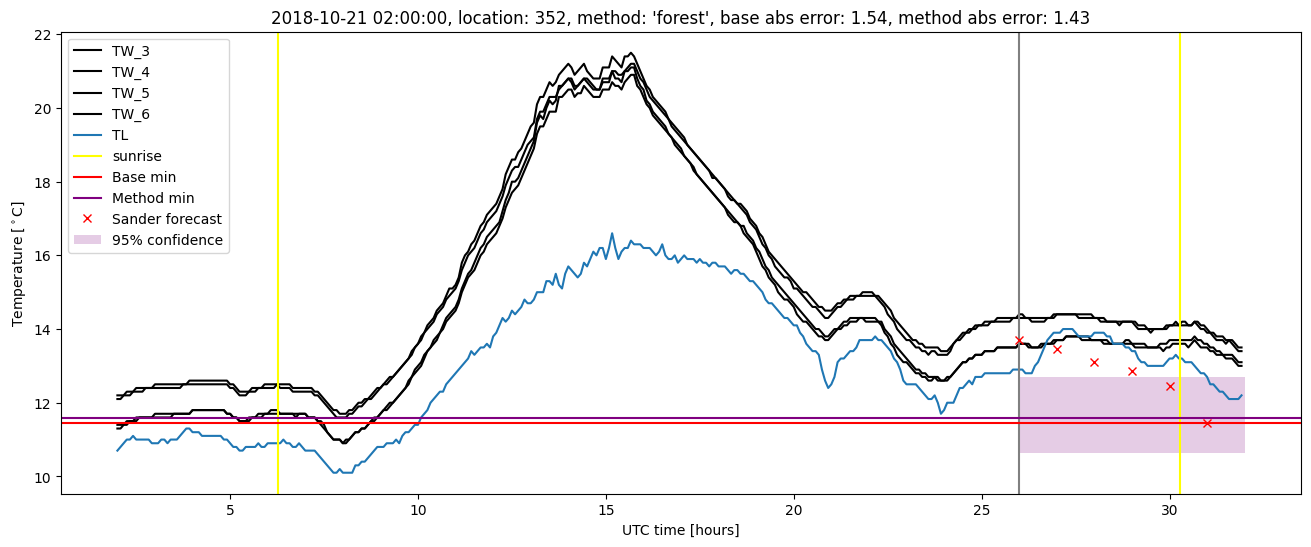
Random forest plots
Extended logistic regression results
| names |
period |
power |
significance |
meanSquareError |
absError |
maxError |
CRPS |
IGN |
| baseline |
winter 2016 |
0.995 |
0.000e+00 |
0.356 |
0.462 |
1.630 |
NaN |
NaN |
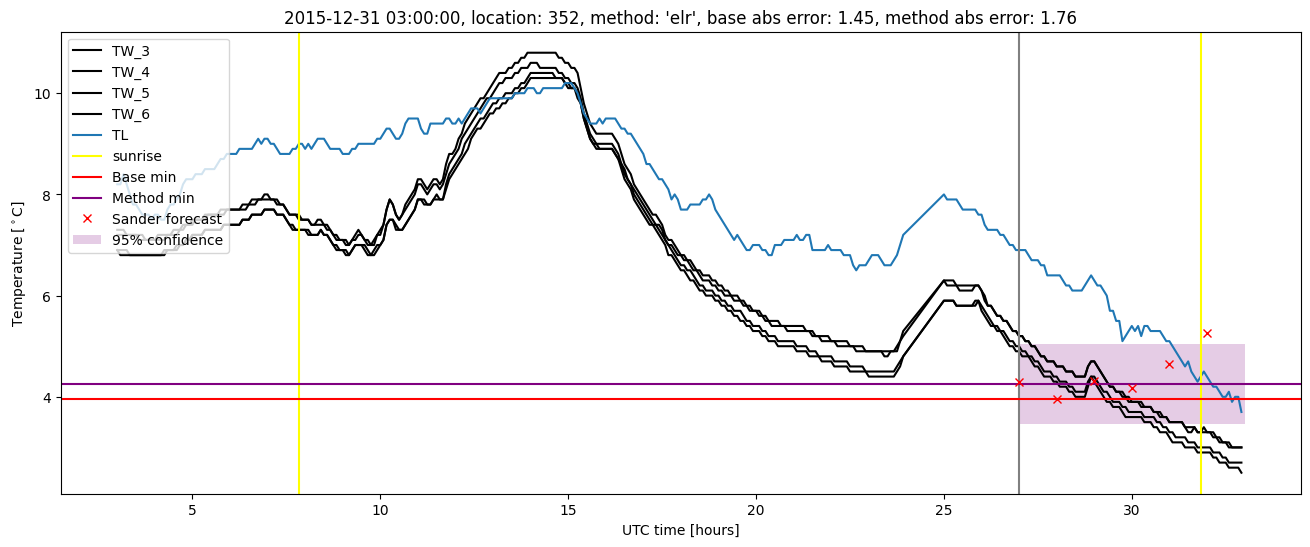
| elr |
winter 2016 |
1.000 |
0.000e+00 |
0.252 |
0.393 |
1.757 |
0.498 |
5.234 |
| baseline |
winter 2017 |
0.960 |
0.037 |
0.347 |
0.453 |
2.529 |
NaN |
NaN |
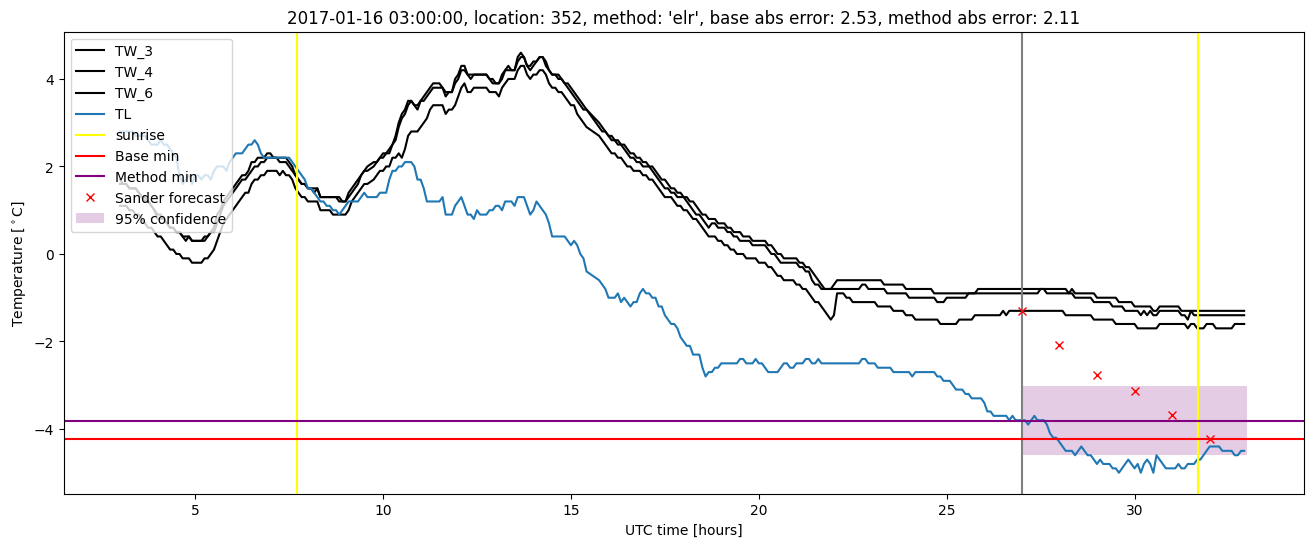
| elr |
winter 2017 |
0.976 |
0.037 |
0.262 |
0.391 |
2.110 |
0.511 |
5.845 |
| baseline |
winter 2018 |
0.982 |
0.000e+00 |
0.281 |
0.404 |
1.765 |
NaN |
NaN |
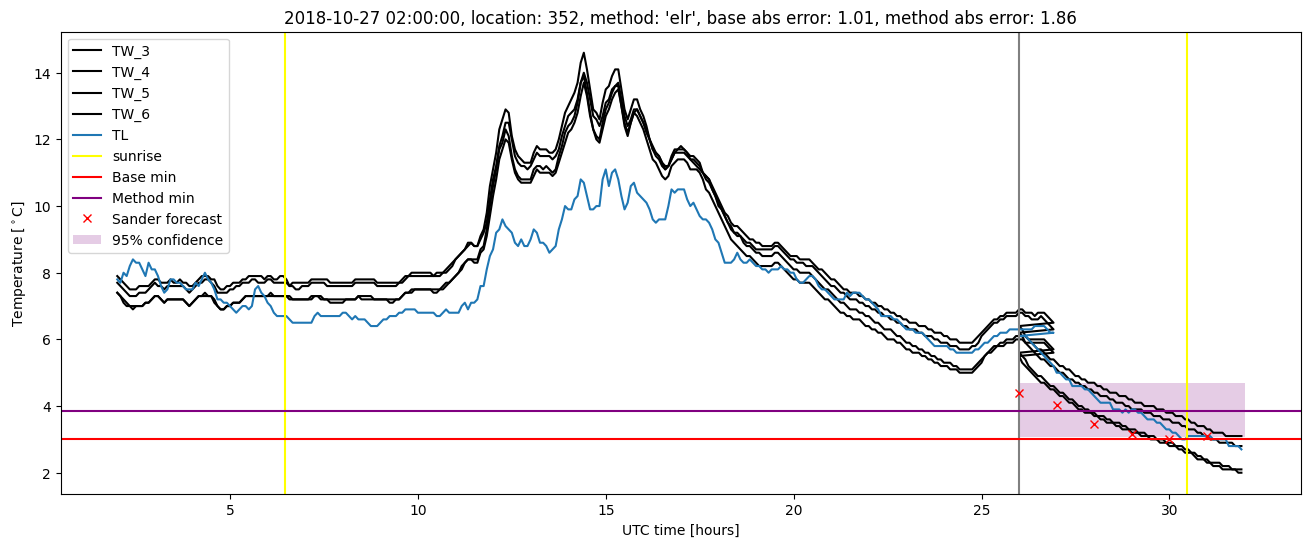
| elr |
winter 2018 |
0.982 |
0.080 |
0.240 |
0.393 |
1.446 |
0.525 |
5.299 |
| baseline |
winter 2019 |
0.987 |
0.000e+00 |
0.262 |
0.378 |
1.586 |
NaN |
NaN |
| elr |
winter 2019 |
0.980 |
0.091 |
0.200 |
0.342 |
1.864 |
0.518 |
5.159 |
| baseline |
all |
0.983 |
0.013 |
0.315 |
0.427 |
2.529 |
NaN |
NaN |
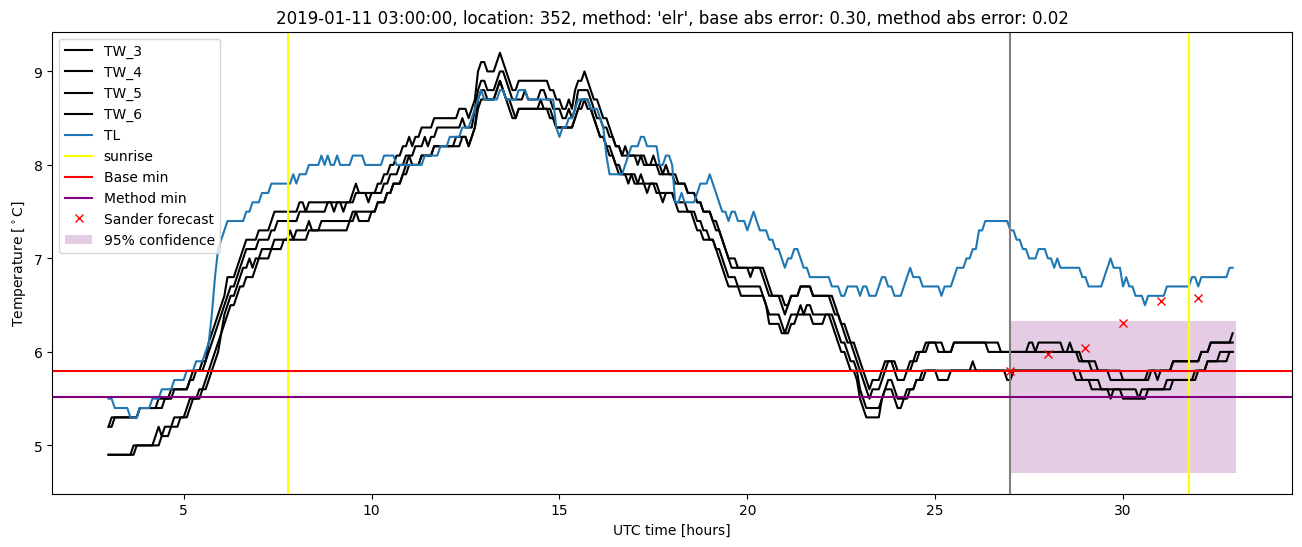
| elr |
all |
0.986 |
0.051 |
0.239 |
0.380 |
2.110 |
0.512 |
5.371 |
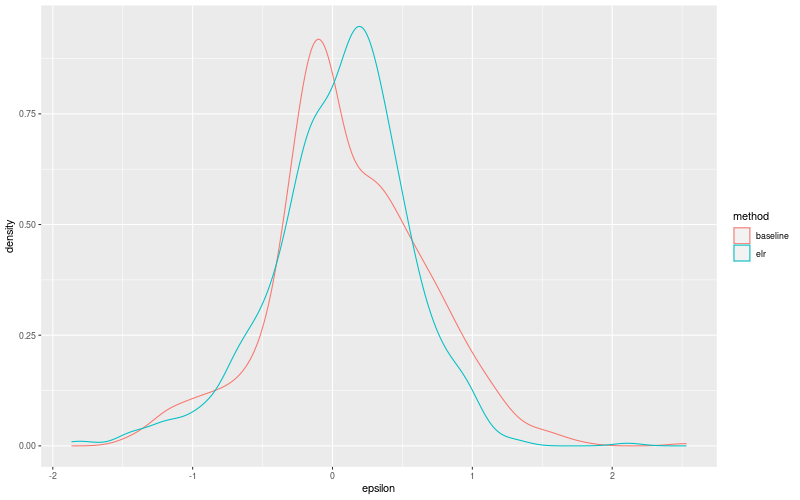
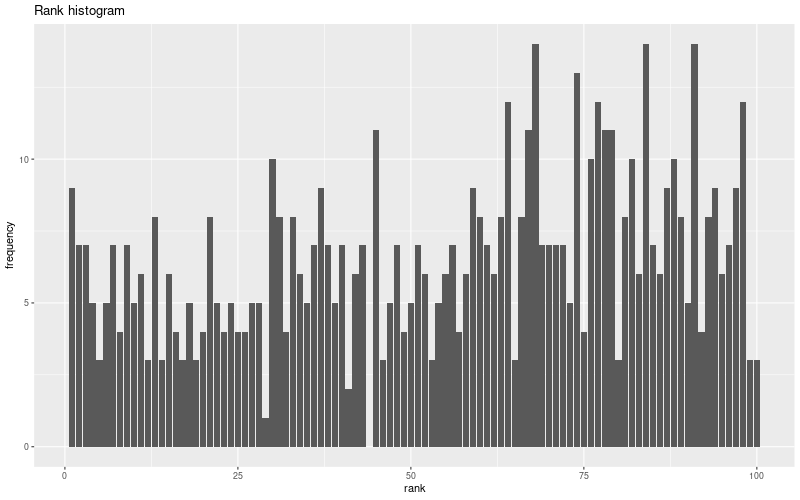
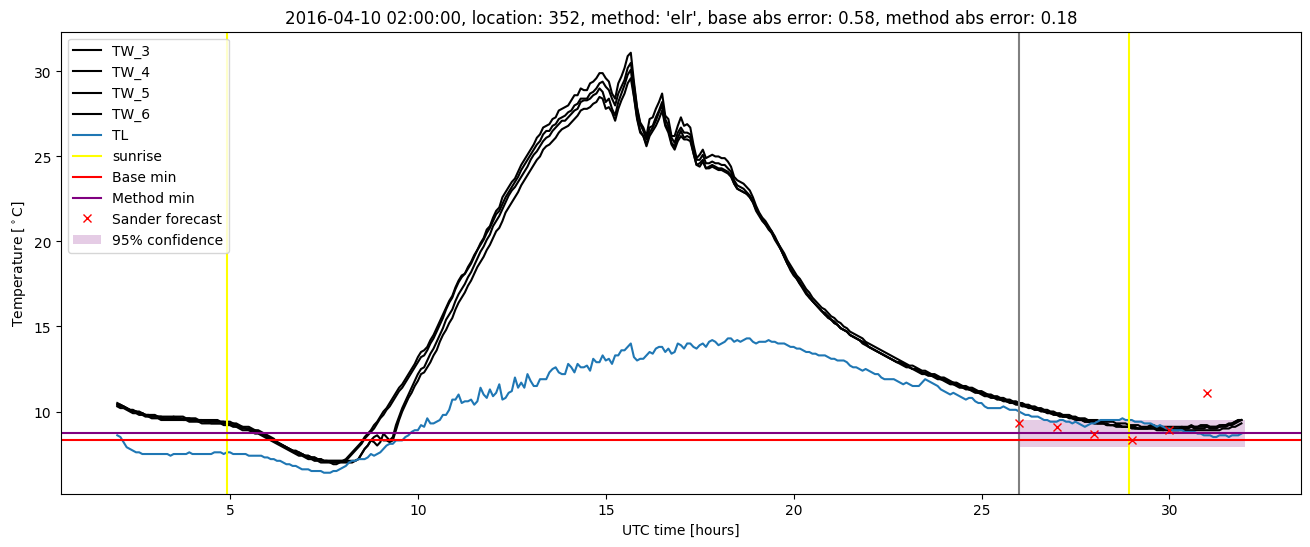
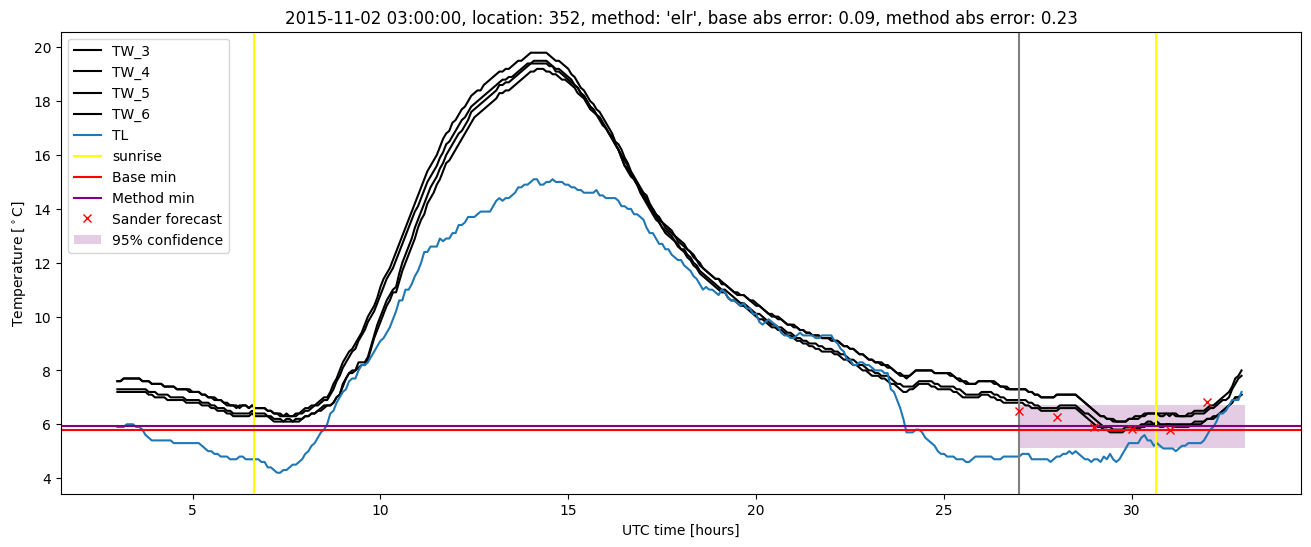
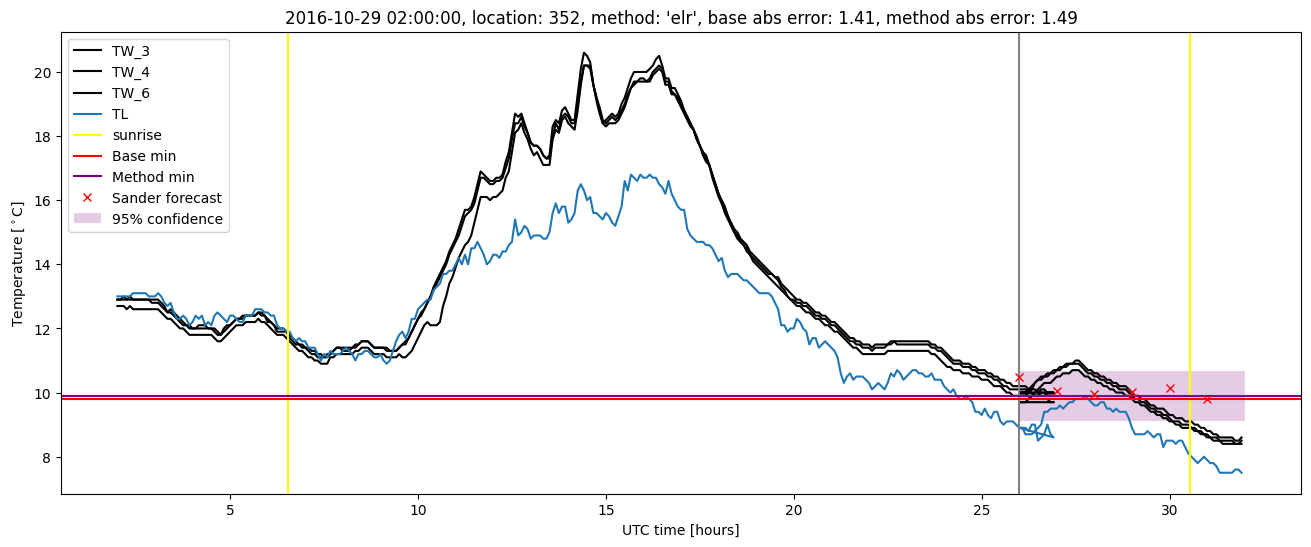
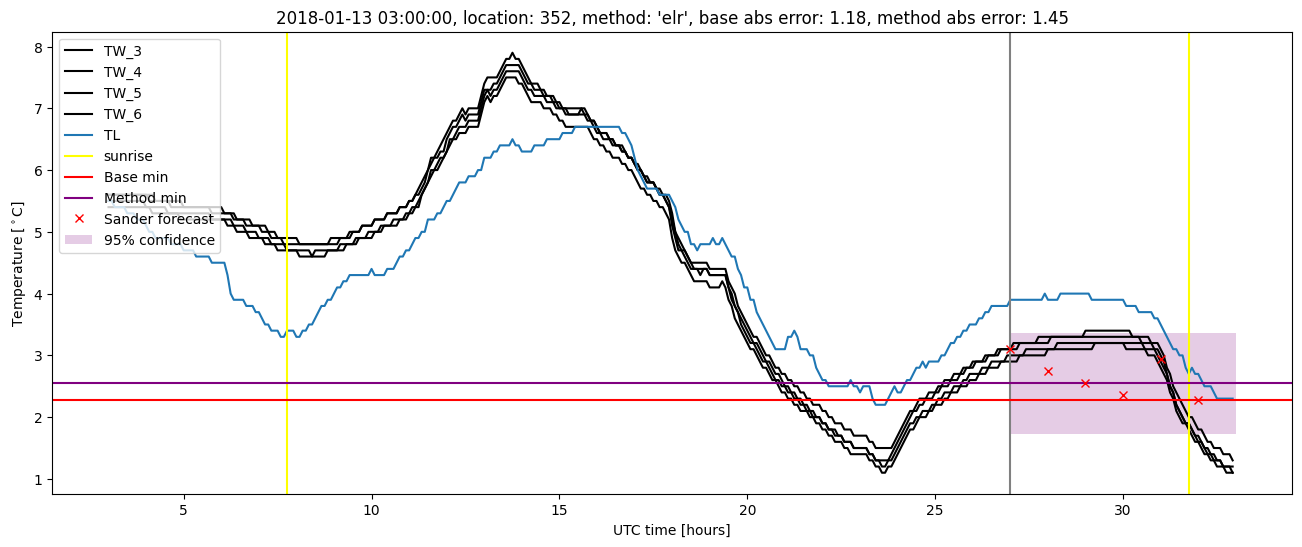
Extended logistic regression plots