GMS location: 351
Random forest results
| names |
period |
power |
significance |
meanSquareError |
absError |
maxError |
CRPS |
IGN |
| baseline |
winter 2016 |
1.000 |
0.000e+00 |
0.359 |
0.481 |
1.922 |
NaN |
NaN |
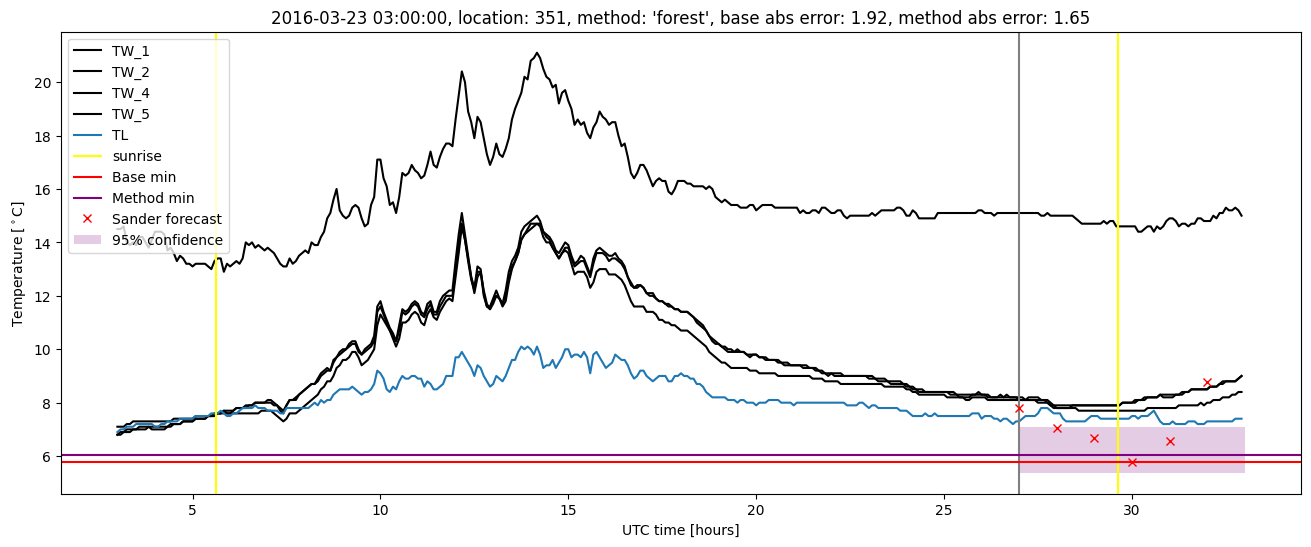
| forest |
winter 2016 |
1.000 |
0.000e+00 |
0.236 |
0.371 |
1.648 |
0.423 |
5.193 |
| baseline |
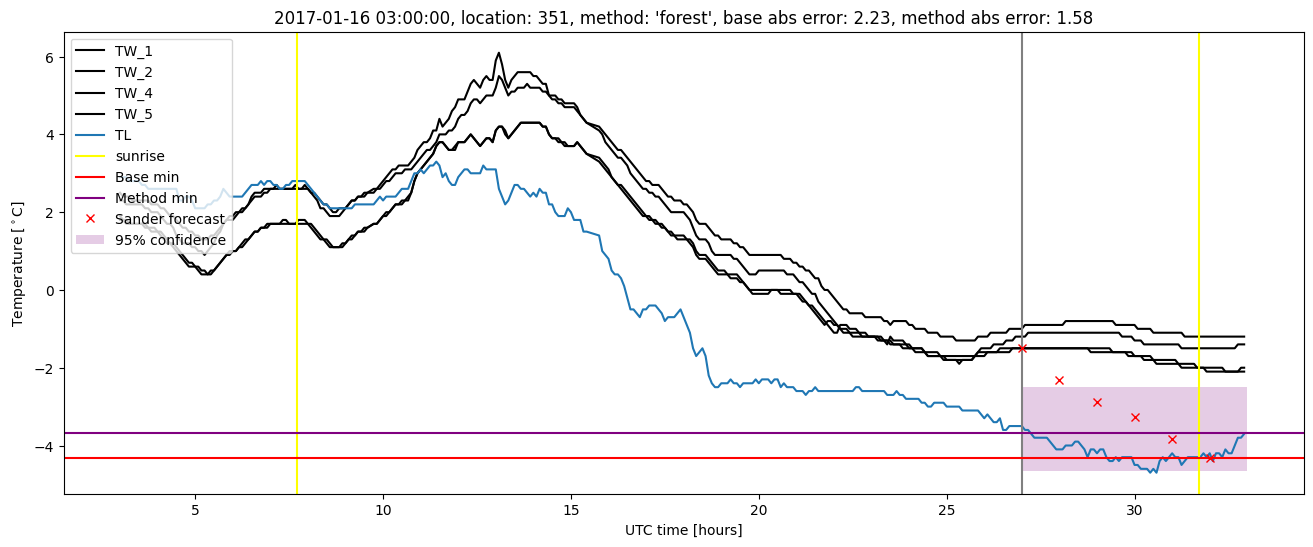
winter 2017 |
0.984 |
0.042 |
0.320 |
0.428 |
2.230 |
NaN |
NaN |
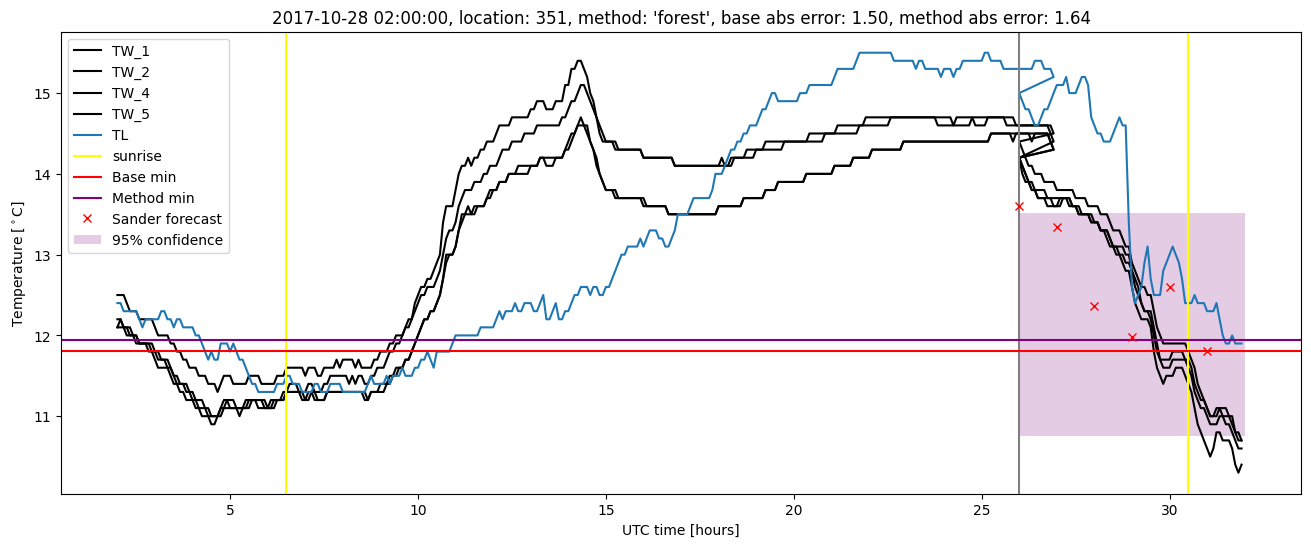
| forest |
winter 2017 |
0.992 |
0.042 |
0.203 |
0.336 |
1.580 |
0.440 |
4.545 |
| baseline |
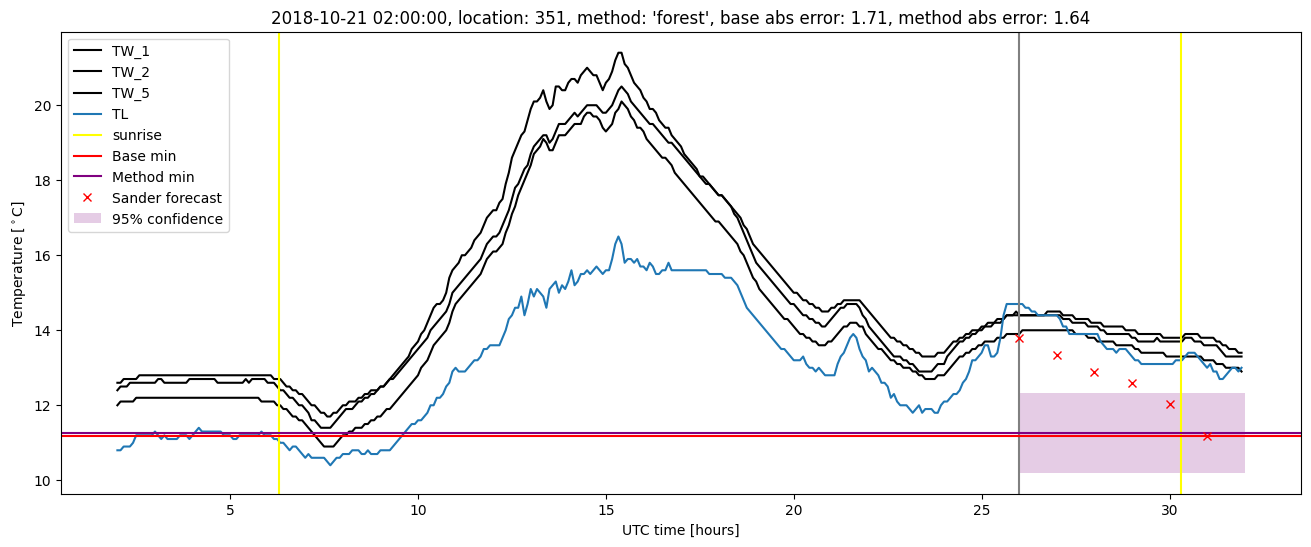
winter 2018 |
0.991 |
0.056 |
0.378 |
0.478 |
1.835 |
NaN |
NaN |
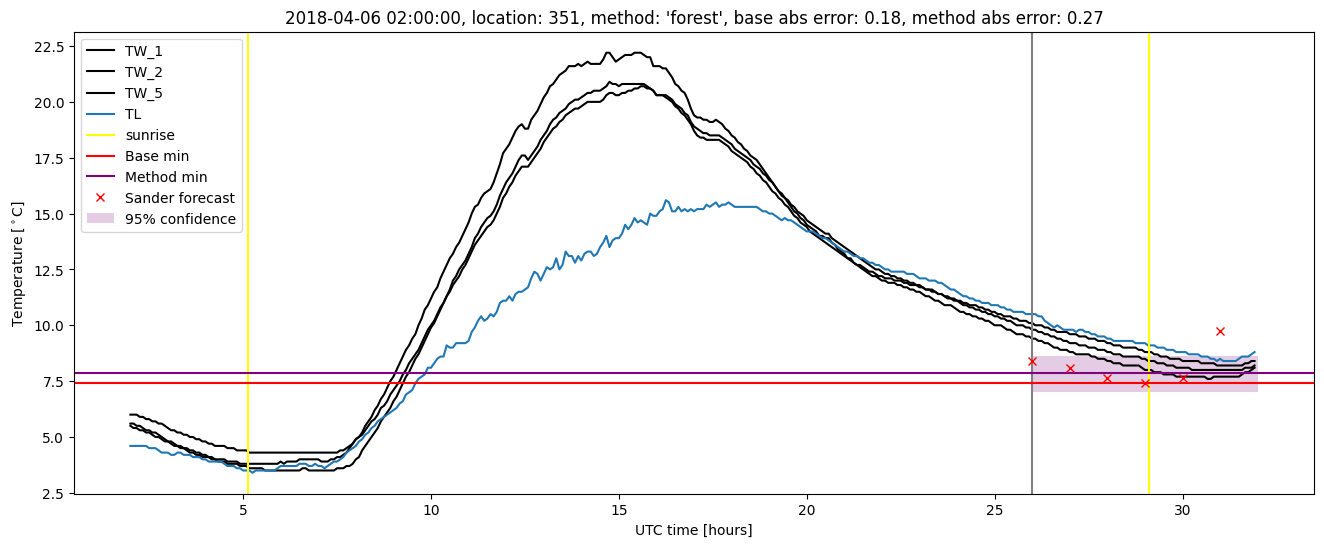
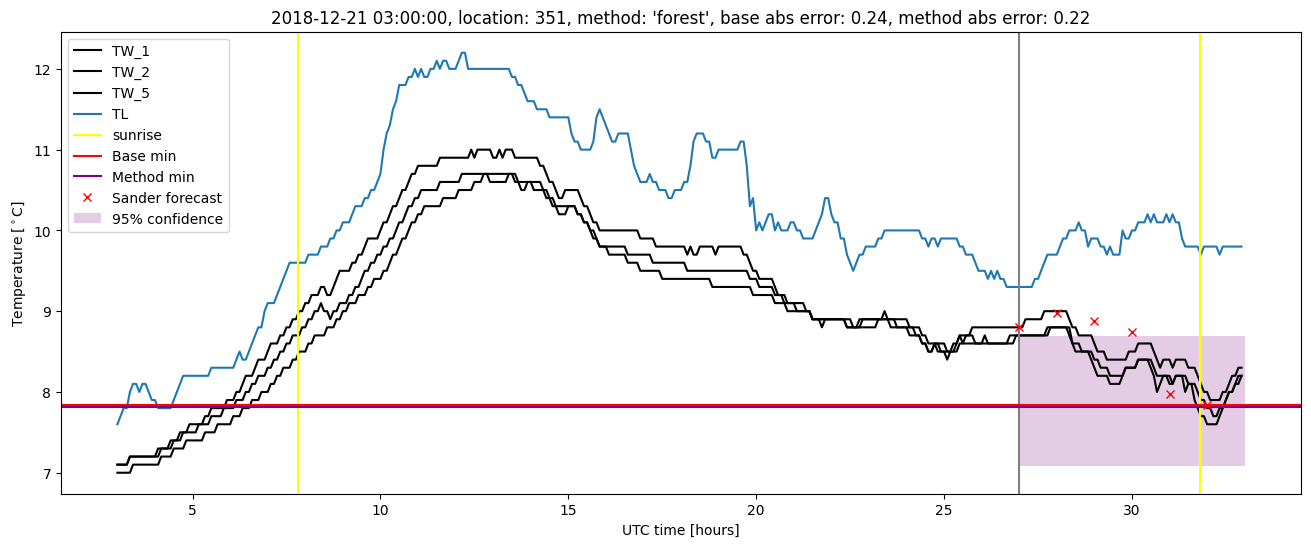
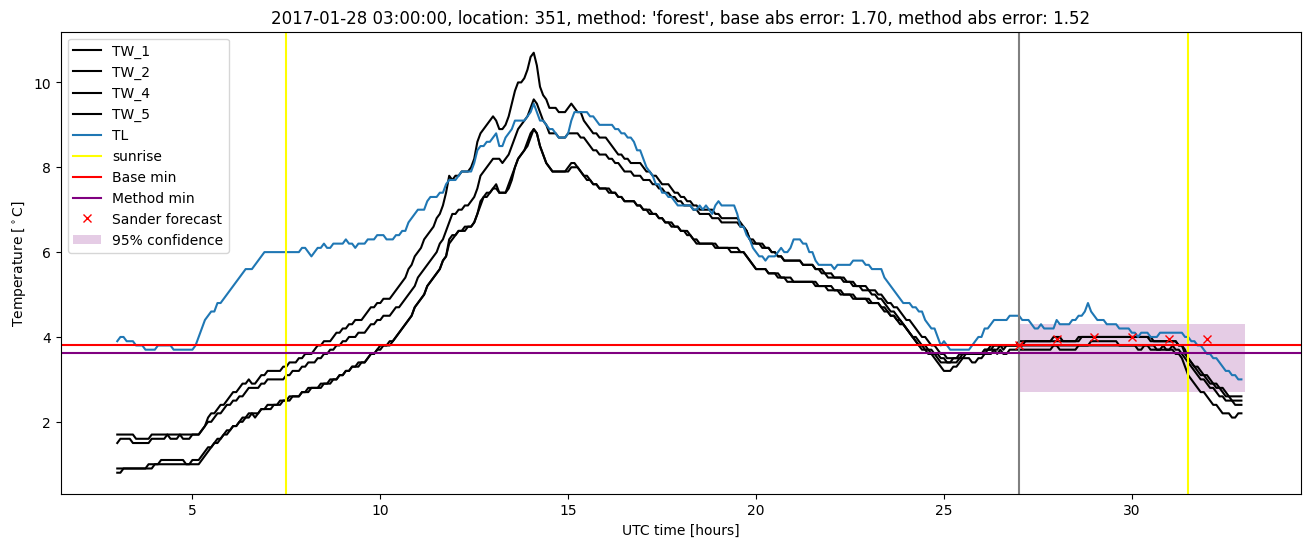
| forest |
winter 2018 |
1.000 |
0.056 |
0.225 |
0.362 |
1.638 |
0.416 |
2.703 |
| baseline |
winter 2019 |
0.986 |
0.000e+00 |
0.321 |
0.431 |
1.842 |
NaN |
NaN |
| forest |
winter 2019 |
0.979 |
0.000e+00 |
0.215 |
0.353 |
1.637 |
0.433 |
3.458 |
| baseline |
all |
0.991 |
0.030 |
0.344 |
0.455 |
2.230 |
NaN |
NaN |
| forest |
all |
0.993 |
0.030 |
0.221 |
0.356 |
1.648 |
0.428 |
4.085 |
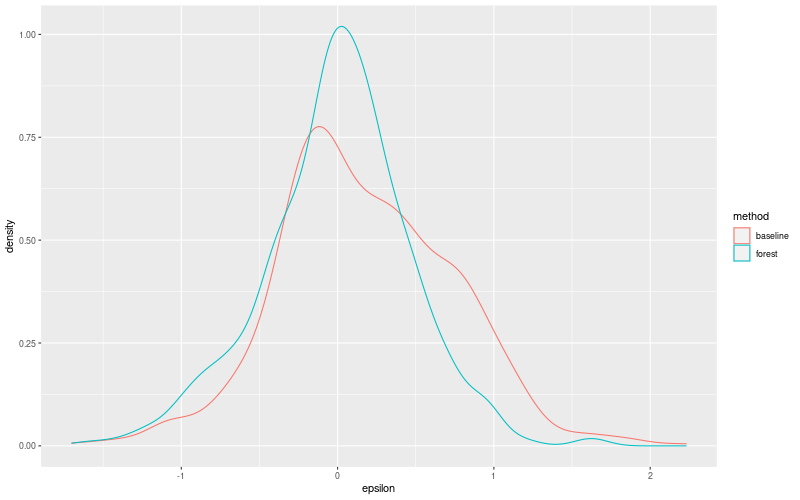
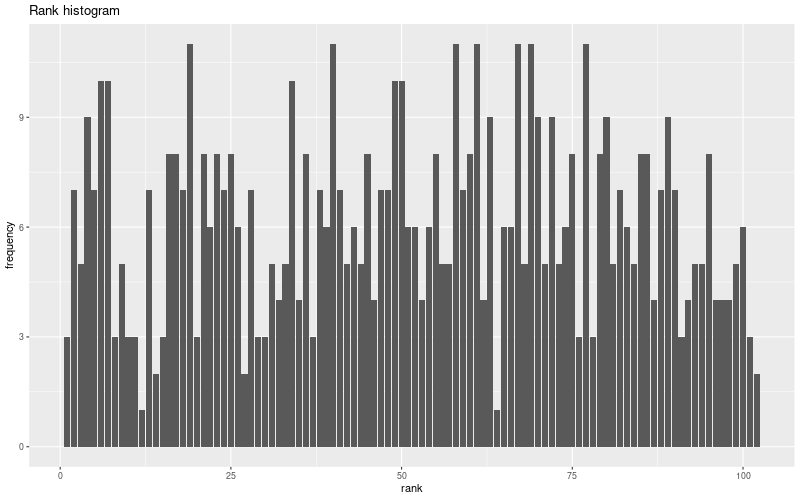
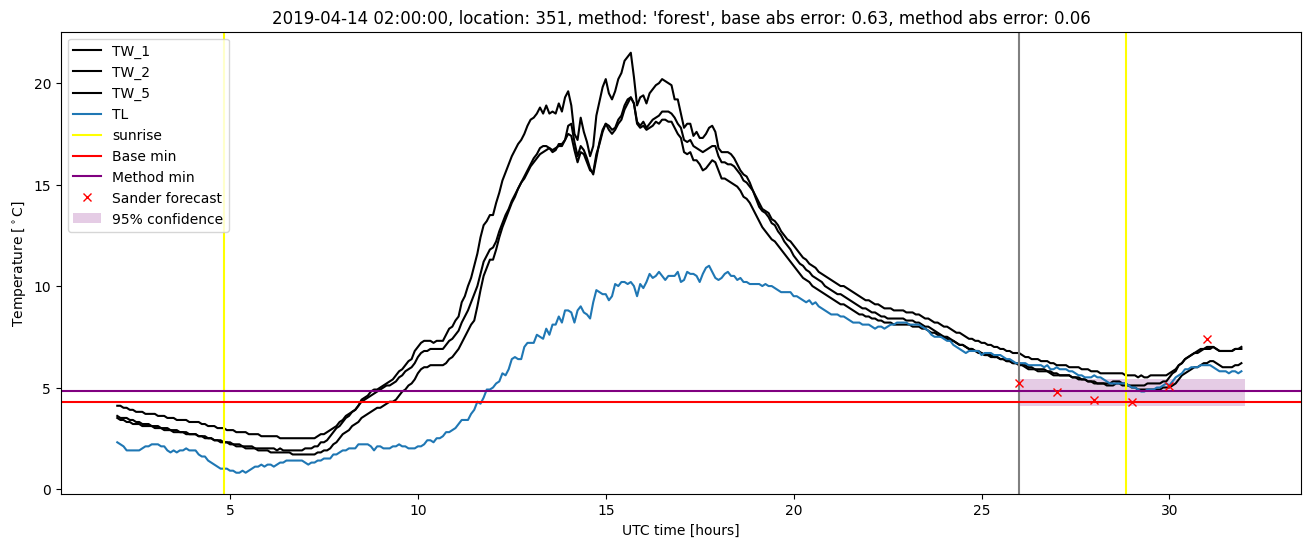
Random forest plots
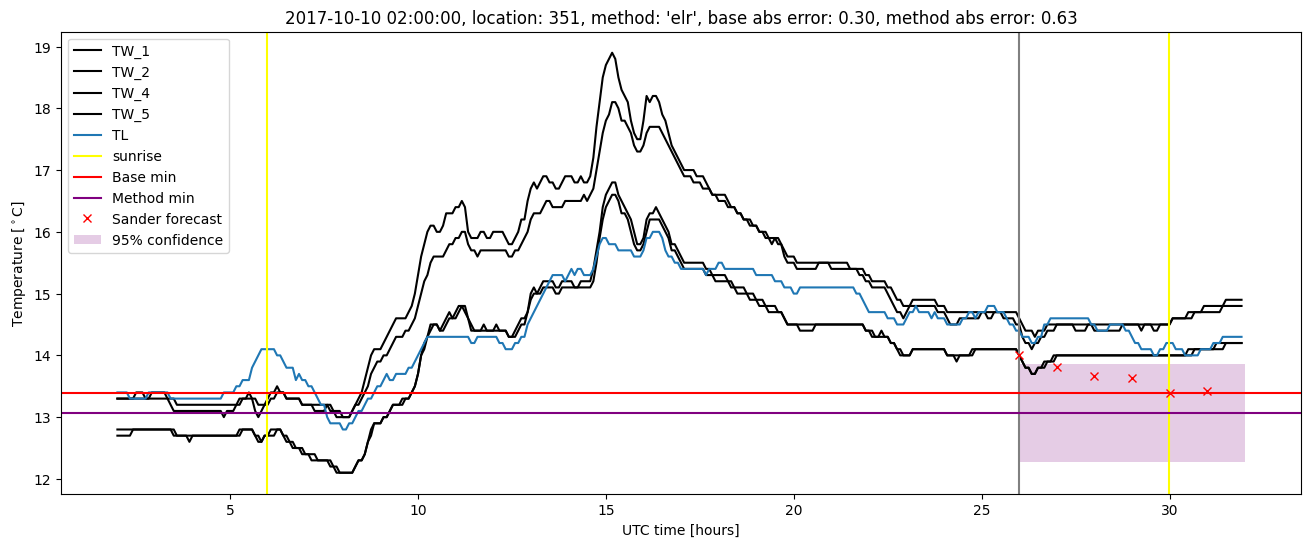
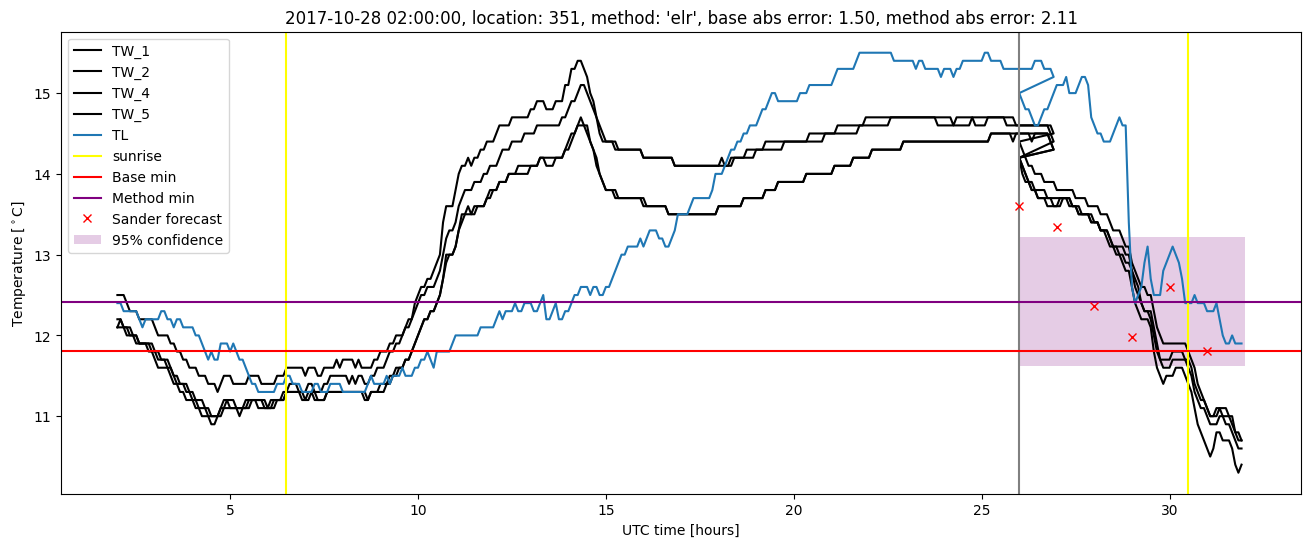
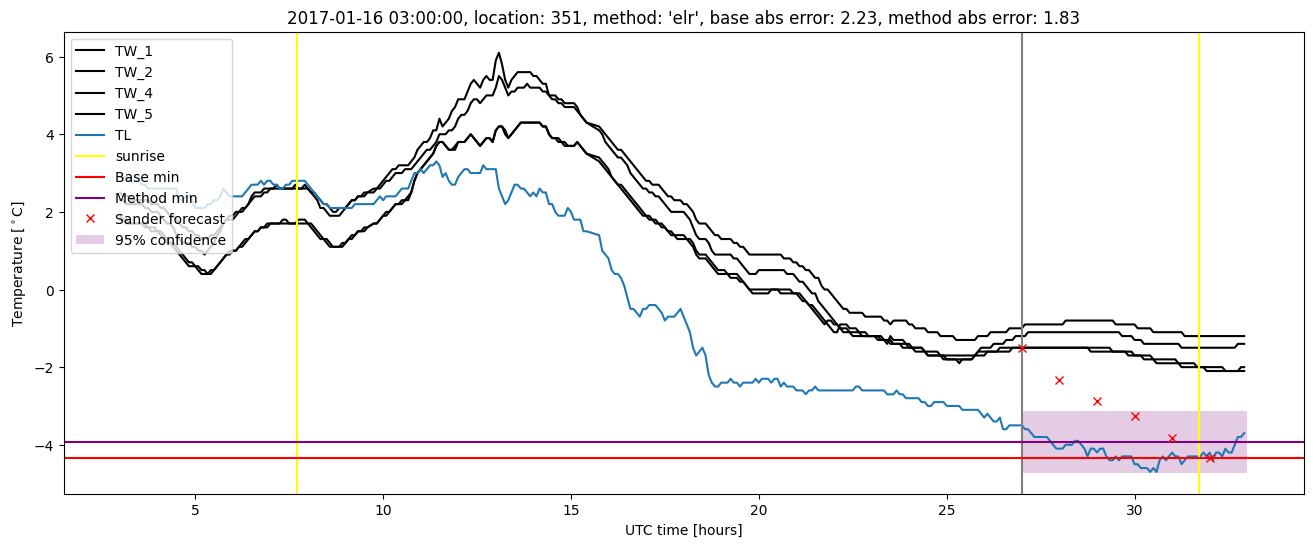
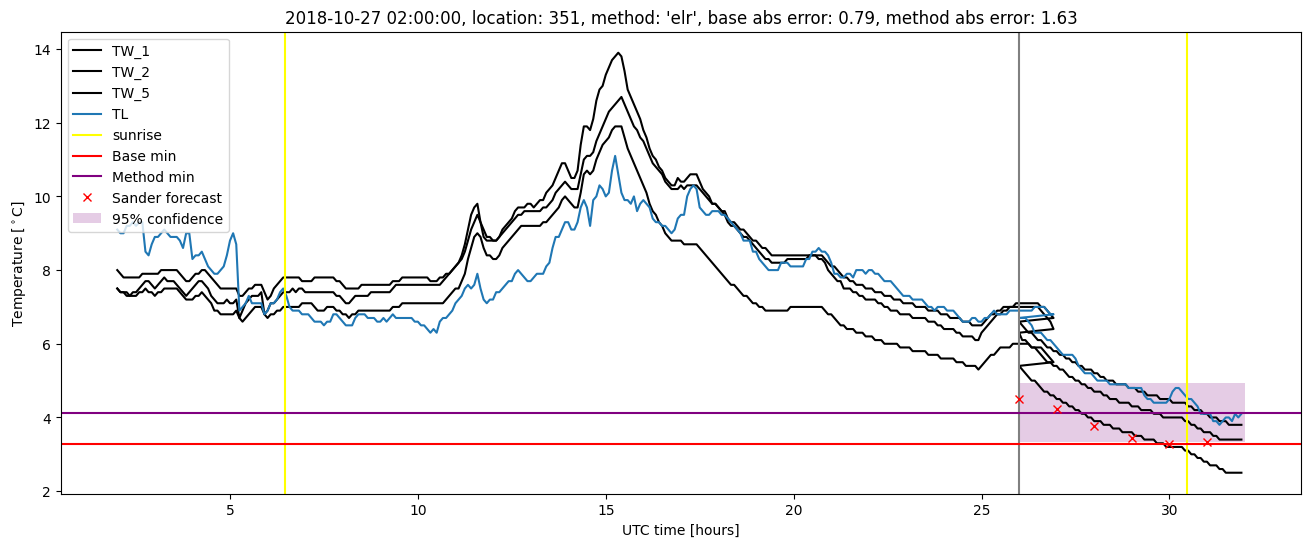
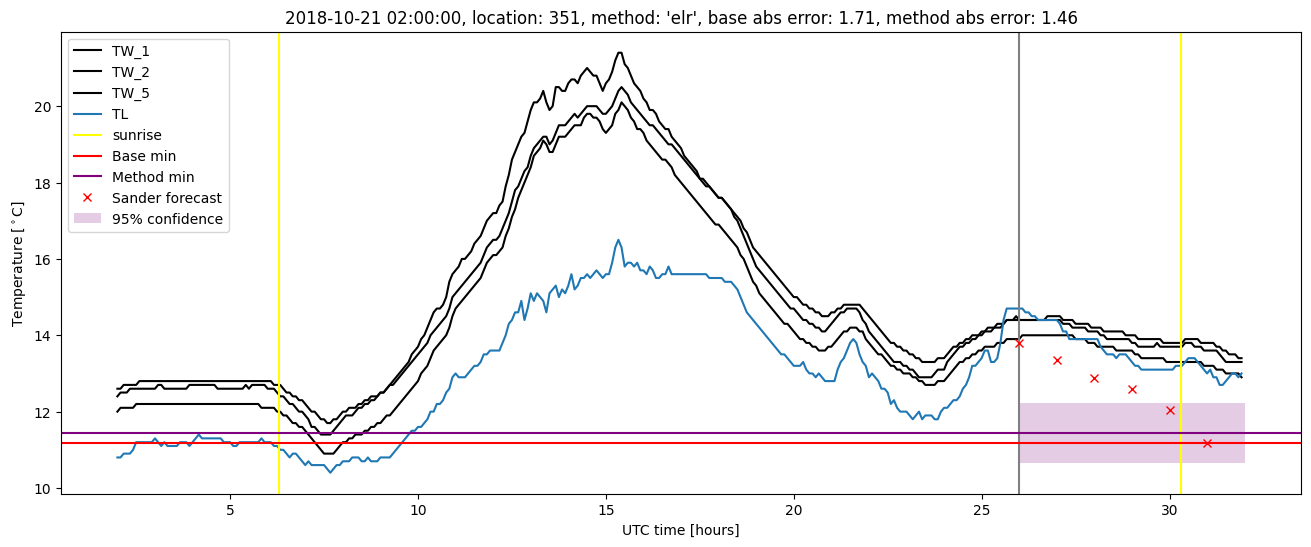
Extended logistic regression results
| names |
period |
power |
significance |
meanSquareError |
absError |
maxError |
CRPS |
IGN |
| baseline |
winter 2016 |
1.000 |
0.000e+00 |
0.359 |
0.481 |
1.922 |
NaN |
NaN |
| elr |
winter 2016 |
1.000 |
0.000e+00 |
0.227 |
0.387 |
1.379 |
0.492 |
5.158 |
| baseline |
winter 2017 |
0.984 |
0.042 |
0.320 |
0.428 |
2.230 |
NaN |
NaN |
| elr |
winter 2017 |
0.984 |
0.042 |
0.241 |
0.381 |
1.827 |
0.518 |
5.584 |
| baseline |
winter 2018 |
0.991 |
0.056 |
0.378 |
0.478 |
1.835 |
NaN |
NaN |
| elr |
winter 2018 |
1.000 |
0.056 |
0.228 |
0.374 |
2.112 |
0.482 |
4.643 |
| baseline |
winter 2019 |
0.986 |
0.000e+00 |
0.321 |
0.431 |
1.842 |
NaN |
NaN |
| elr |
winter 2019 |
0.986 |
0.000e+00 |
0.237 |
0.377 |
1.632 |
0.477 |
4.627 |
| baseline |
all |
0.991 |
0.030 |
0.344 |
0.455 |
2.230 |
NaN |
NaN |
| elr |
all |
0.993 |
0.030 |
0.233 |
0.381 |
2.112 |
0.492 |
5.021 |
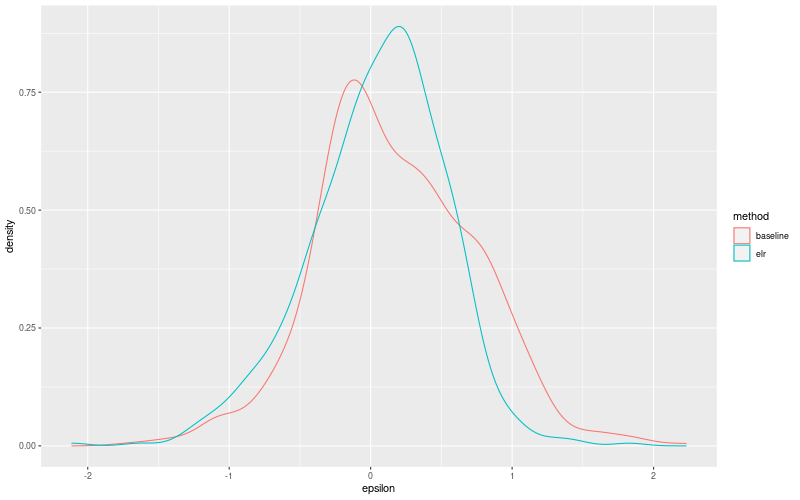
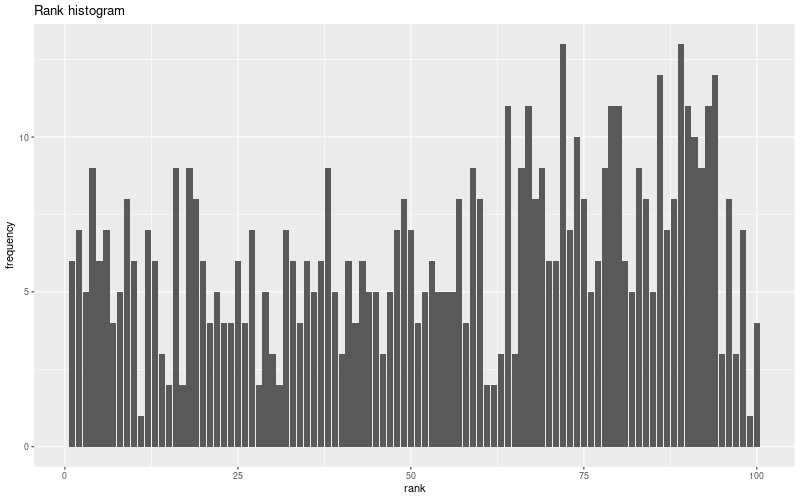
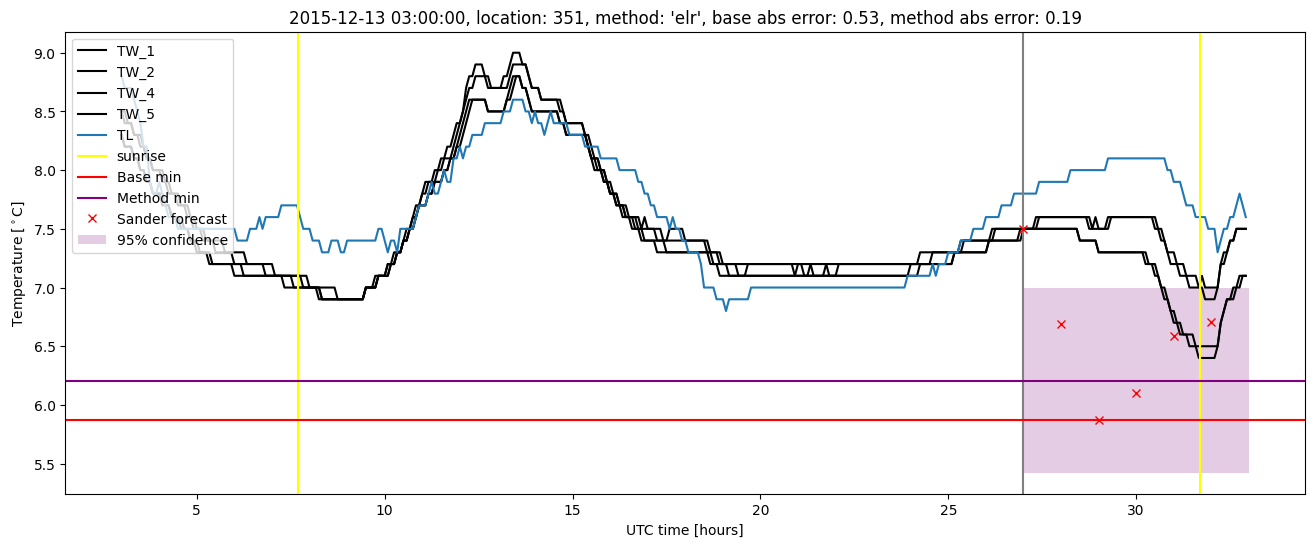
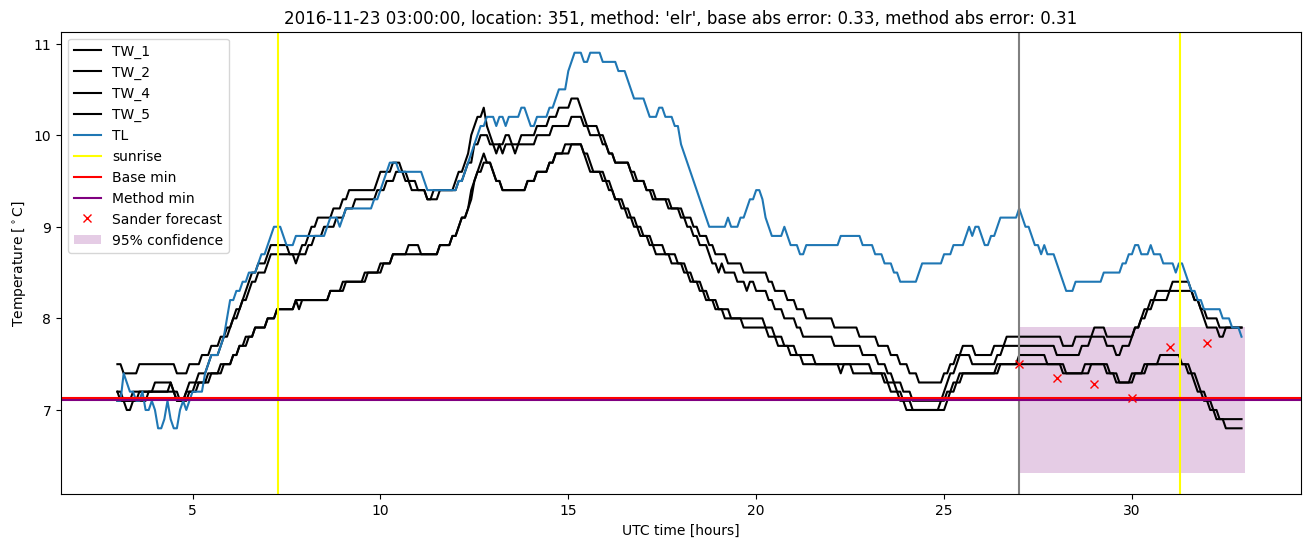
Extended logistic regression plots