GMS location: 255
Random forest results
| names |
period |
power |
significance |
meanSquareError |
absError |
maxError |
CRPS |
IGN |
| baseline |
winter 2016 |
0.982 |
0.091 |
0.382 |
0.458 |
1.900 |
NaN |
NaN |
| forest |
winter 2016 |
0.976 |
0.091 |
0.316 |
0.410 |
1.716 |
0.547 |
4.553 |
| baseline |
winter 2017 |
0.973 |
0.049 |
0.328 |
0.414 |
2.390 |
NaN |
NaN |
| forest |
winter 2017 |
0.973 |
0.024 |
0.276 |
0.384 |
1.748 |
0.508 |
3.076 |
| baseline |
winter 2018 |
0.986 |
0.135 |
0.405 |
0.469 |
1.973 |
NaN |
NaN |
| forest |
winter 2018 |
0.978 |
0.108 |
0.366 |
0.458 |
2.025 |
0.535 |
3.825 |
| baseline |
winter 2019 |
0.985 |
0.000e+00 |
0.346 |
0.424 |
2.150 |
NaN |
NaN |
| forest |
winter 2019 |
0.985 |
0.000e+00 |
0.280 |
0.384 |
1.495 |
0.537 |
3.401 |
| baseline |
all |
0.982 |
0.080 |
0.368 |
0.443 |
2.390 |
NaN |
NaN |
| forest |
all |
0.978 |
0.062 |
0.312 |
0.411 |
2.025 |
0.532 |
3.769 |
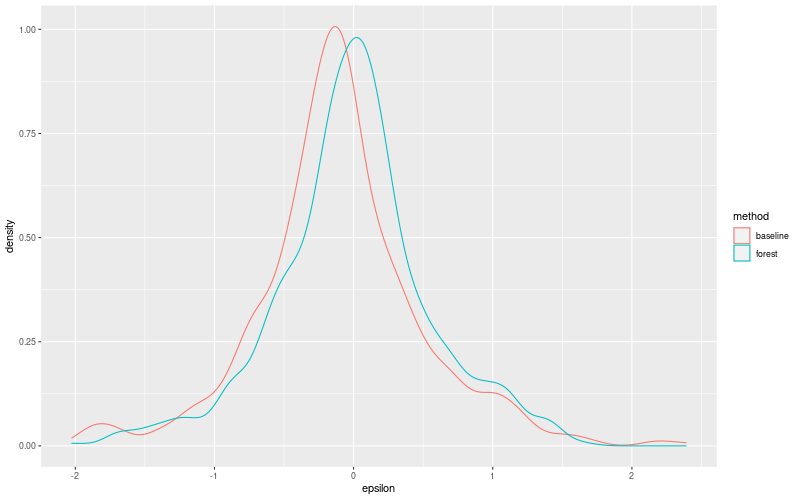
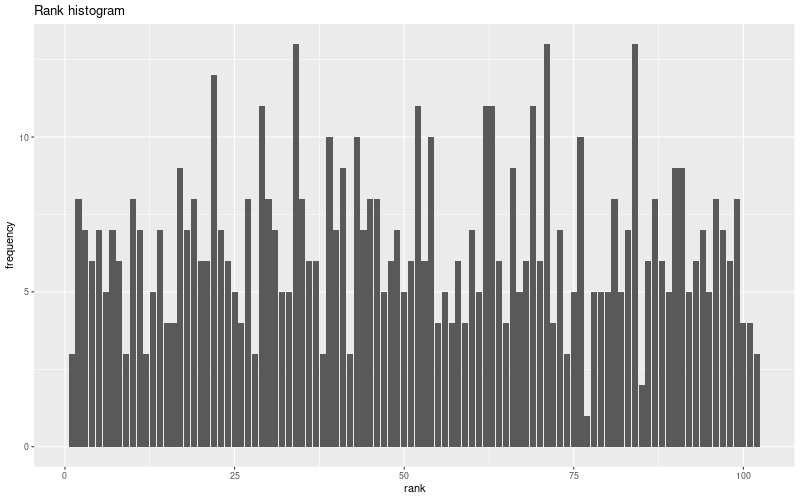
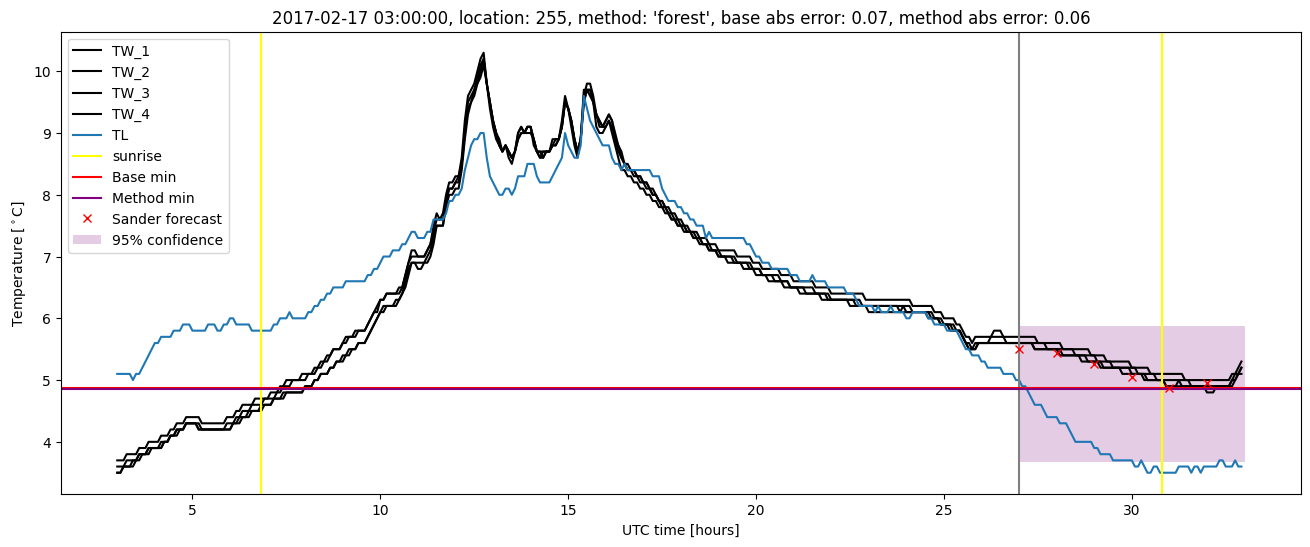
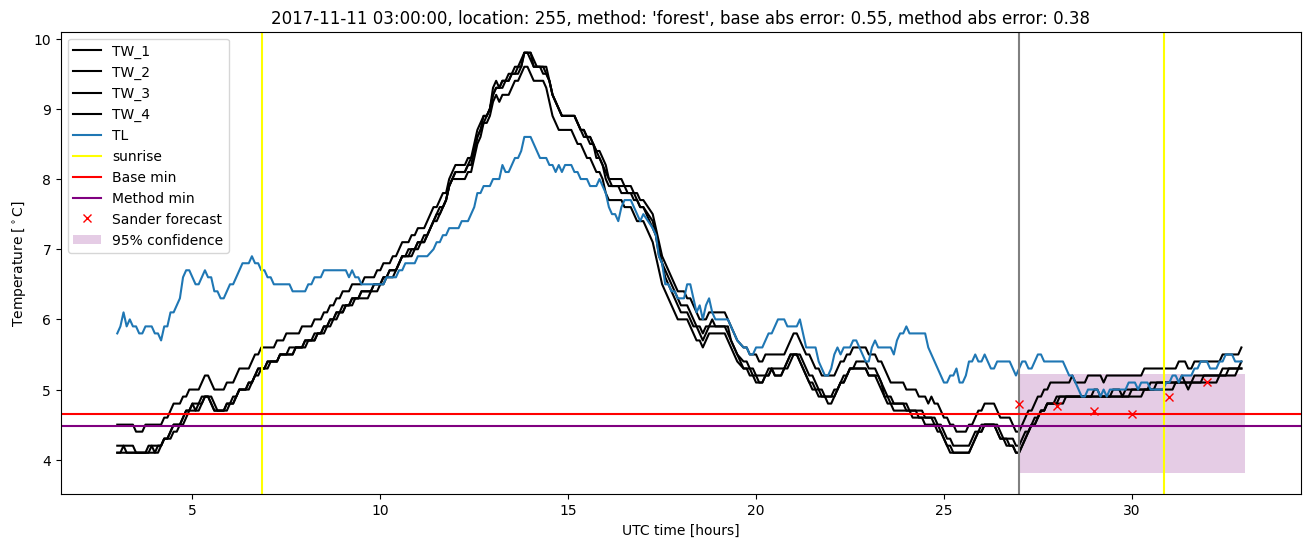
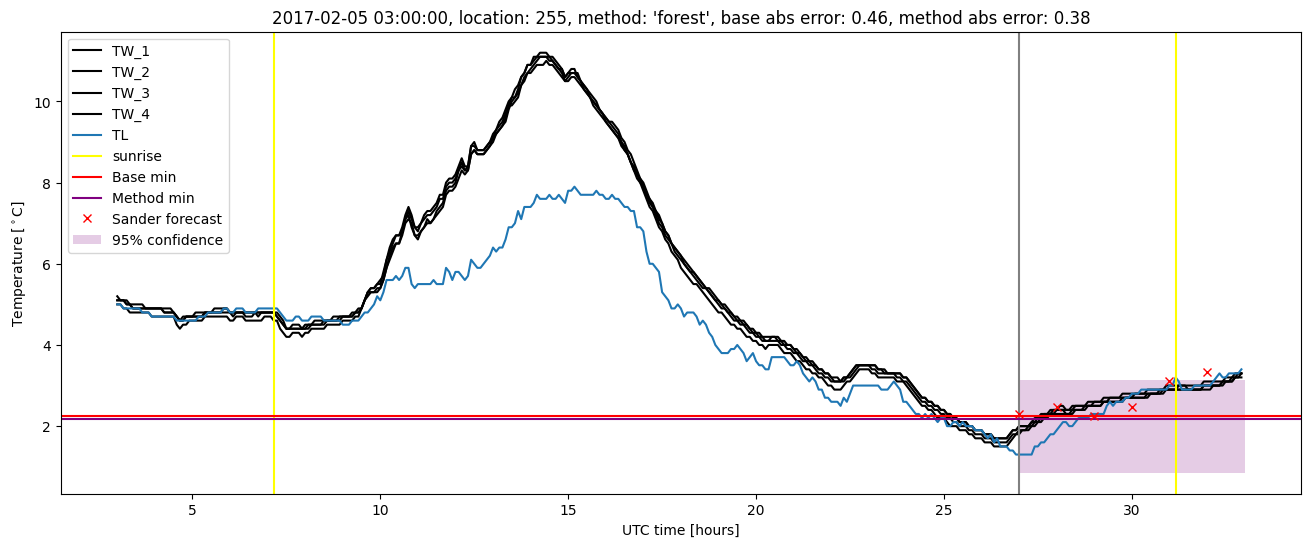
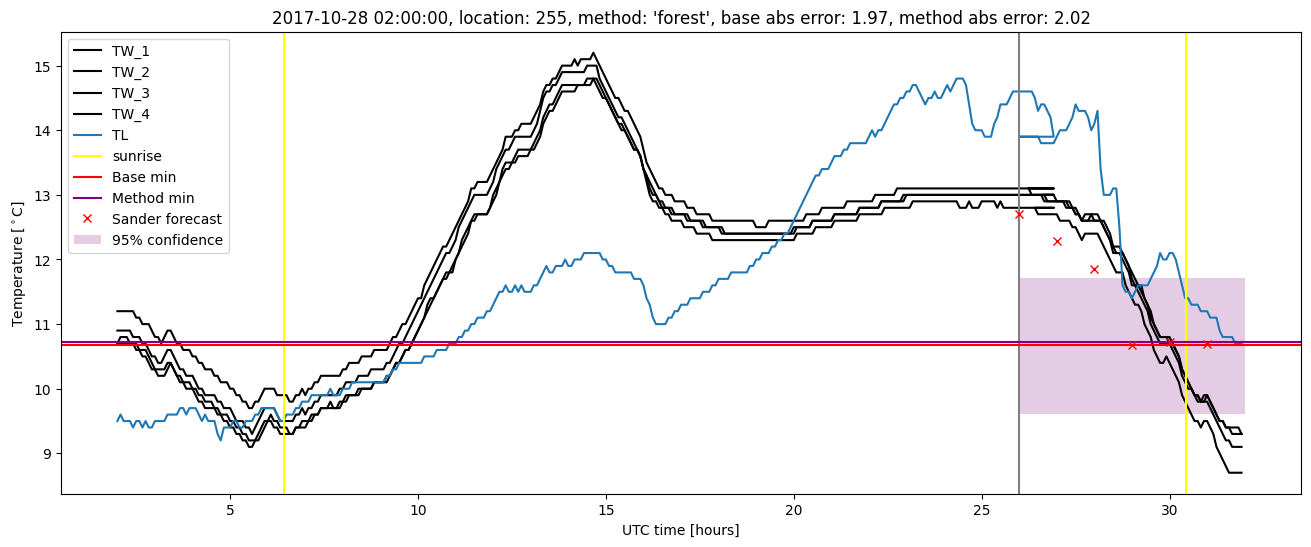
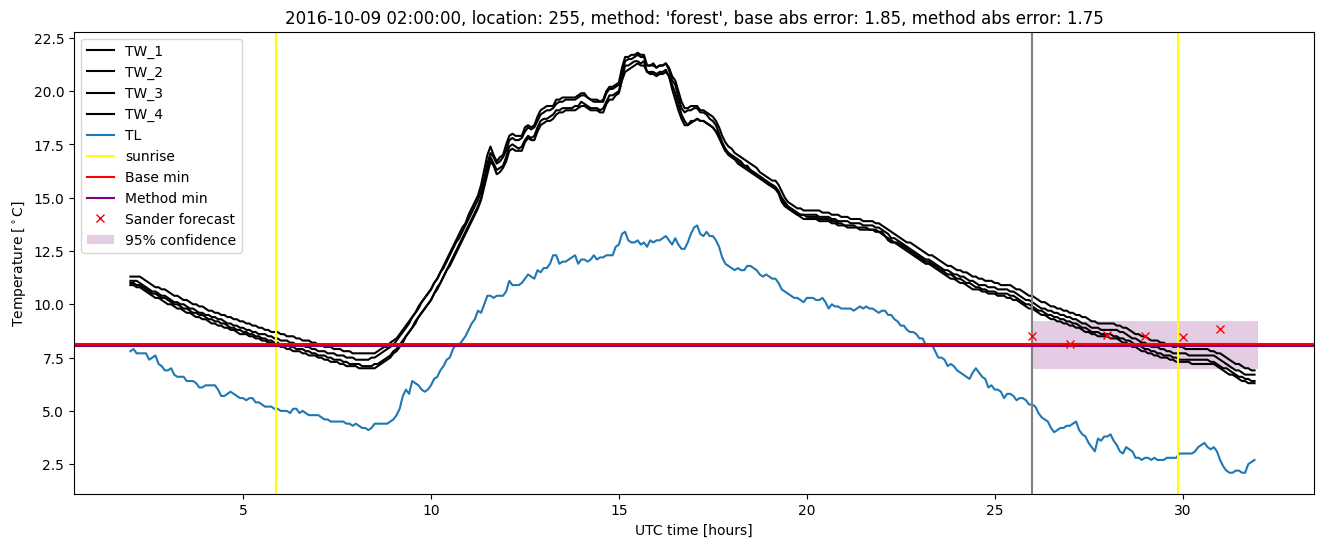
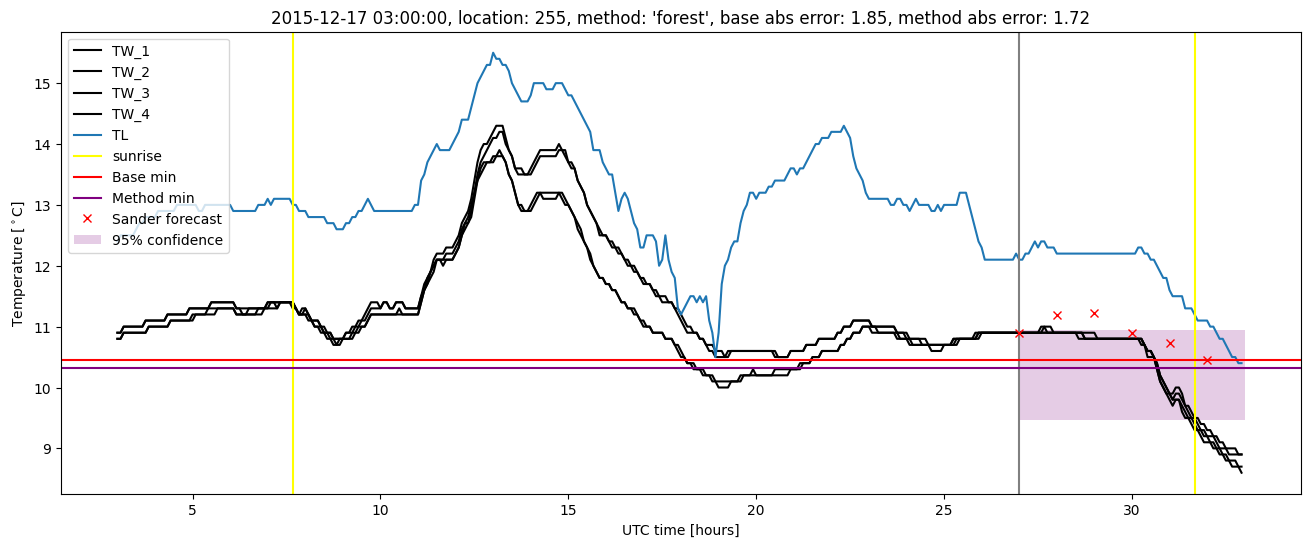
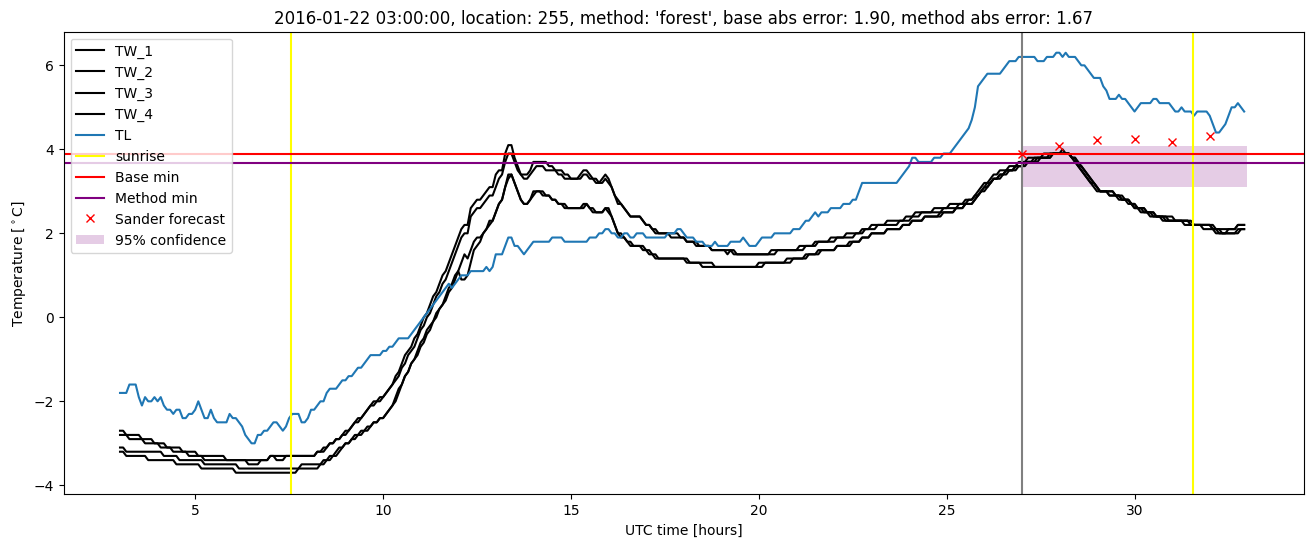
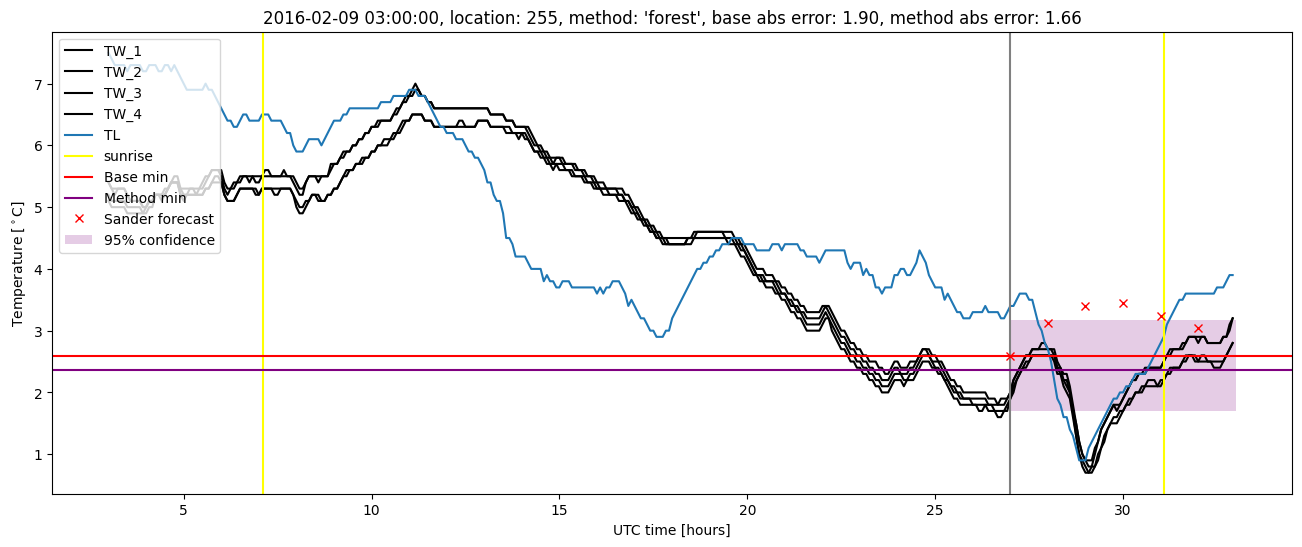
Random forest plots
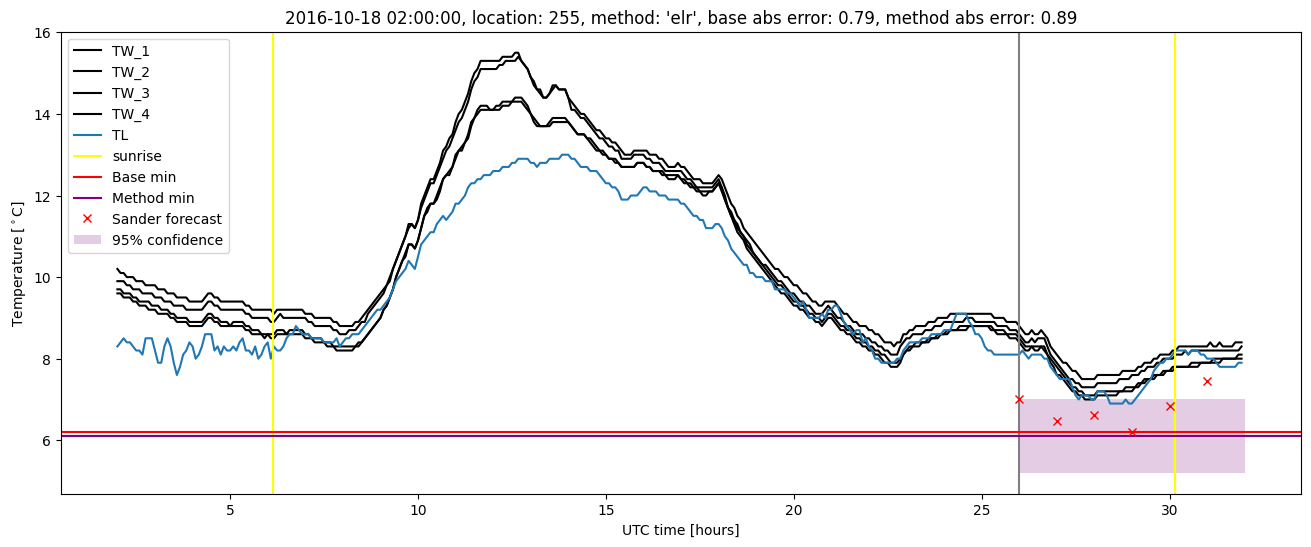
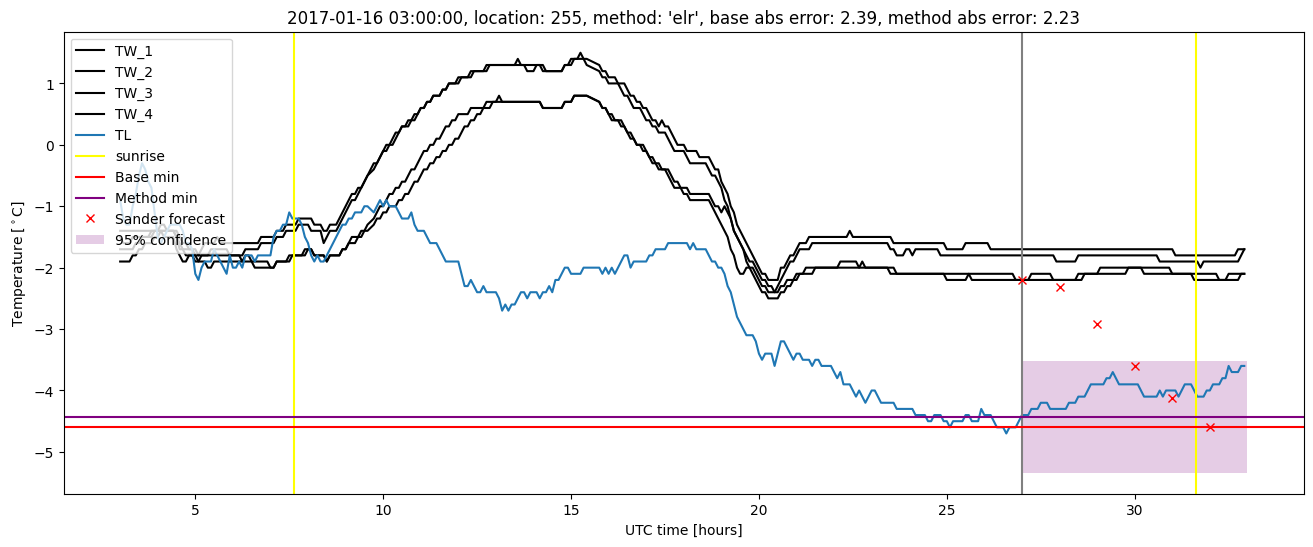
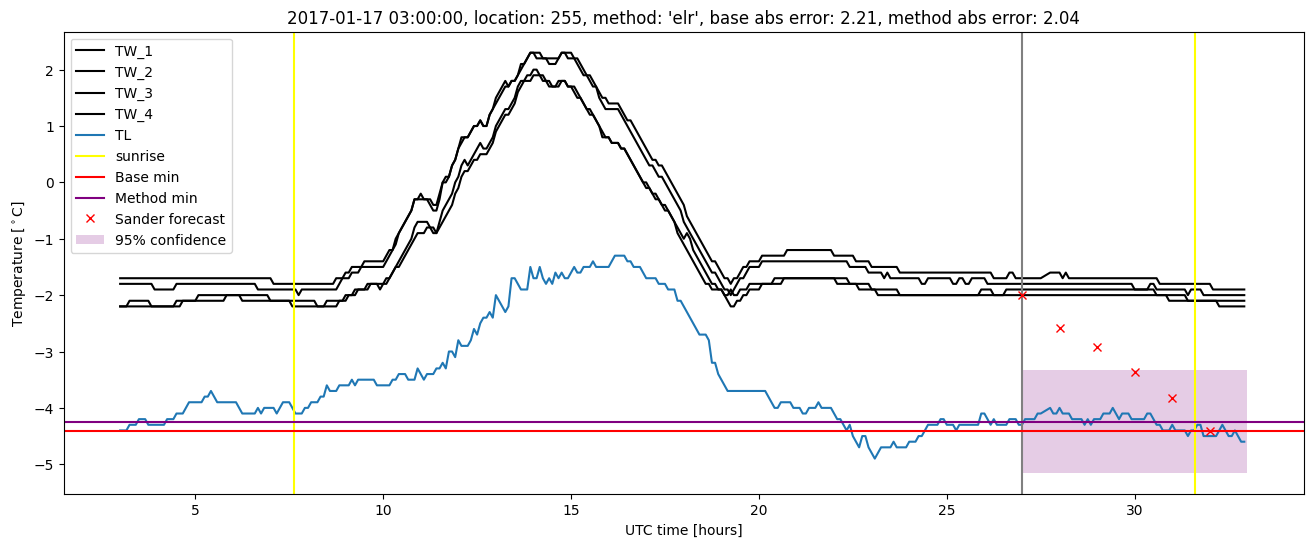
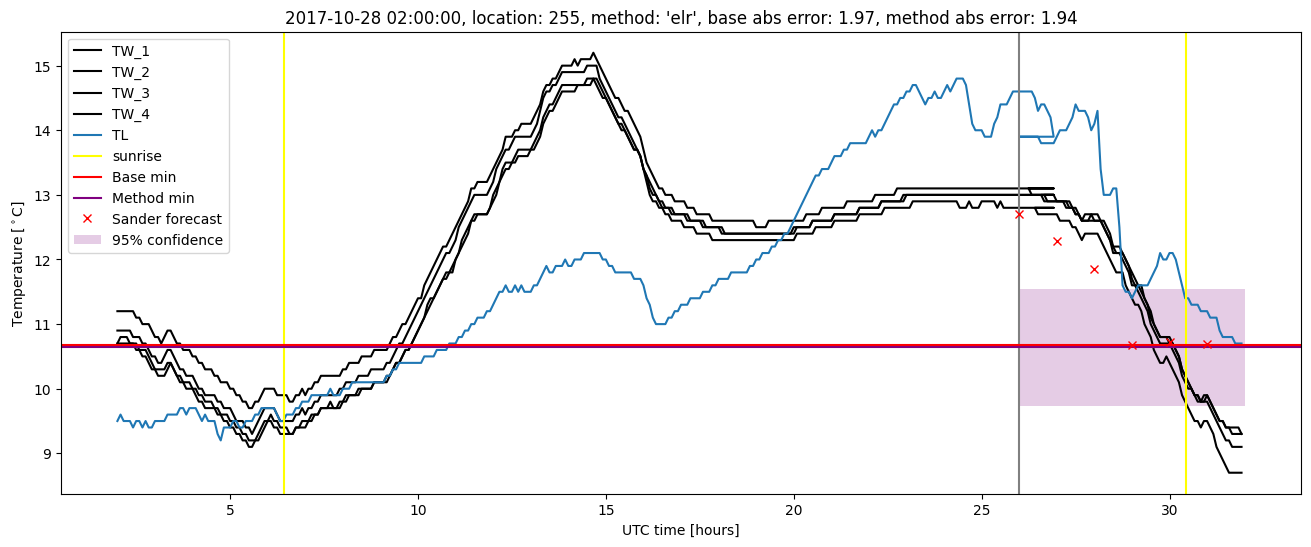
Extended logistic regression results
| names |
period |
power |
significance |
meanSquareError |
absError |
maxError |
CRPS |
IGN |
| baseline |
winter 2016 |
0.982 |
0.091 |
0.382 |
0.458 |
1.900 |
NaN |
NaN |
| elr |
winter 2016 |
0.976 |
0.045 |
0.340 |
0.453 |
1.615 |
0.591 |
4.292 |
| baseline |
winter 2017 |
0.973 |
0.049 |
0.328 |
0.414 |
2.390 |
NaN |
NaN |
| elr |
winter 2017 |
0.973 |
0.049 |
0.302 |
0.401 |
2.234 |
0.533 |
3.844 |
| baseline |
winter 2018 |
0.986 |
0.135 |
0.405 |
0.469 |
1.973 |
NaN |
NaN |
| elr |
winter 2018 |
0.993 |
0.108 |
0.415 |
0.491 |
1.938 |
0.568 |
4.327 |
| baseline |
winter 2019 |
0.985 |
0.000e+00 |
0.346 |
0.424 |
2.150 |
NaN |
NaN |
| elr |
winter 2019 |
0.985 |
0.000e+00 |
0.324 |
0.432 |
1.576 |
0.557 |
4.089 |
| baseline |
all |
0.982 |
0.080 |
0.368 |
0.443 |
2.390 |
NaN |
NaN |
| elr |
all |
0.982 |
0.062 |
0.348 |
0.446 |
2.234 |
0.564 |
4.154 |
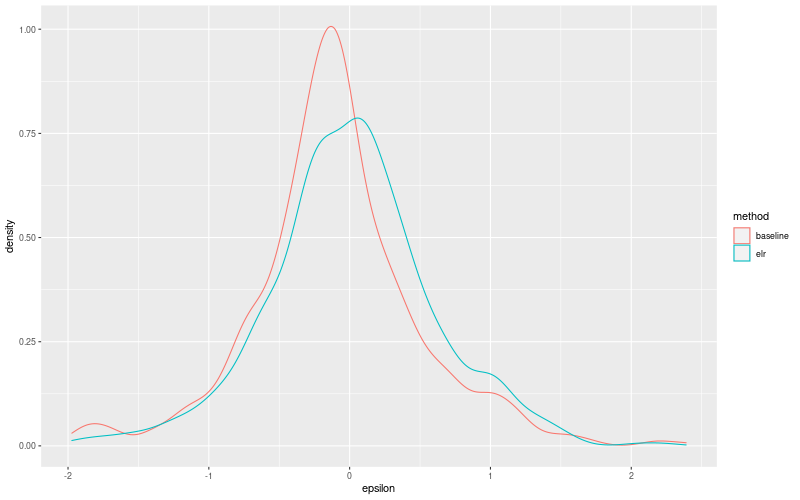
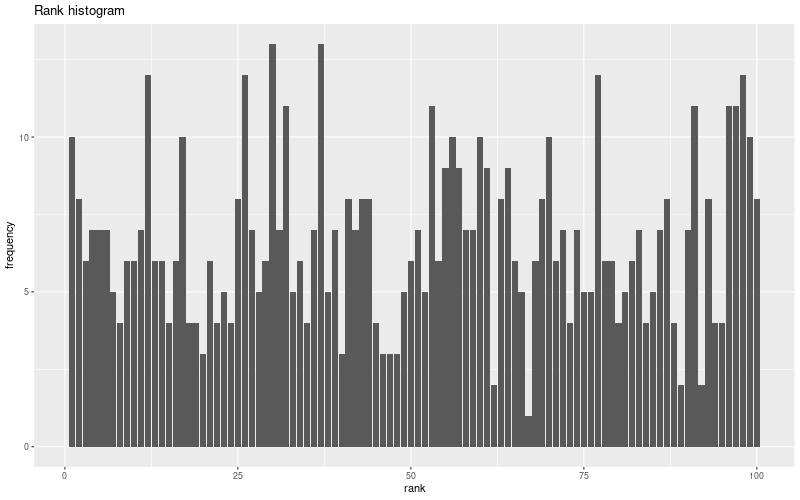
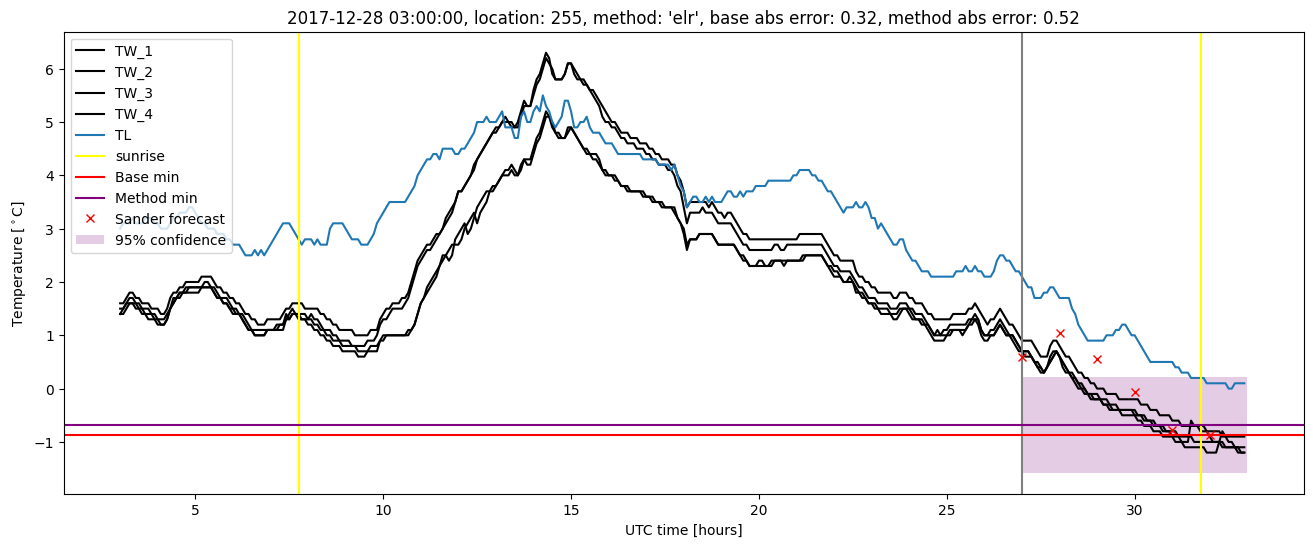
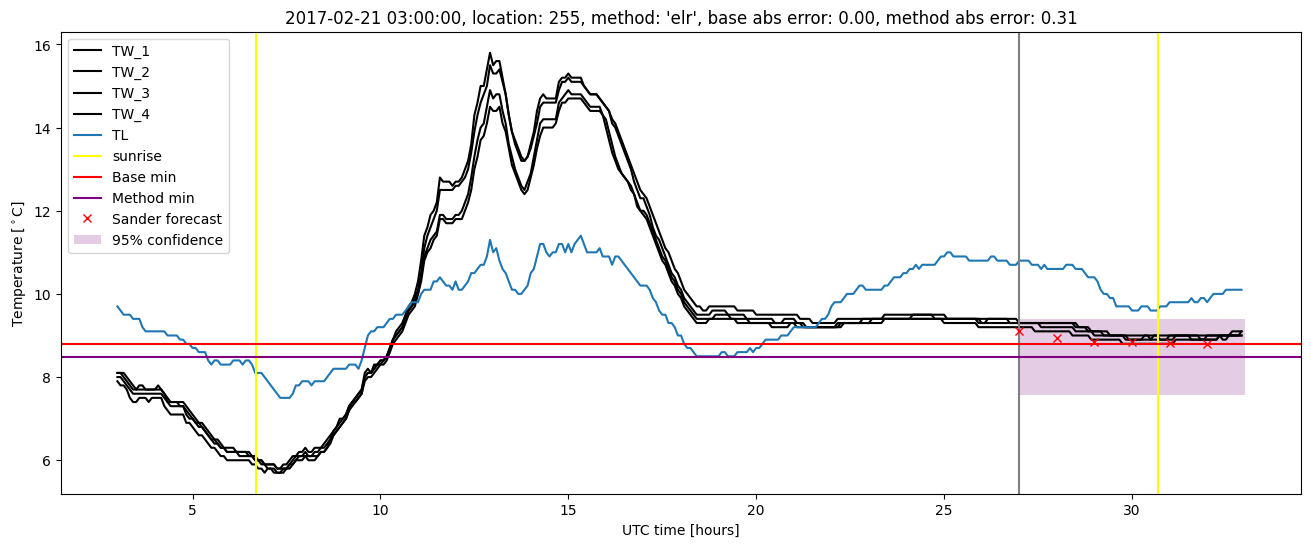
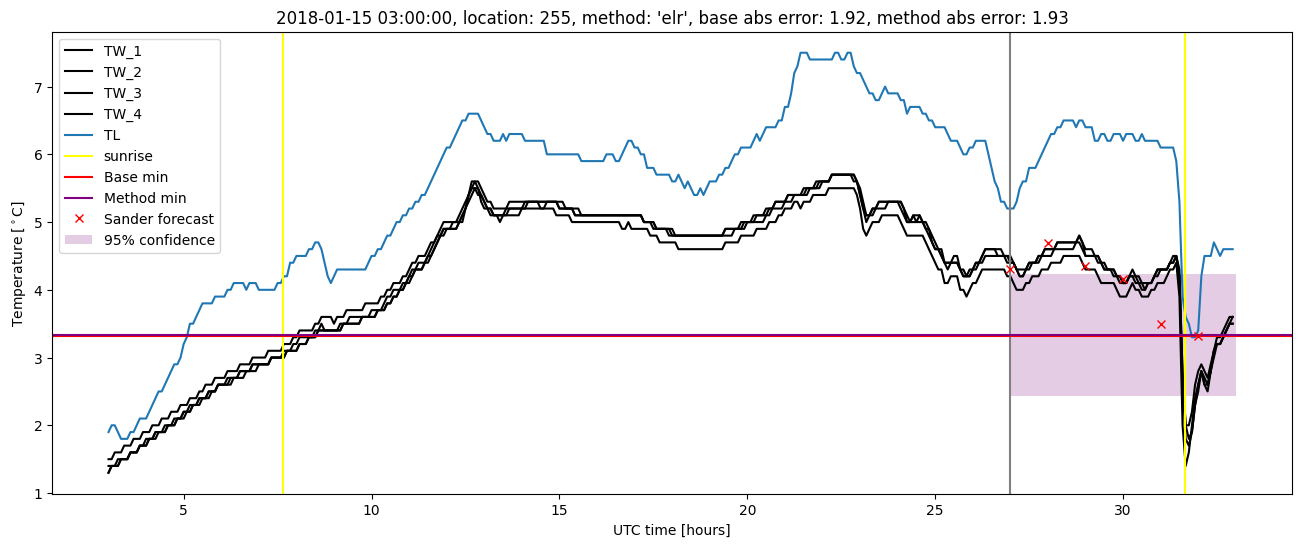
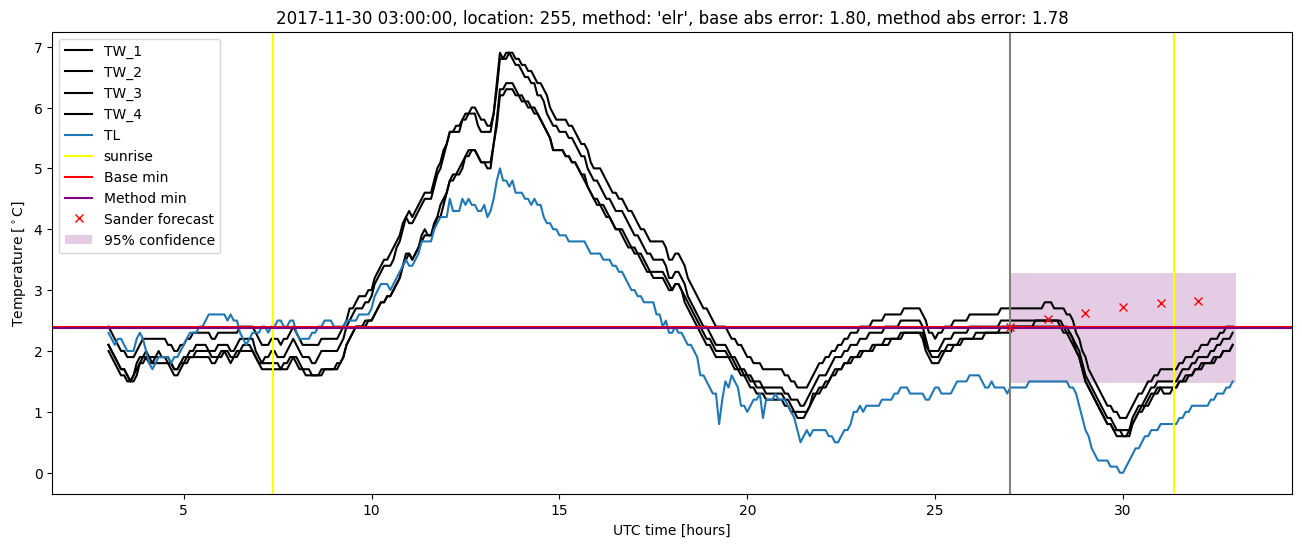
Extended logistic regression plots