GMS location: 254
Random forest results
| names |
period |
power |
significance |
meanSquareError |
absError |
maxError |
CRPS |
IGN |
| baseline |
winter 2016 |
0.983 |
0.167 |
0.303 |
0.413 |
2.002 |
NaN |
NaN |
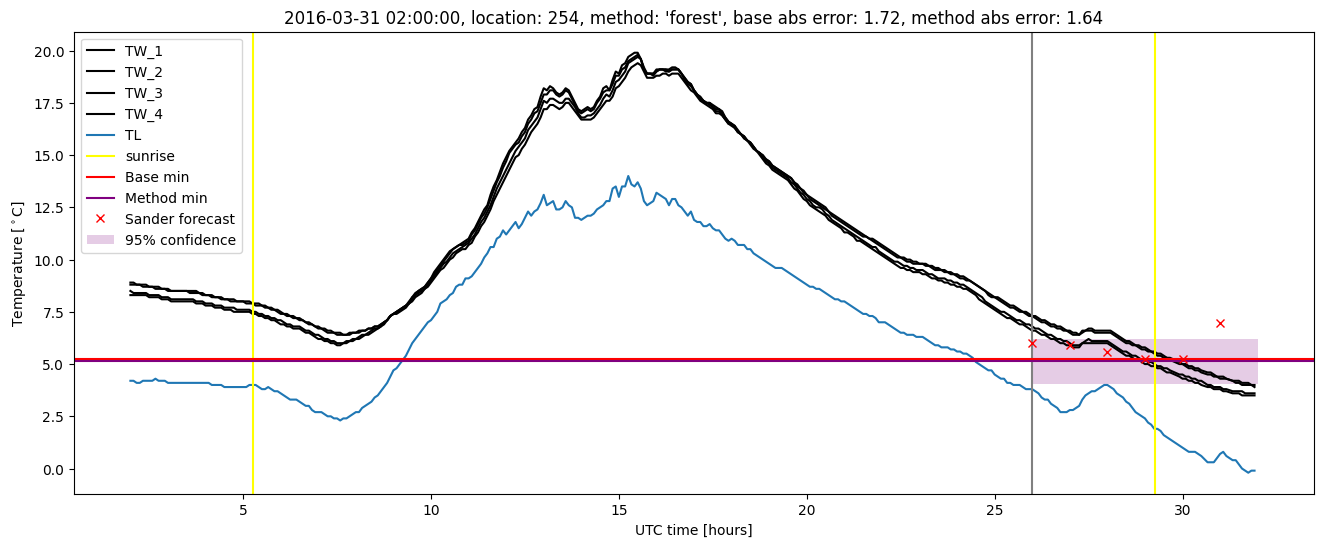
| forest |
winter 2016 |
0.983 |
0.125 |
0.260 |
0.383 |
1.643 |
0.538 |
5.388 |
| baseline |
winter 2017 |
0.982 |
0.095 |
0.432 |
0.472 |
2.351 |
NaN |
NaN |
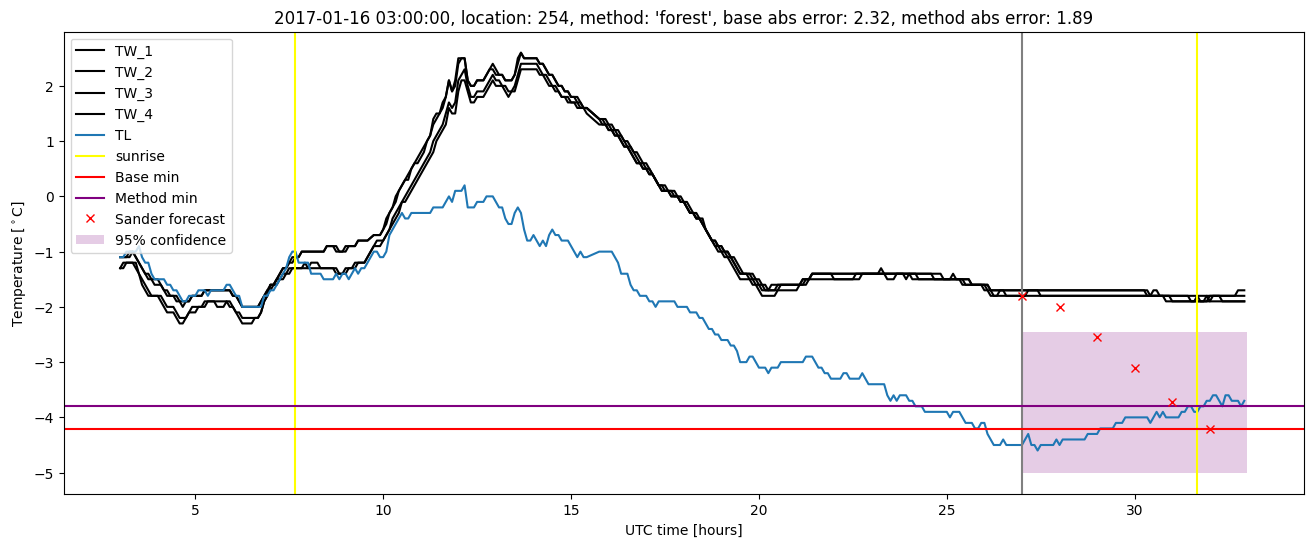
| forest |
winter 2017 |
0.973 |
0.095 |
0.360 |
0.445 |
2.003 |
0.525 |
6.185 |
| baseline |
winter 2018 |
0.980 |
0.061 |
0.393 |
0.462 |
1.957 |
NaN |
NaN |
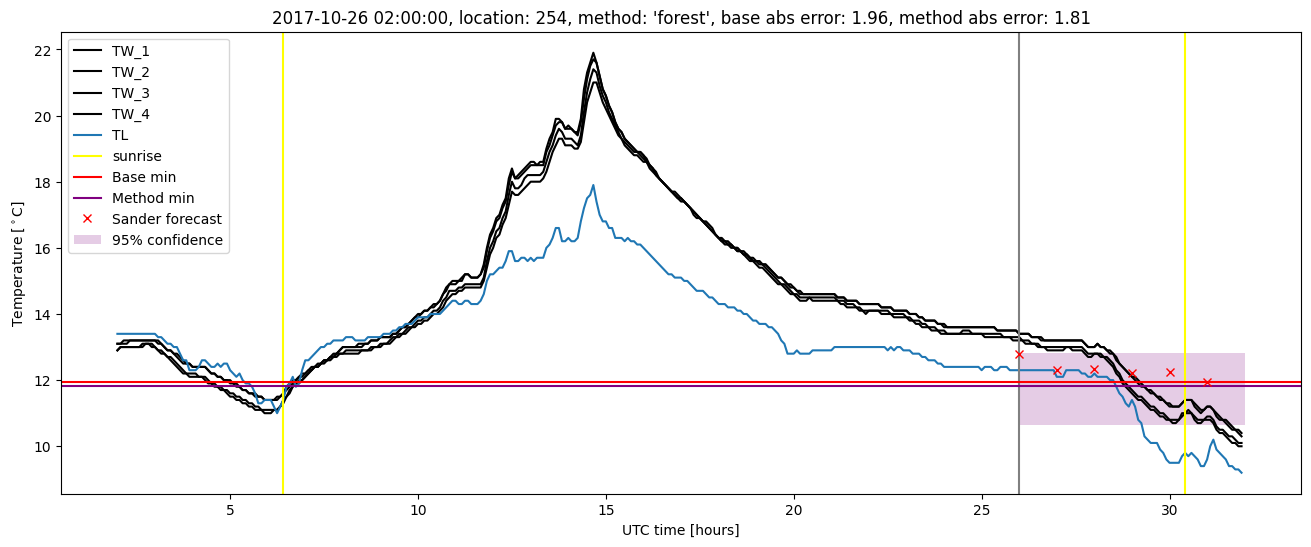
| forest |
winter 2018 |
0.967 |
0.061 |
0.326 |
0.444 |
1.808 |
0.541 |
3.989 |
| baseline |
winter 2019 |
0.987 |
0.000e+00 |
0.283 |
0.371 |
1.820 |
NaN |
NaN |
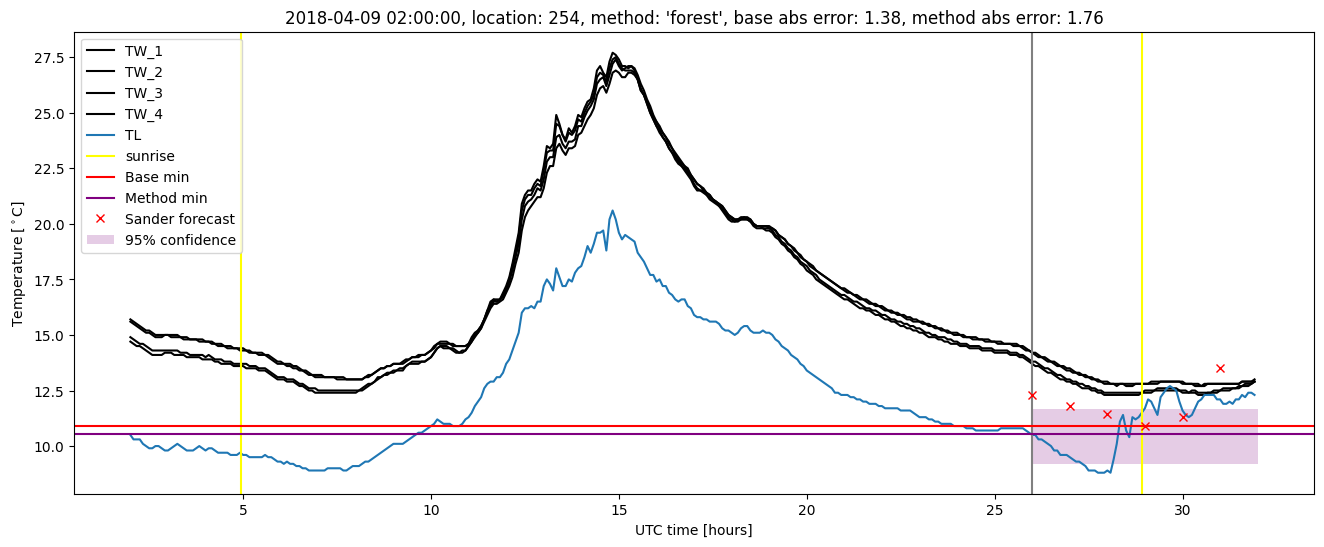
| forest |
winter 2019 |
0.987 |
0.000e+00 |
0.216 |
0.332 |
1.521 |
0.540 |
4.561 |
| baseline |
all |
0.983 |
0.087 |
0.349 |
0.429 |
2.351 |
NaN |
NaN |
| forest |
all |
0.978 |
0.078 |
0.288 |
0.400 |
2.003 |
0.536 |
4.998 |
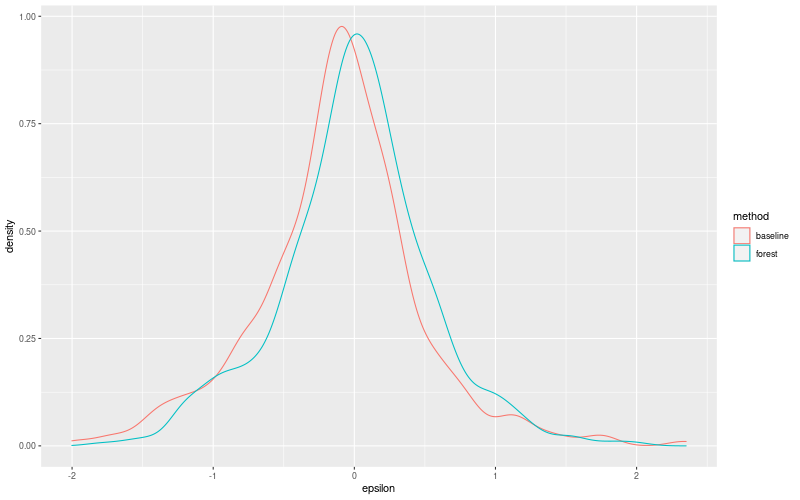
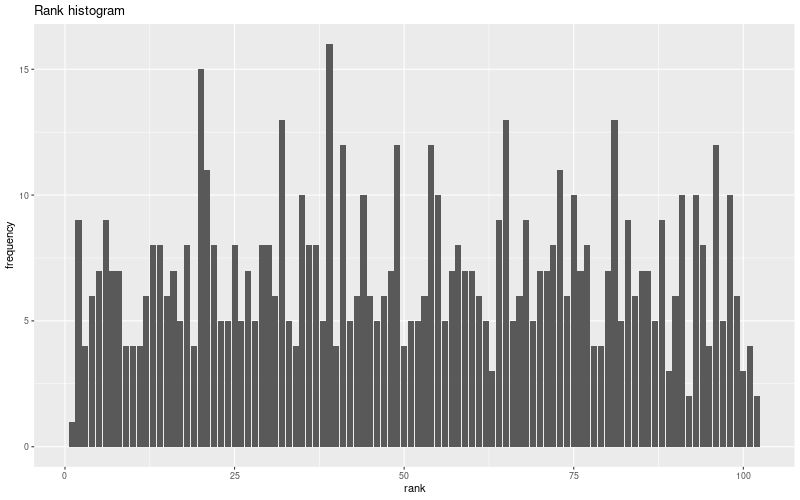
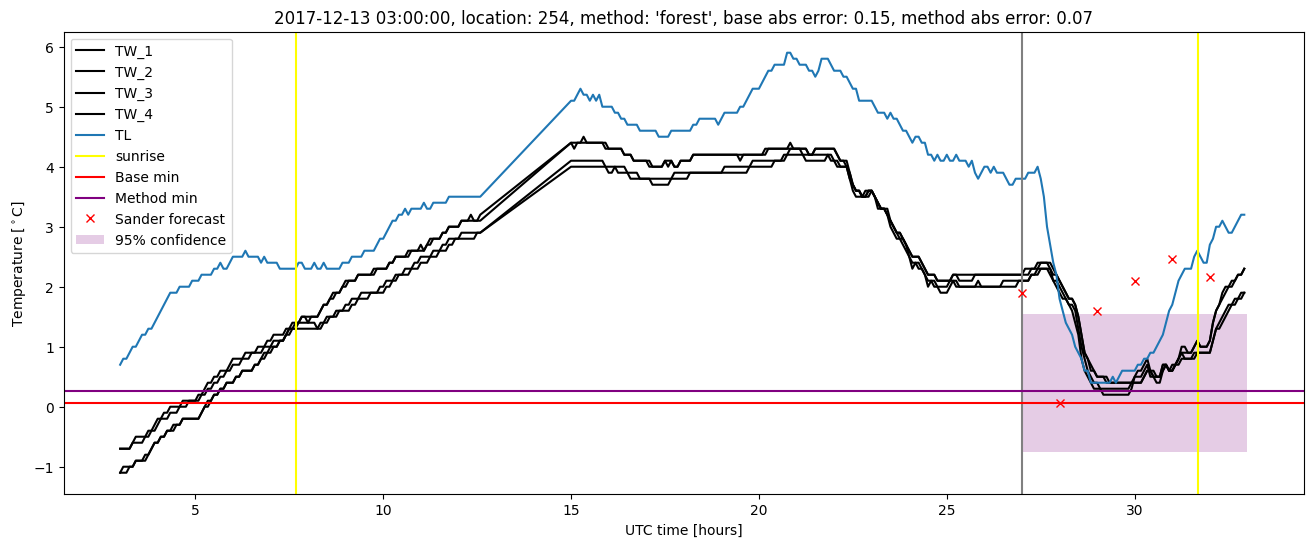
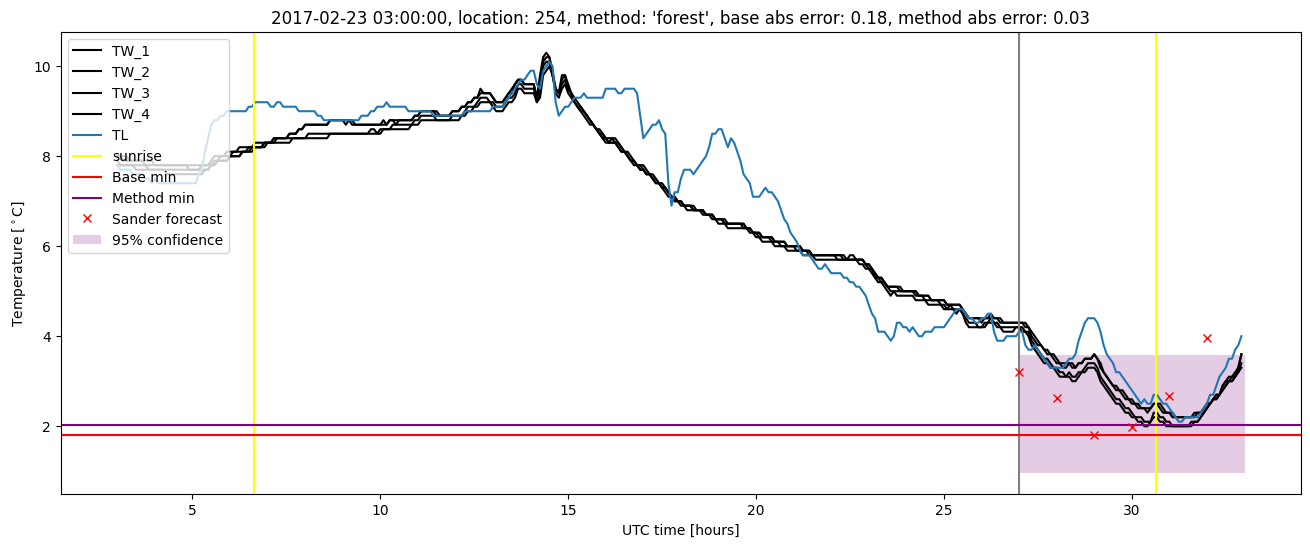
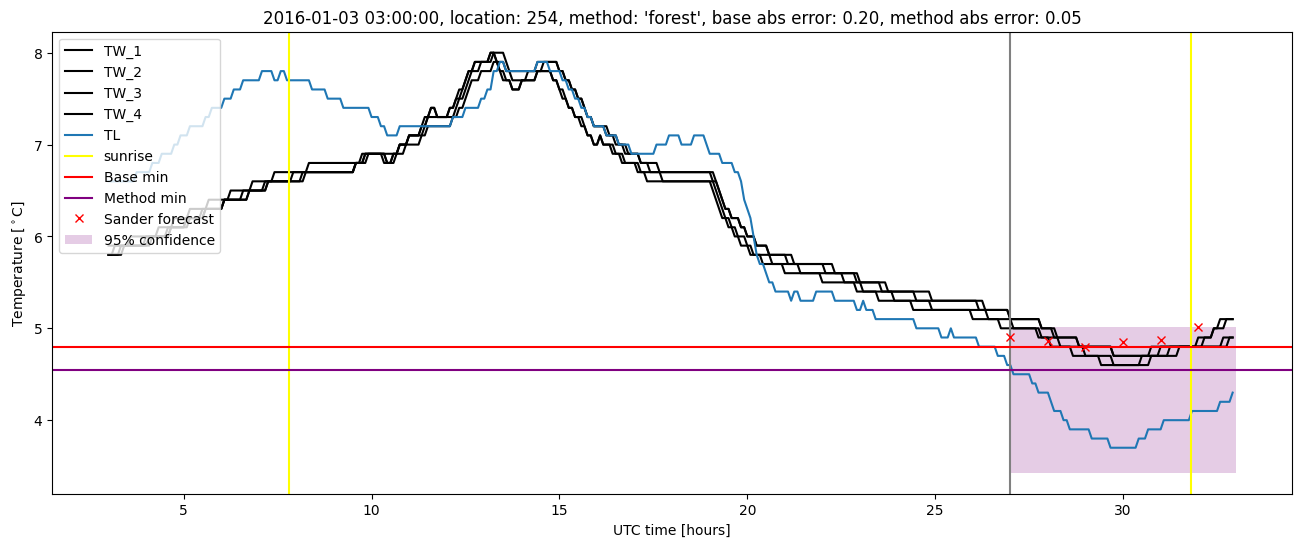
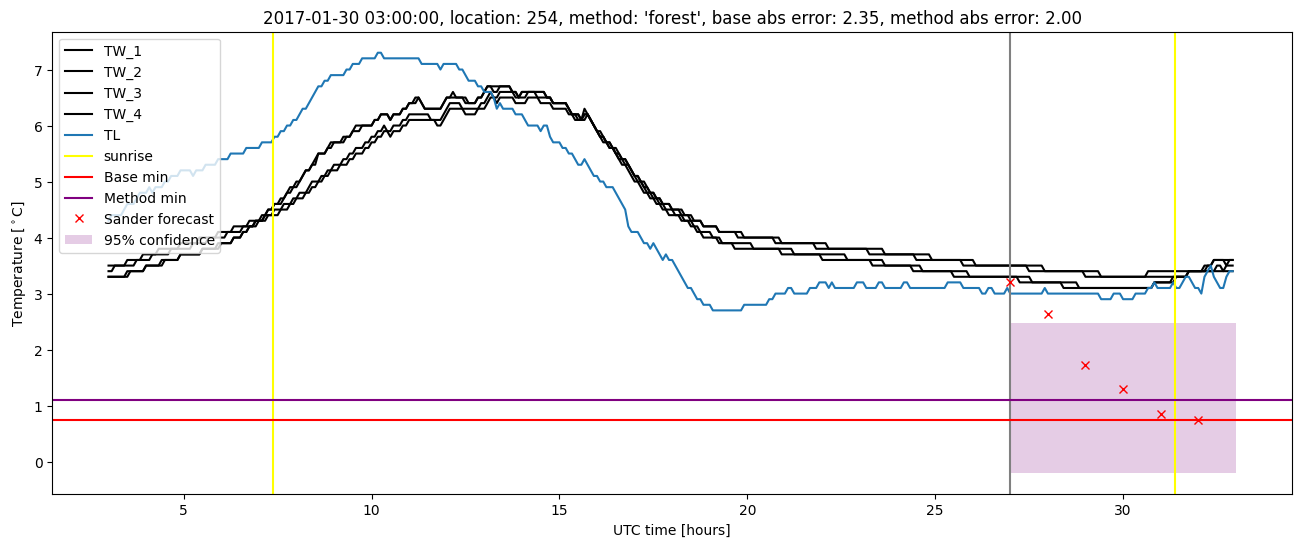
Random forest plots
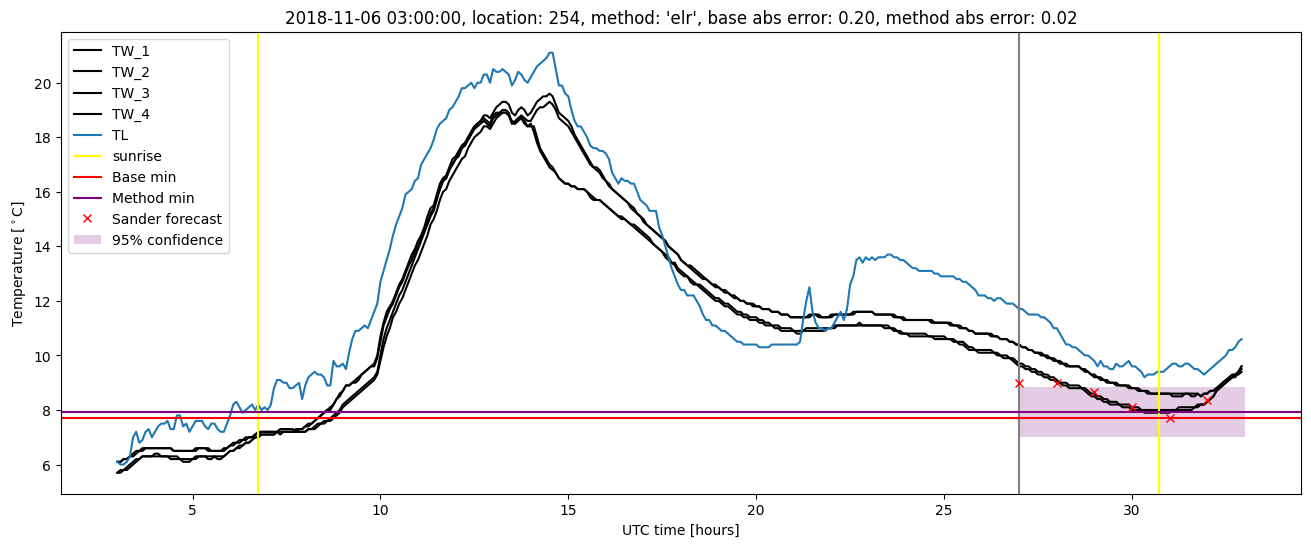
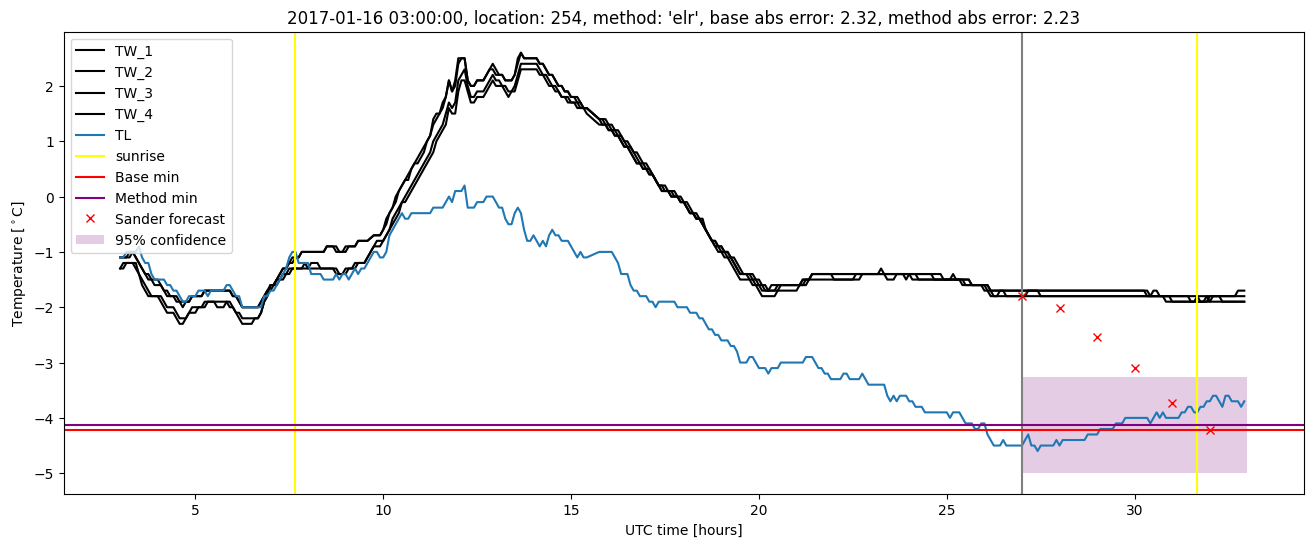
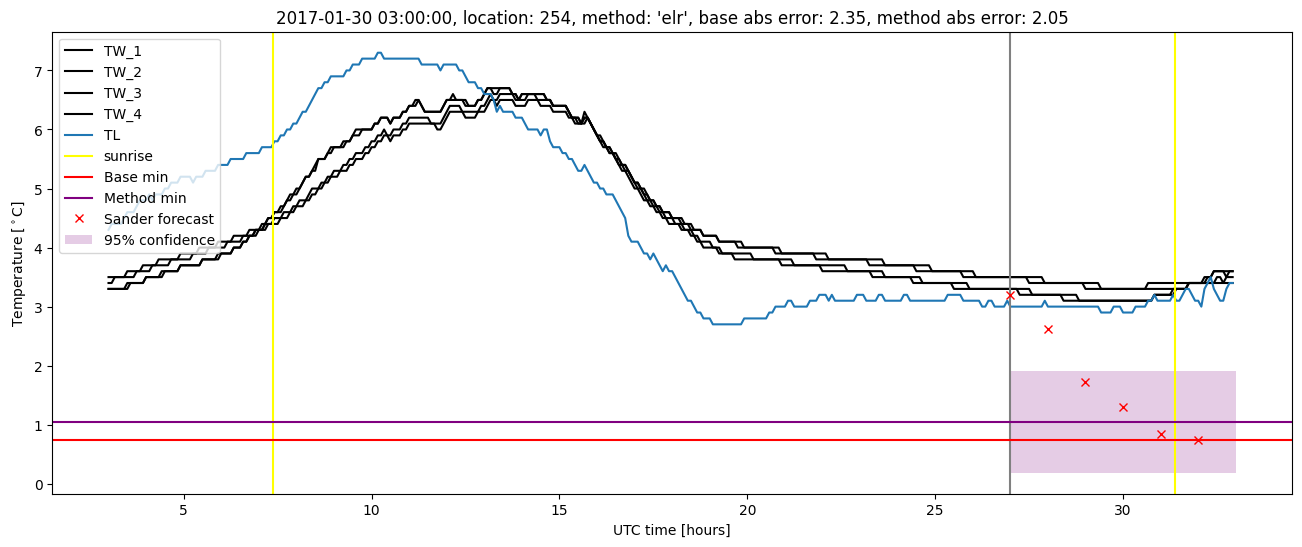
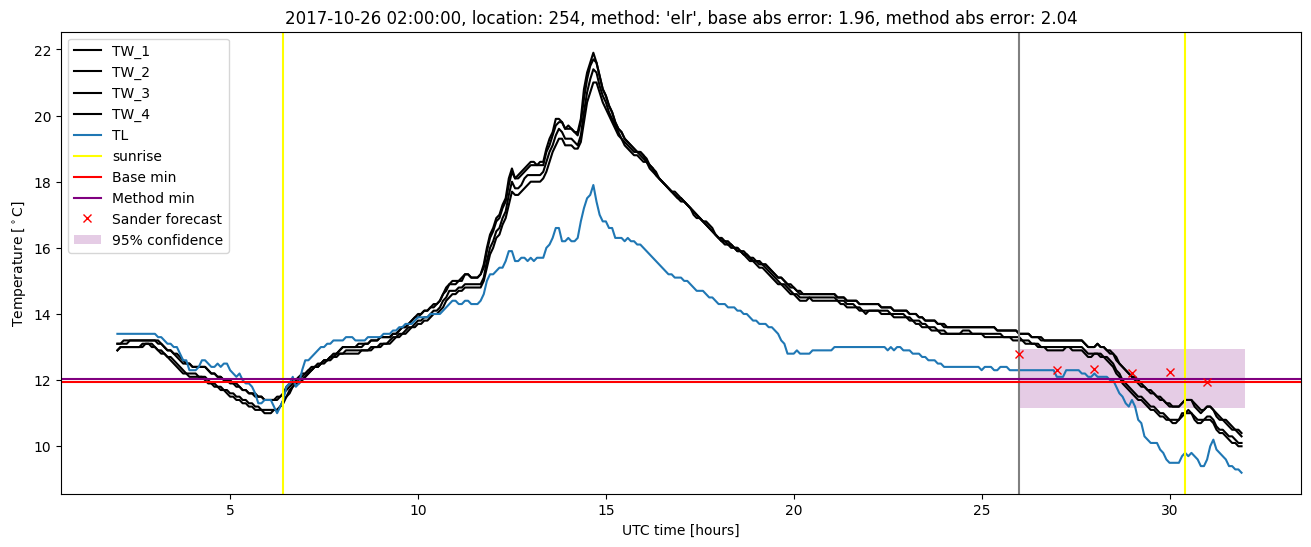
Extended logistic regression results
| names |
period |
power |
significance |
meanSquareError |
absError |
maxError |
CRPS |
IGN |
| baseline |
winter 2016 |
0.983 |
0.167 |
0.303 |
0.413 |
2.002 |
NaN |
NaN |
| elr |
winter 2016 |
0.983 |
0.125 |
0.305 |
0.428 |
1.772 |
0.570 |
4.462 |
| baseline |
winter 2017 |
0.982 |
0.095 |
0.432 |
0.472 |
2.351 |
NaN |
NaN |
| elr |
winter 2017 |
0.955 |
0.095 |
0.389 |
0.467 |
2.229 |
0.561 |
4.927 |
| baseline |
winter 2018 |
0.980 |
0.061 |
0.393 |
0.462 |
1.957 |
NaN |
NaN |
| elr |
winter 2018 |
0.967 |
0.061 |
0.367 |
0.477 |
2.044 |
0.608 |
5.188 |
| baseline |
winter 2019 |
0.987 |
0.000e+00 |
0.283 |
0.371 |
1.820 |
NaN |
NaN |
| elr |
winter 2019 |
0.987 |
0.000e+00 |
0.230 |
0.356 |
1.657 |
0.626 |
4.587 |
| baseline |
all |
0.983 |
0.087 |
0.349 |
0.429 |
2.351 |
NaN |
NaN |
| elr |
all |
0.975 |
0.078 |
0.321 |
0.432 |
2.229 |
0.591 |
4.780 |
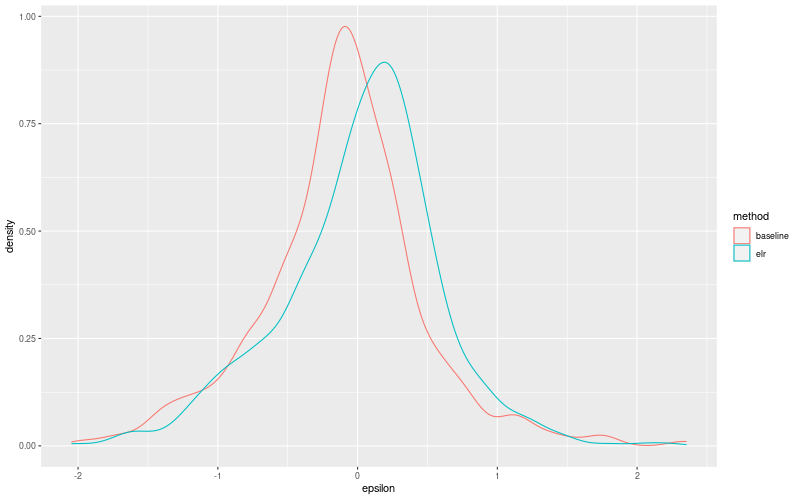
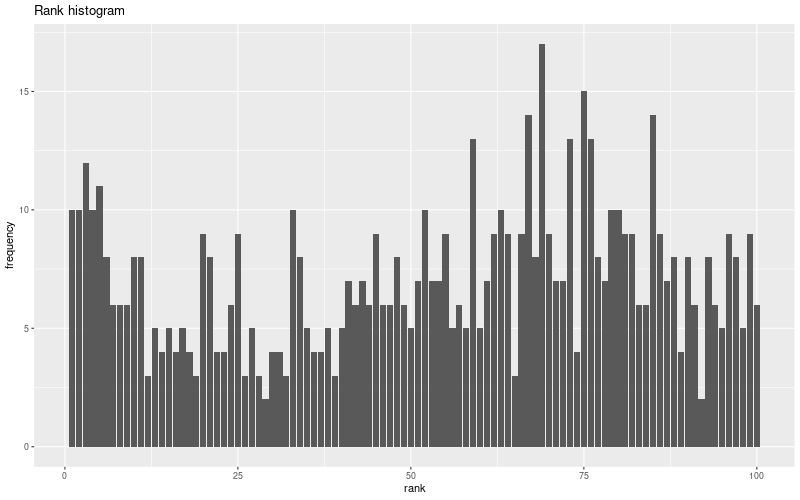
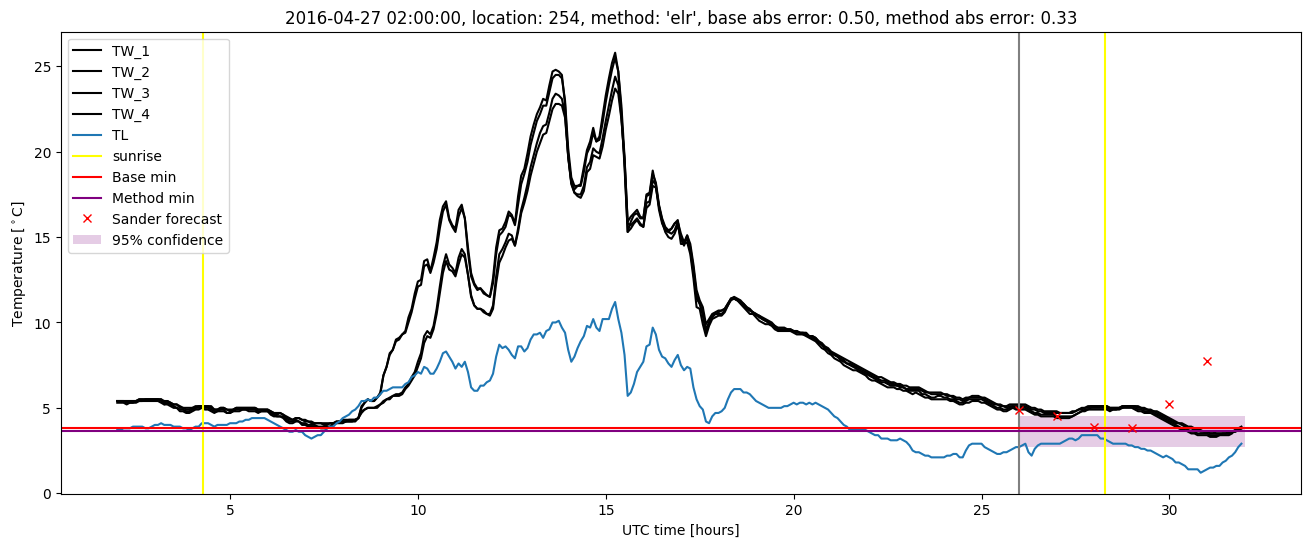
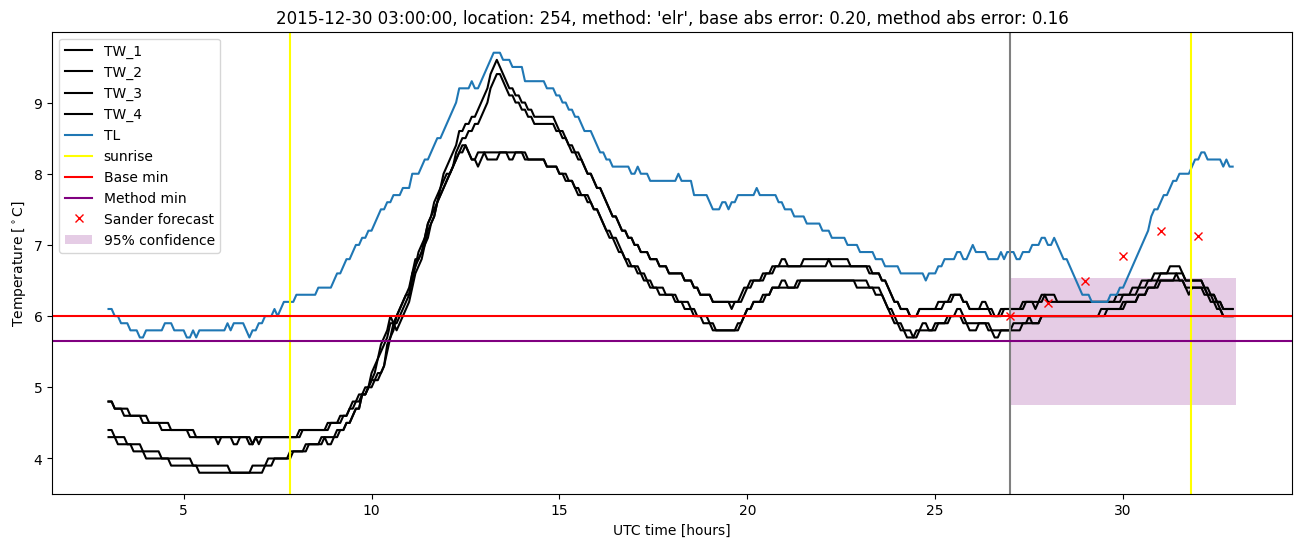
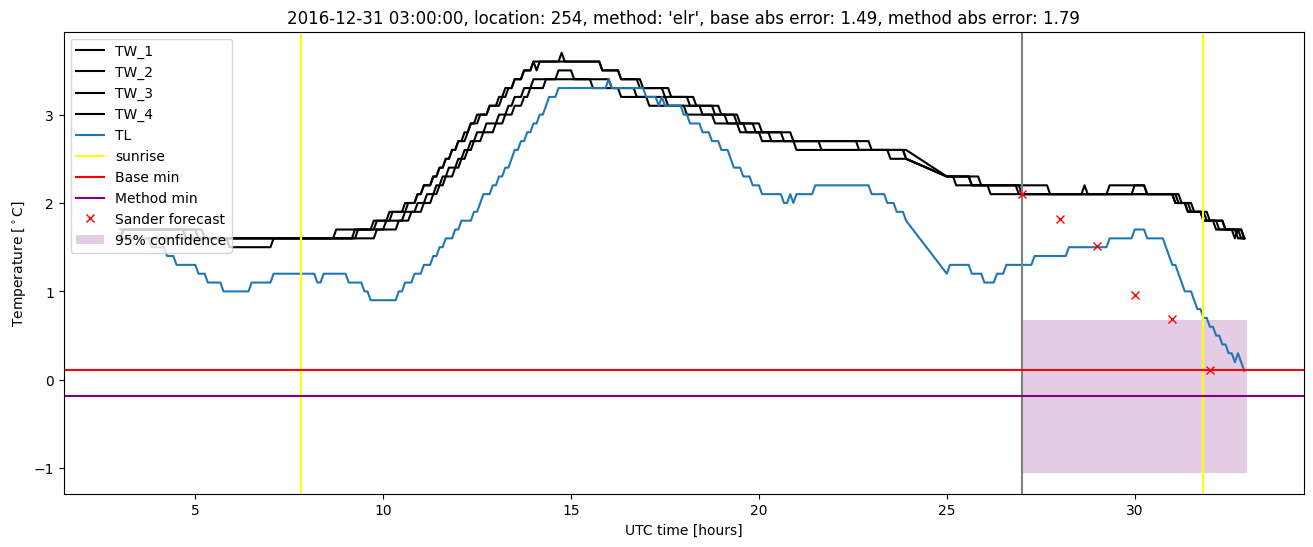
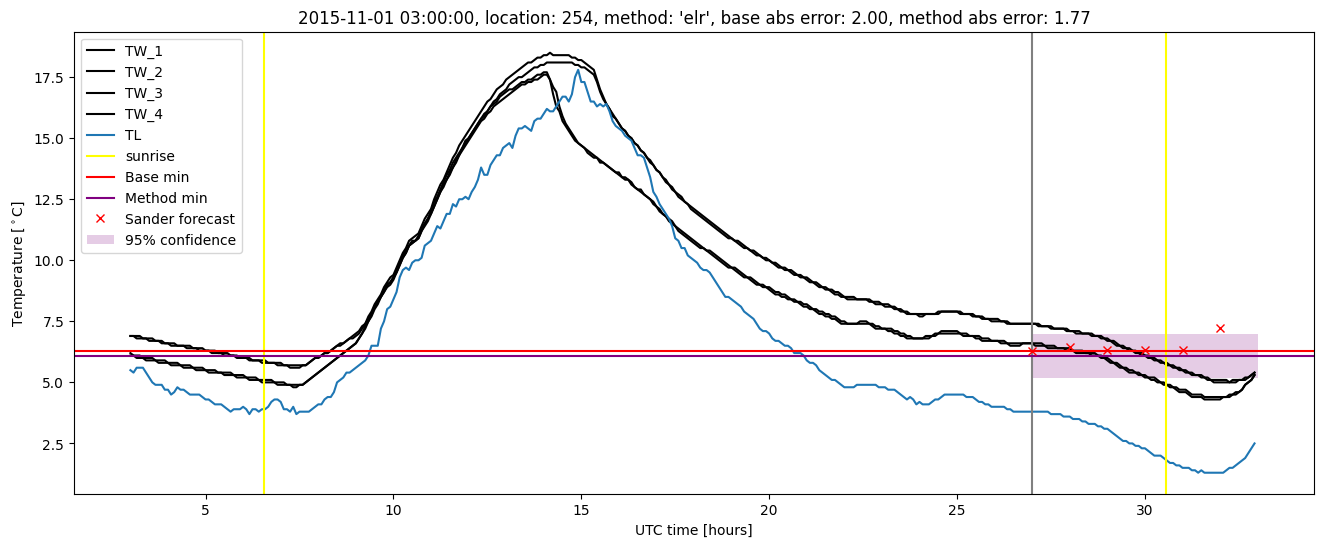
Extended logistic regression plots