GMS location: 253
Random forest results
| names |
period |
power |
significance |
meanSquareError |
absError |
maxError |
CRPS |
IGN |
| baseline |
winter 2016 |
0.993 |
0.000e+00 |
0.304 |
0.433 |
1.571 |
NaN |
NaN |
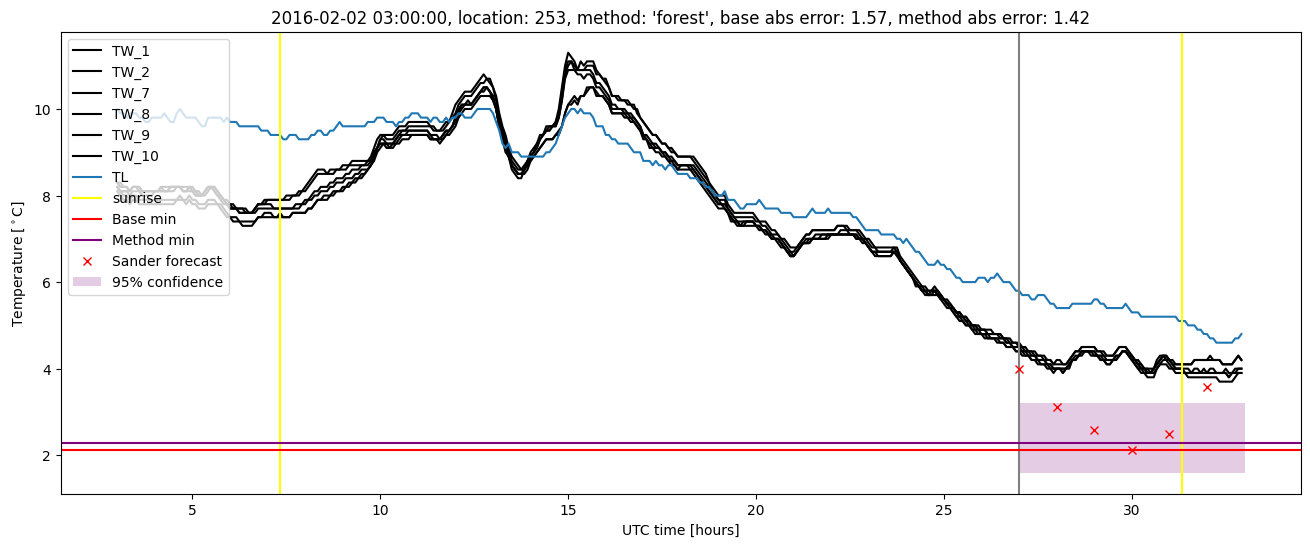
| forest |
winter 2016 |
0.993 |
0.000e+00 |
0.226 |
0.377 |
1.421 |
0.482 |
7.228 |
| baseline |
winter 2017 |
0.958 |
0.061 |
0.373 |
0.452 |
1.890 |
NaN |
NaN |
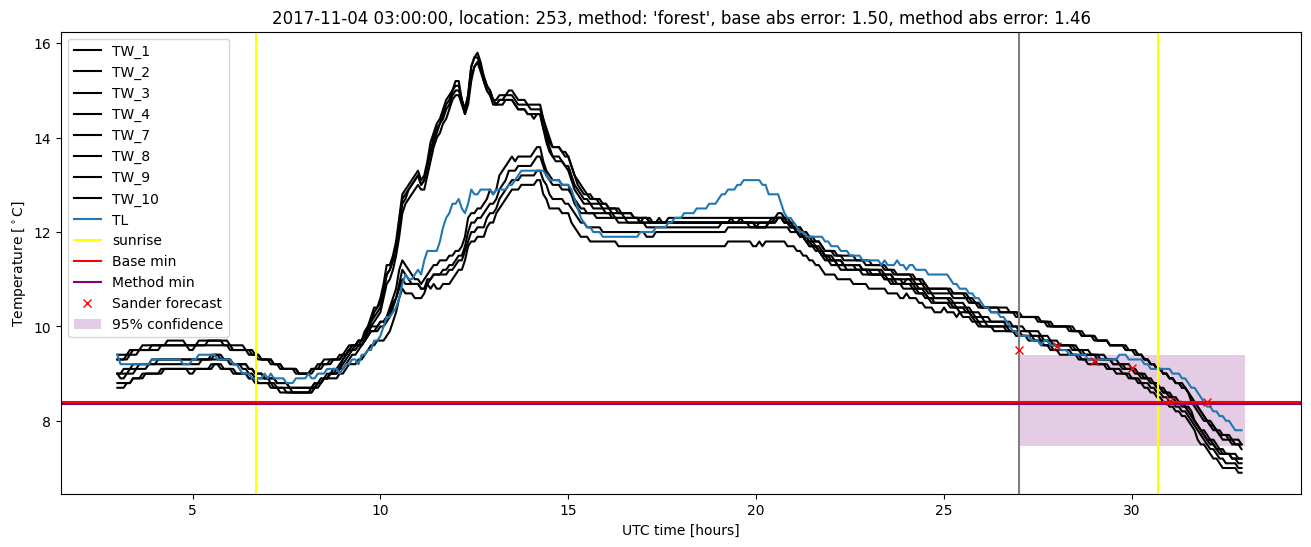
| forest |
winter 2017 |
0.958 |
0.000e+00 |
0.263 |
0.379 |
1.439 |
0.477 |
7.086 |
| baseline |
winter 2018 |
0.985 |
0.259 |
0.285 |
0.396 |
1.833 |
NaN |
NaN |
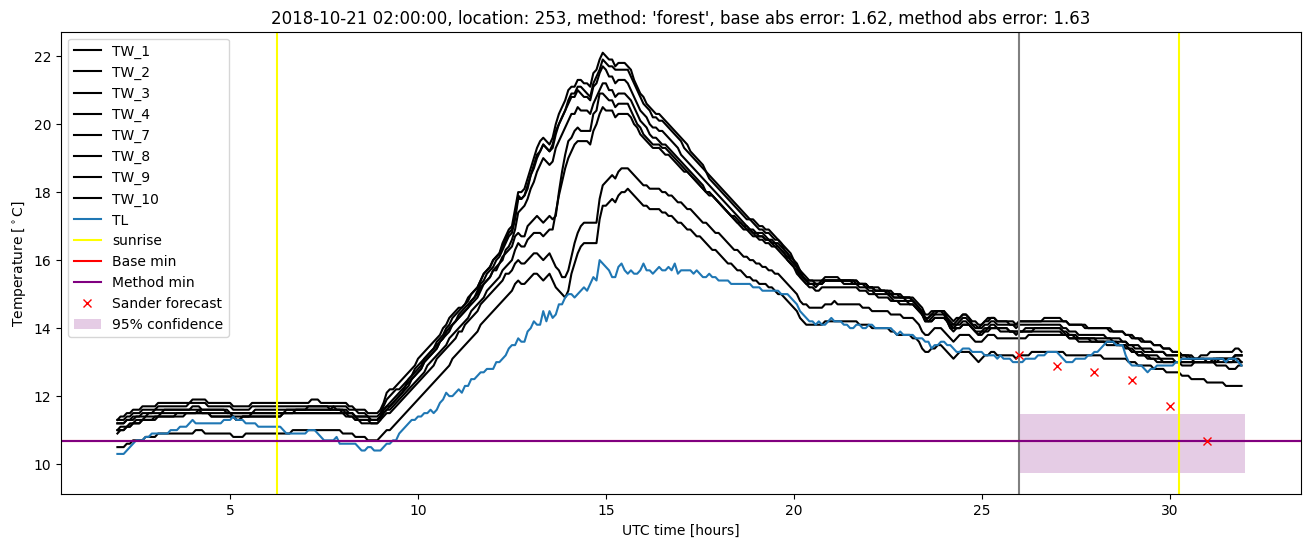
| forest |
winter 2018 |
0.985 |
0.222 |
0.222 |
0.352 |
1.976 |
0.503 |
4.921 |
| baseline |
winter 2019 |
0.993 |
0.000e+00 |
0.235 |
0.351 |
1.647 |
NaN |
NaN |
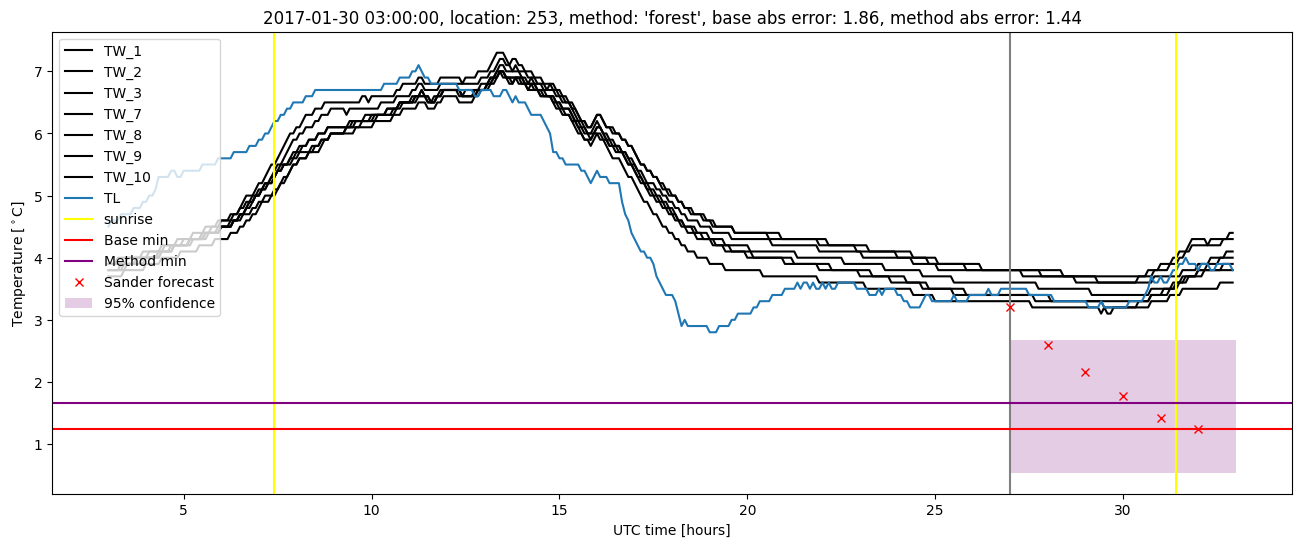
| forest |
winter 2019 |
0.993 |
0.067 |
0.205 |
0.324 |
1.633 |
0.479 |
5.289 |
| baseline |
all |
0.983 |
0.097 |
0.299 |
0.408 |
1.890 |
NaN |
NaN |
| forest |
all |
0.983 |
0.075 |
0.229 |
0.358 |
1.976 |
0.485 |
6.112 |
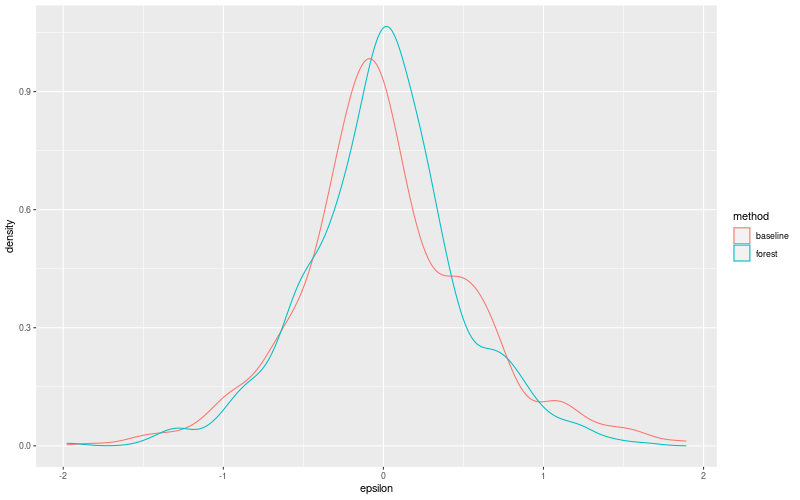
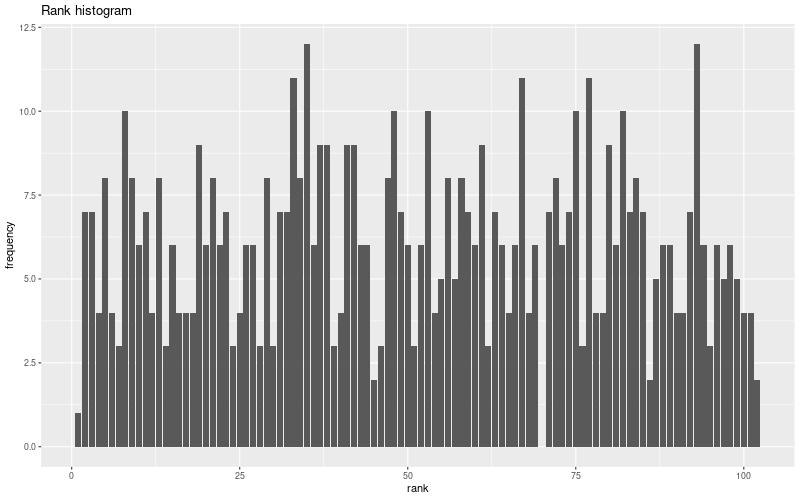
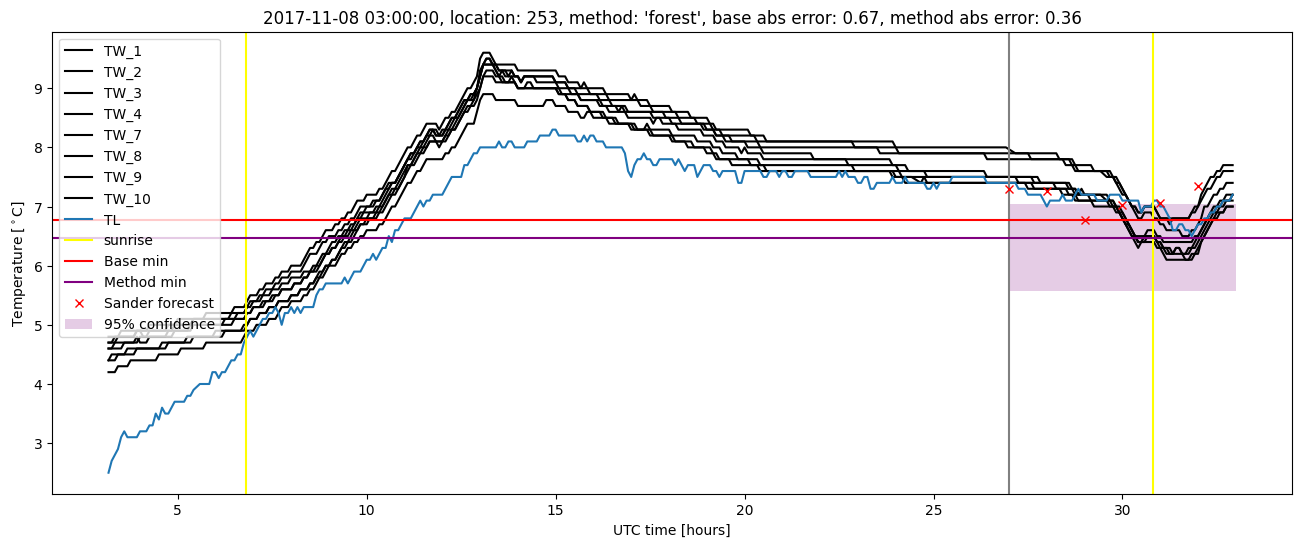
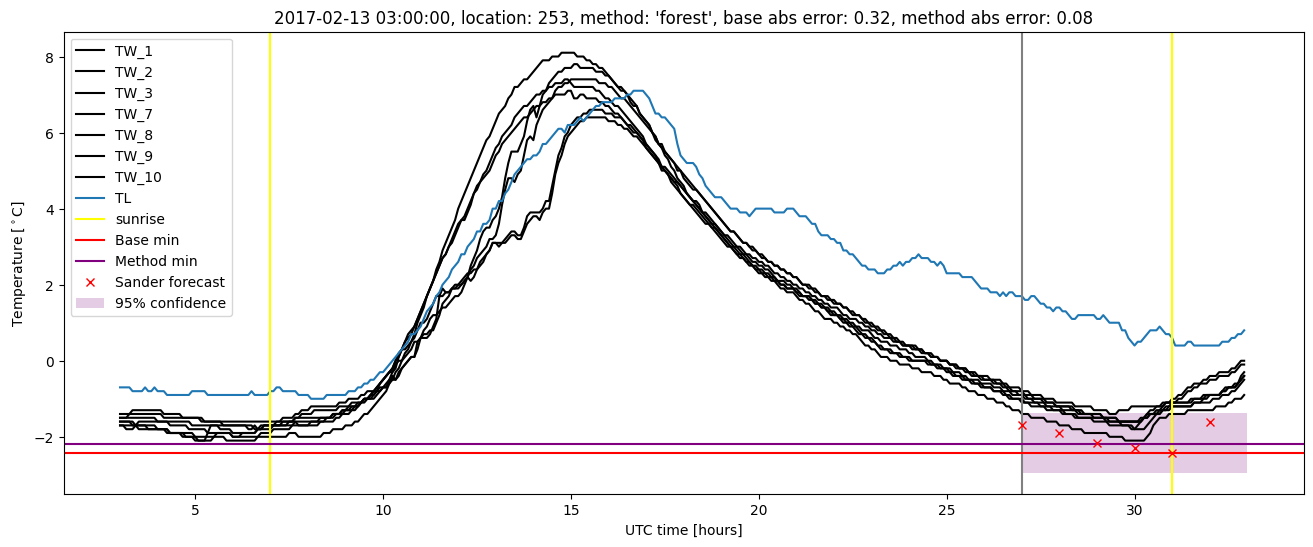
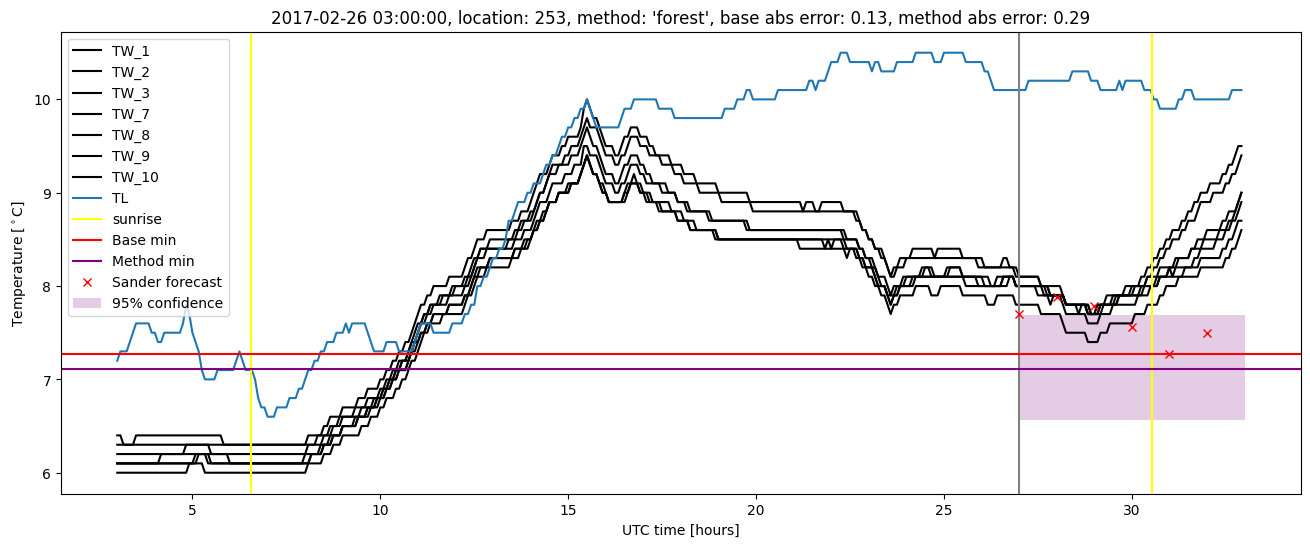
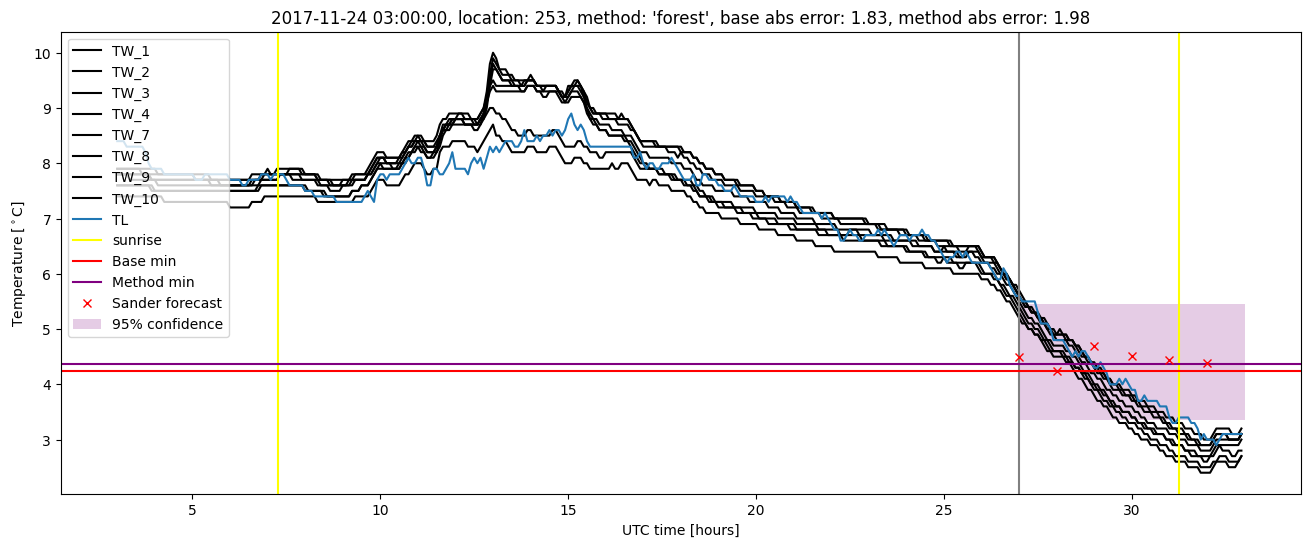
Random forest plots
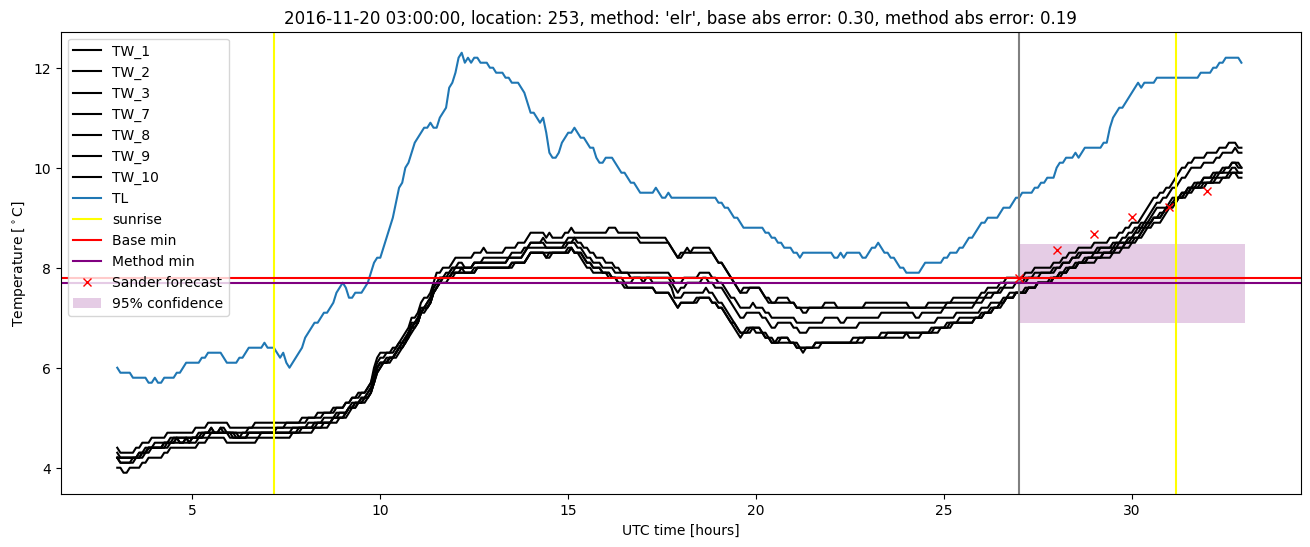
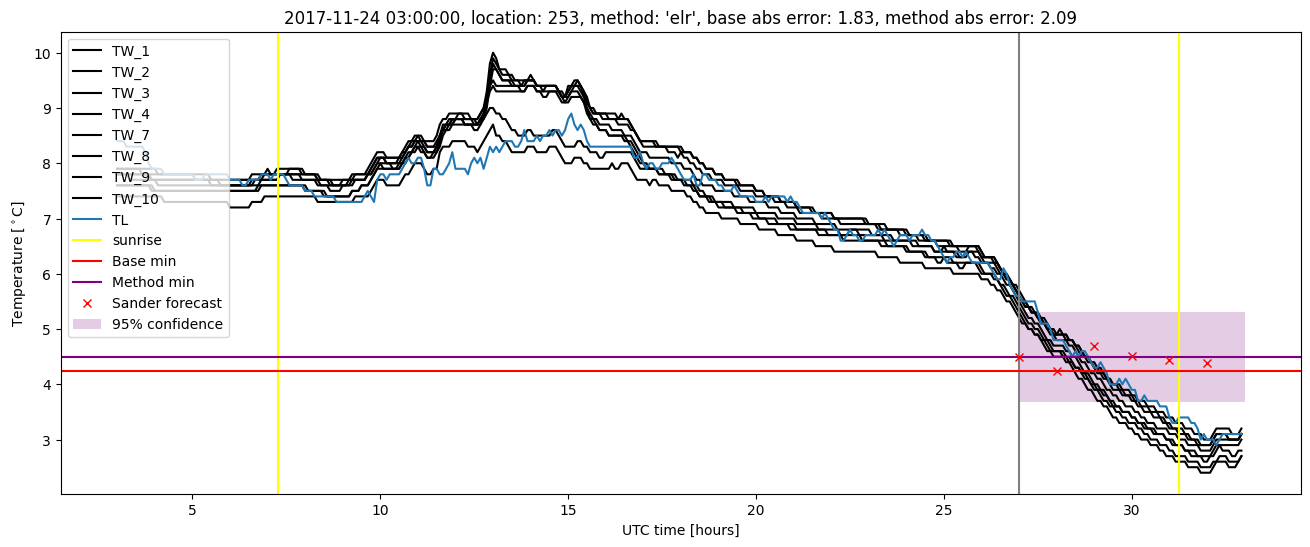
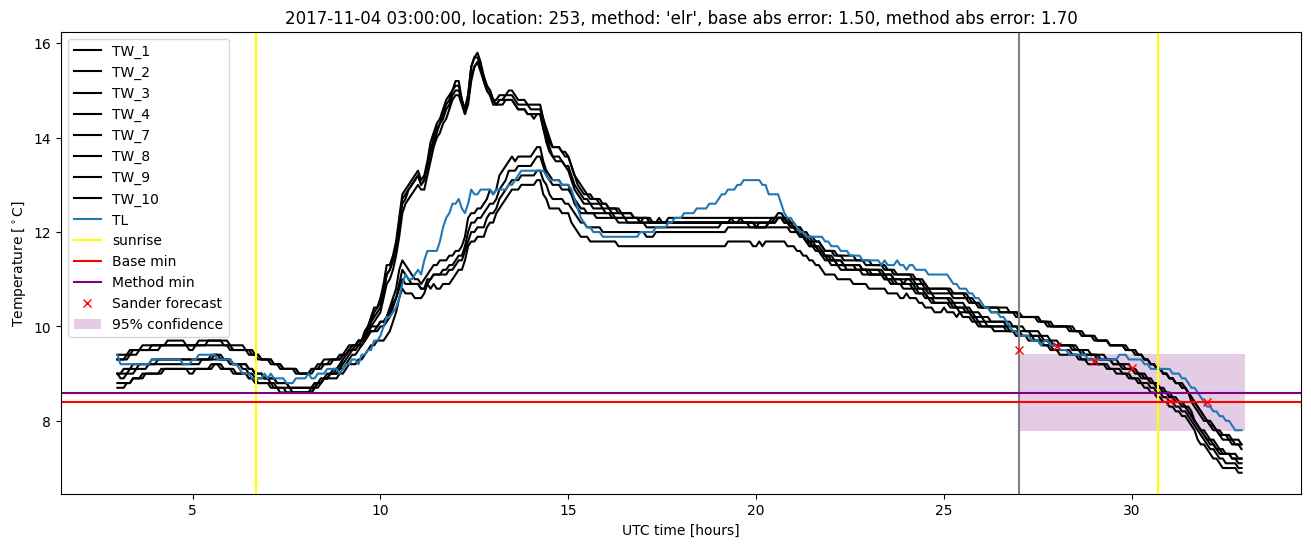
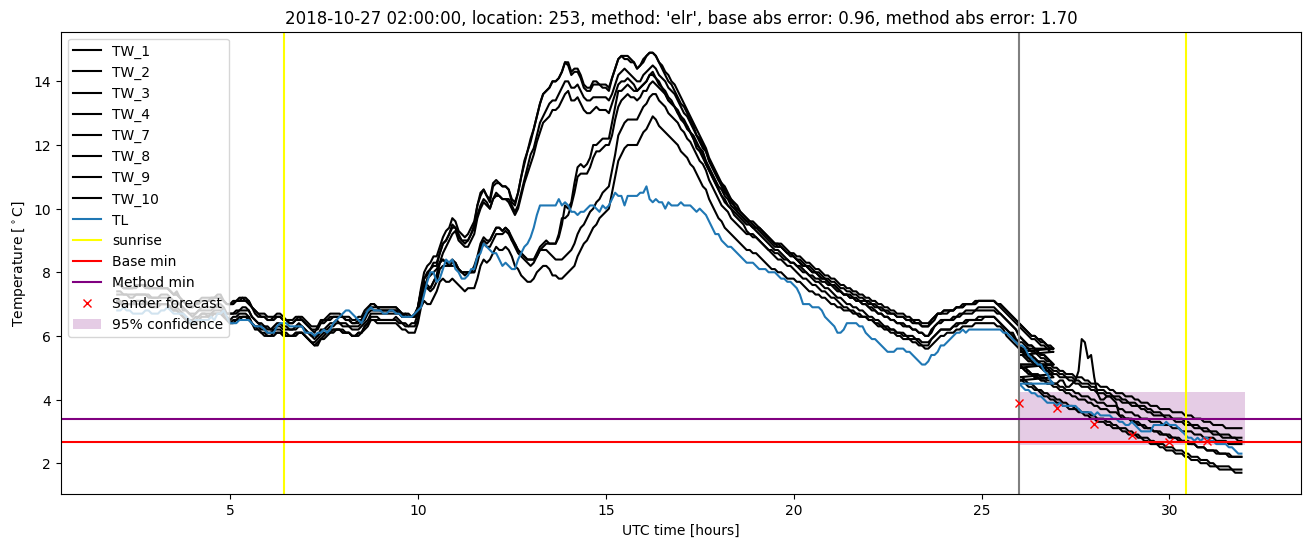
Extended logistic regression results
| names |
period |
power |
significance |
meanSquareError |
absError |
maxError |
CRPS |
IGN |
| baseline |
winter 2016 |
0.993 |
0.000e+00 |
0.304 |
0.433 |
1.571 |
NaN |
NaN |
| elr |
winter 2016 |
0.993 |
0.000e+00 |
0.261 |
0.410 |
1.317 |
0.558 |
6.375 |
| baseline |
winter 2017 |
0.958 |
0.061 |
0.373 |
0.452 |
1.890 |
NaN |
NaN |
| elr |
winter 2017 |
0.967 |
0.030 |
0.285 |
0.403 |
1.647 |
0.542 |
6.156 |
| baseline |
winter 2018 |
0.985 |
0.259 |
0.285 |
0.396 |
1.833 |
NaN |
NaN |
| elr |
winter 2018 |
0.985 |
0.222 |
0.261 |
0.385 |
2.091 |
0.536 |
5.370 |
| baseline |
winter 2019 |
0.993 |
0.000e+00 |
0.235 |
0.351 |
1.647 |
NaN |
NaN |
| elr |
winter 2019 |
0.993 |
0.067 |
0.233 |
0.356 |
1.696 |
0.496 |
4.371 |
| baseline |
all |
0.983 |
0.097 |
0.299 |
0.408 |
1.890 |
NaN |
NaN |
| elr |
all |
0.985 |
0.086 |
0.260 |
0.389 |
2.091 |
0.533 |
5.559 |
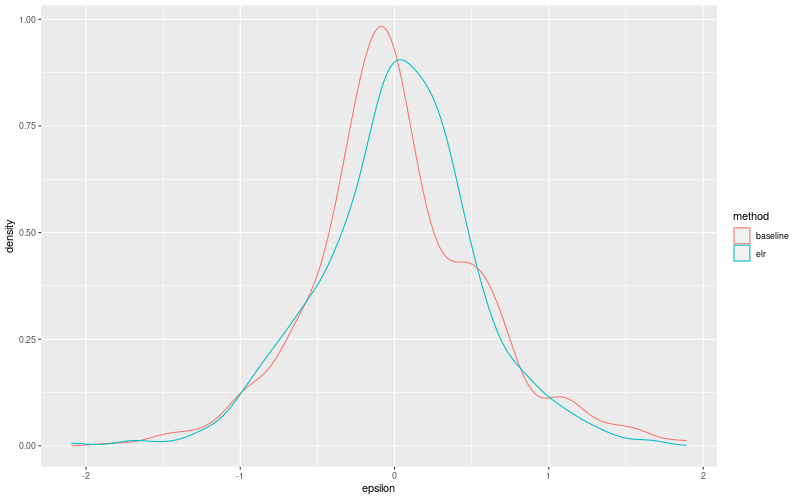
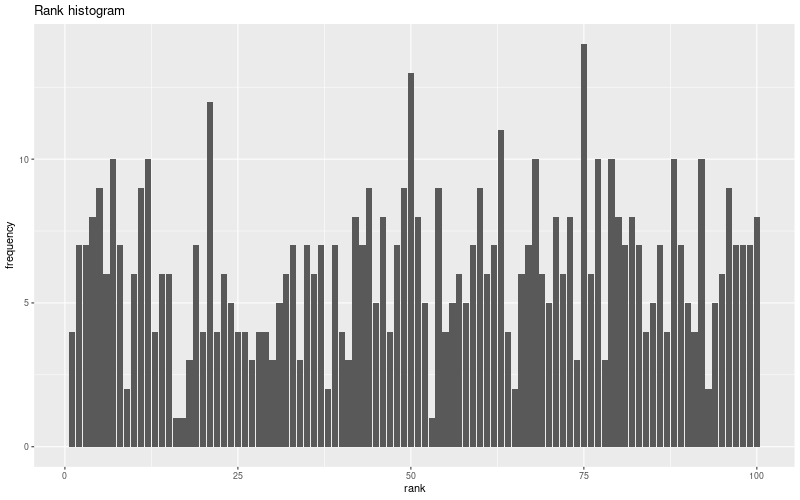
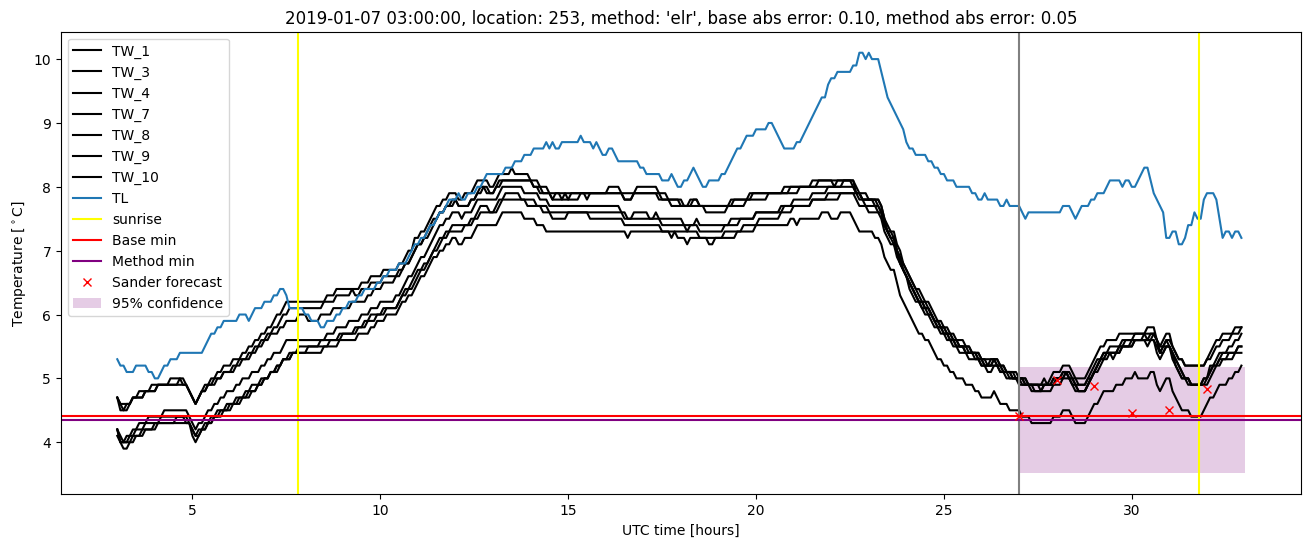
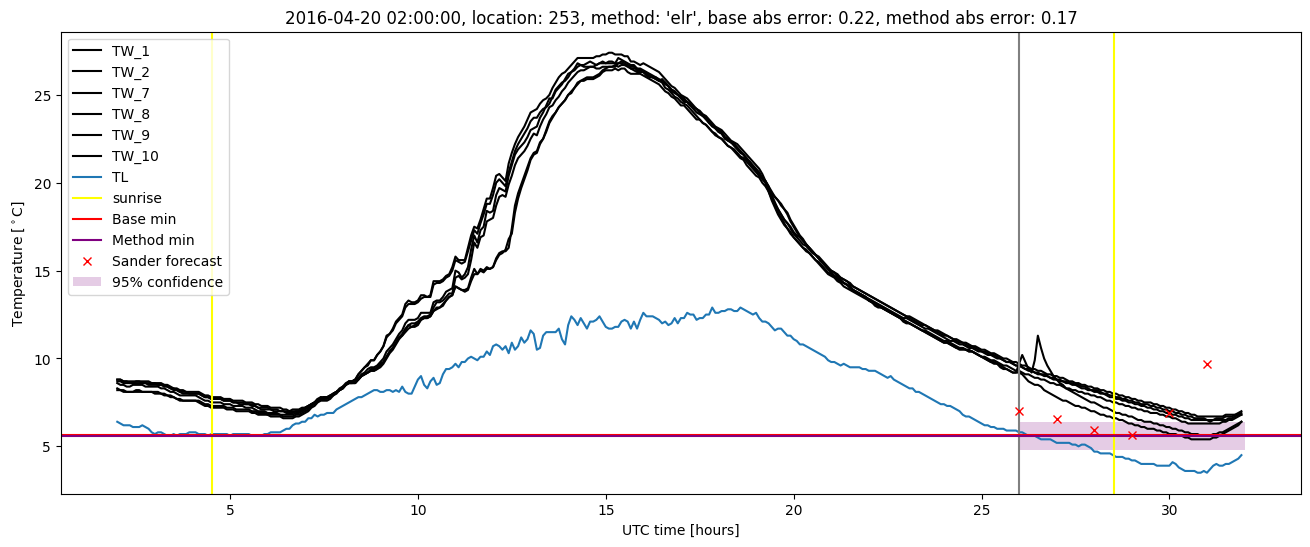
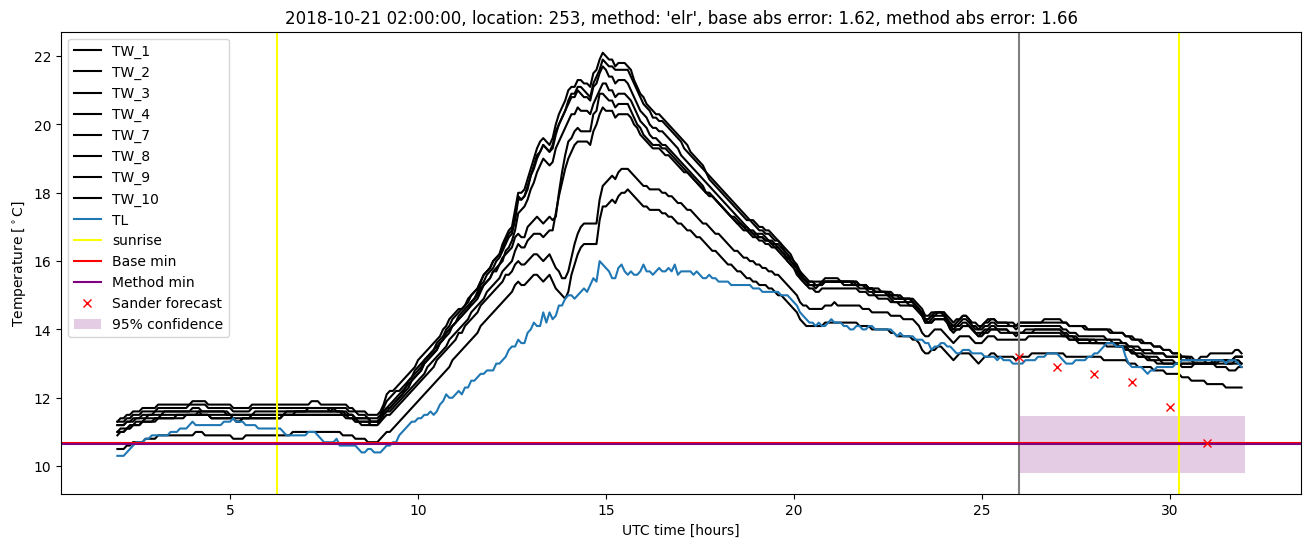
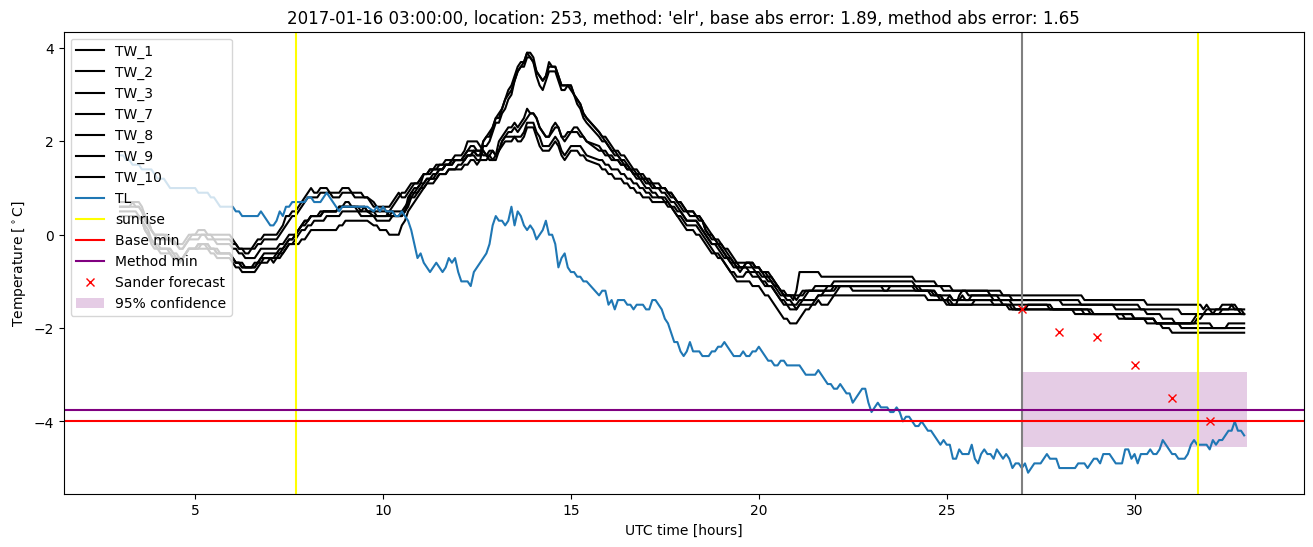
Extended logistic regression plots