GMS location: 252
Random forest results
| names |
period |
power |
significance |
meanSquareError |
absError |
maxError |
CRPS |
IGN |
| baseline |
winter 2016 |
0.989 |
0.167 |
0.338 |
0.445 |
2.155 |
NaN |
NaN |
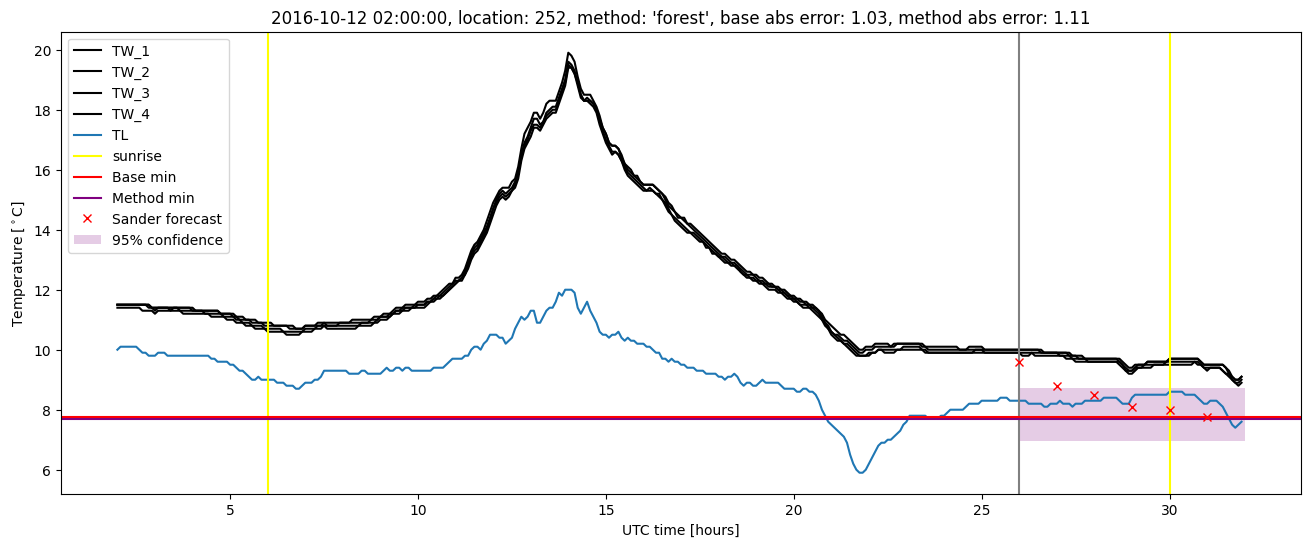
| forest |
winter 2016 |
0.995 |
0.167 |
0.321 |
0.442 |
1.956 |
0.585 |
2.038 |
| baseline |
winter 2017 |
0.957 |
0.028 |
0.465 |
0.480 |
2.410 |
NaN |
NaN |
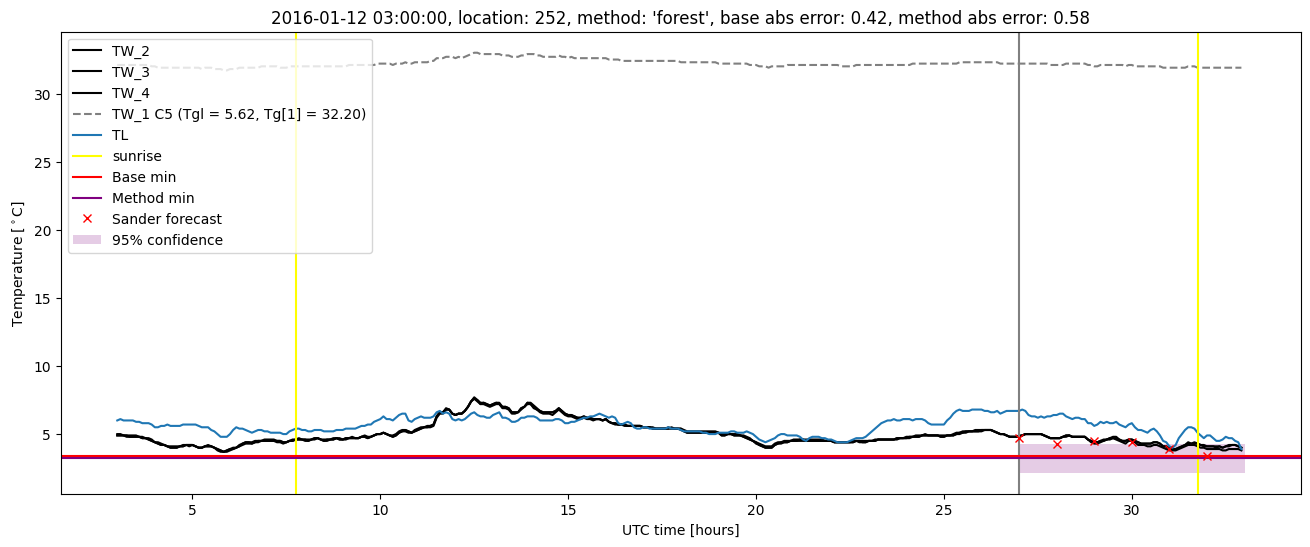
| forest |
winter 2017 |
0.949 |
0.028 |
0.373 |
0.443 |
1.971 |
0.488 |
2.027 |
| baseline |
winter 2018 |
0.993 |
0.081 |
1.205 |
0.528 |
1.168e+01 |
NaN |
NaN |
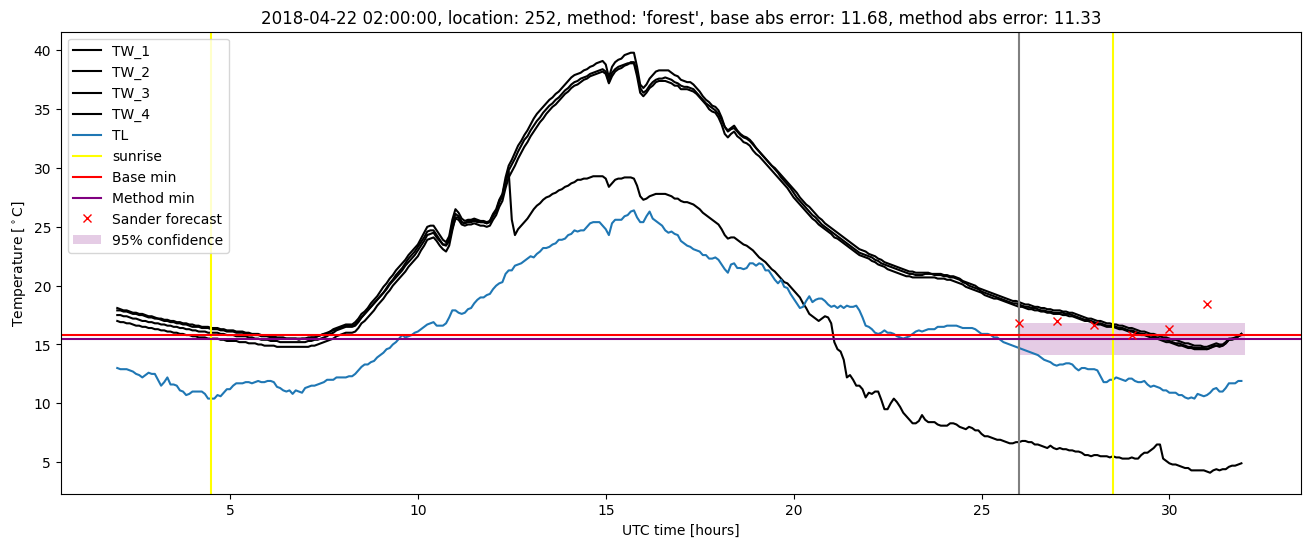
| forest |
winter 2018 |
0.993 |
0.027 |
1.105 |
0.475 |
1.133e+01 |
0.518 |
2.067 |
| baseline |
winter 2019 |
0.991 |
0.105 |
1.332 |
0.576 |
1.007e+01 |
NaN |
NaN |
| forest |
winter 2019 |
0.991 |
0.105 |
1.446 |
0.596 |
1.002e+01 |
0.645 |
2.546 |
| baseline |
all |
0.984 |
0.082 |
0.796 |
0.502 |
1.168e+01 |
NaN |
NaN |
| forest |
all |
0.984 |
0.064 |
0.767 |
0.482 |
1.133e+01 |
0.557 |
2.147 |
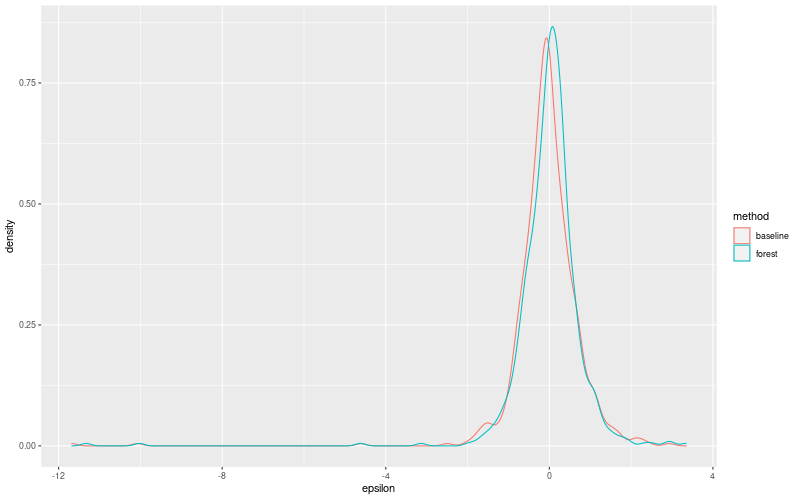
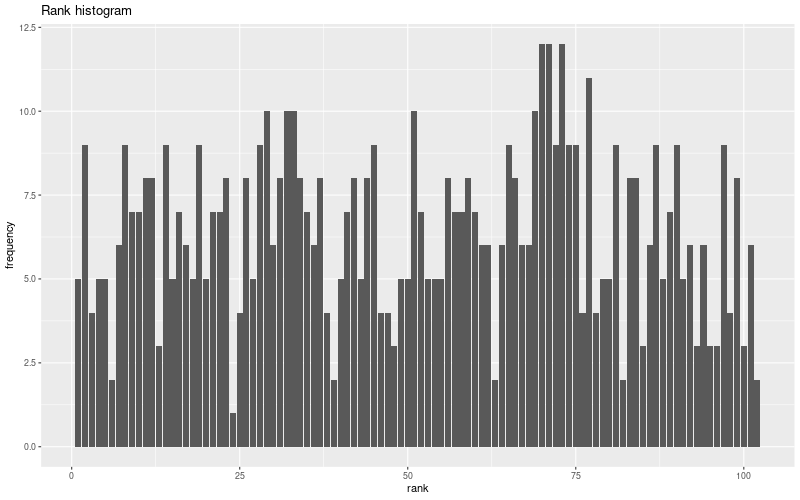
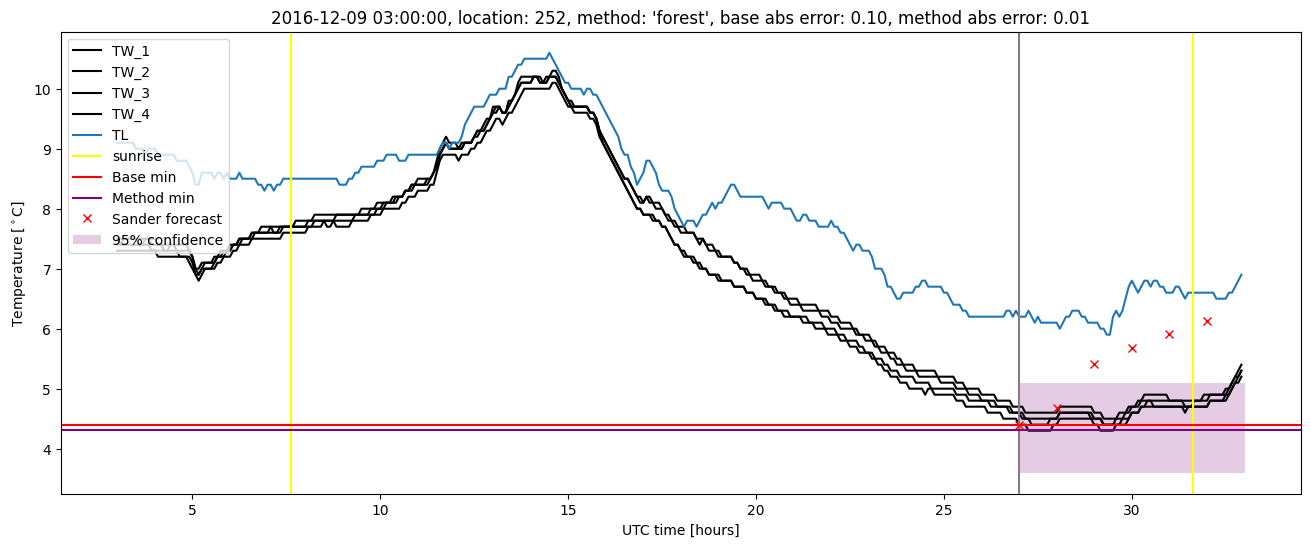
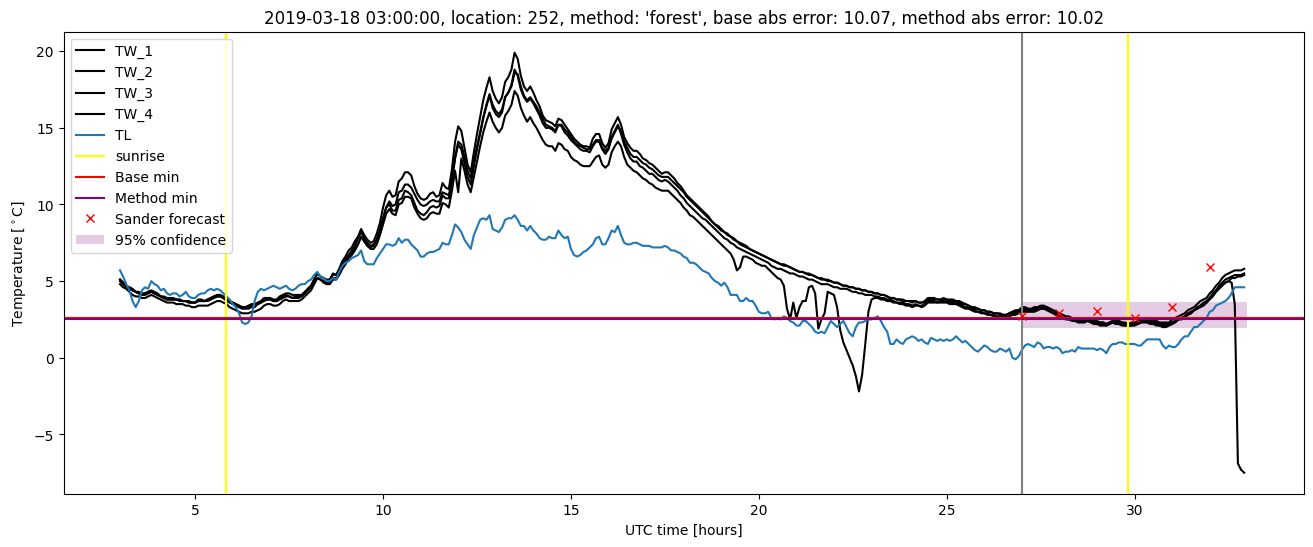
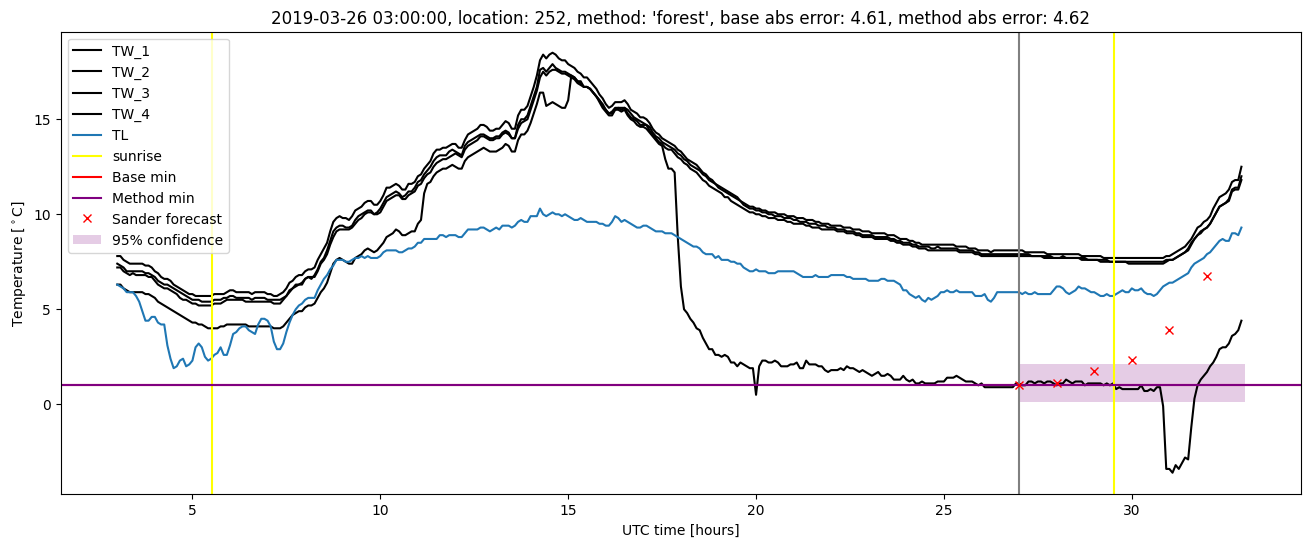
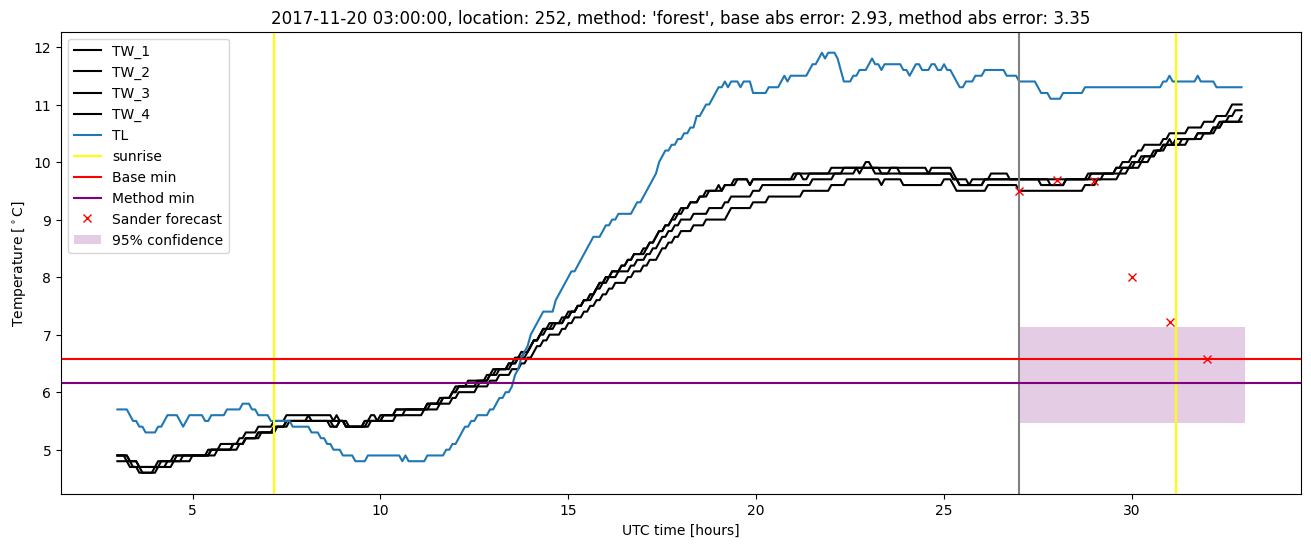
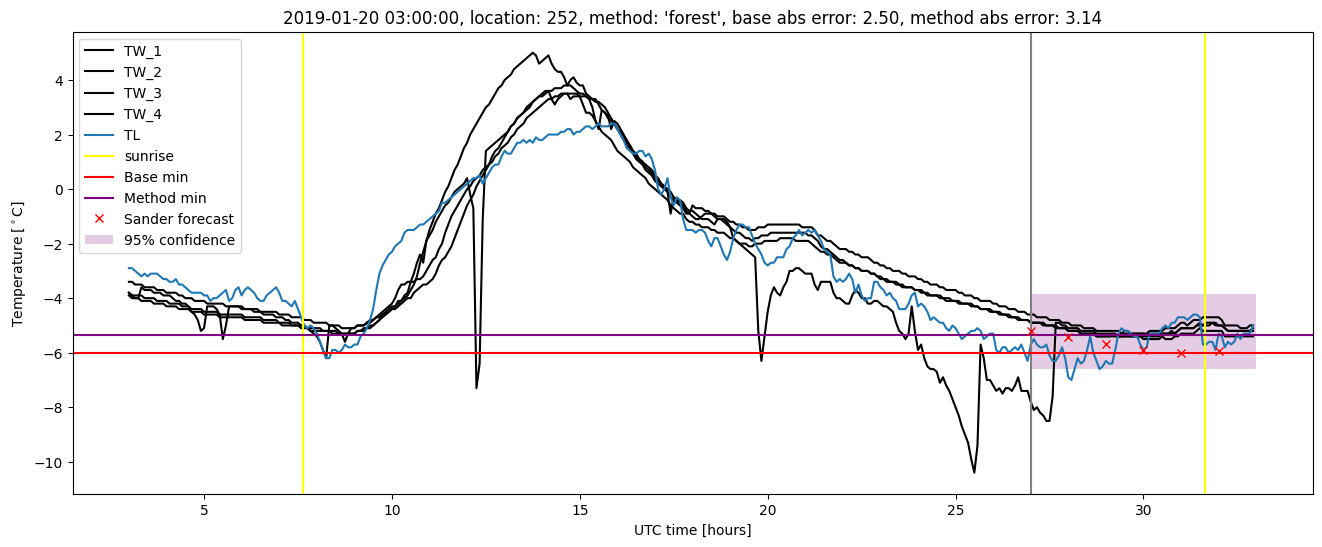
Random forest plots
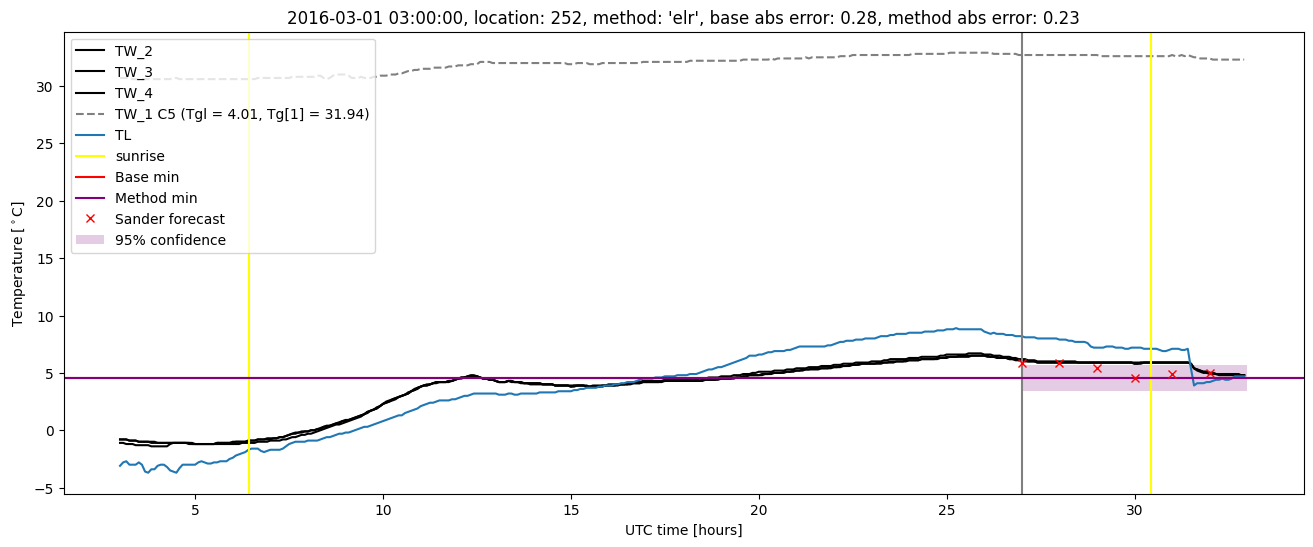
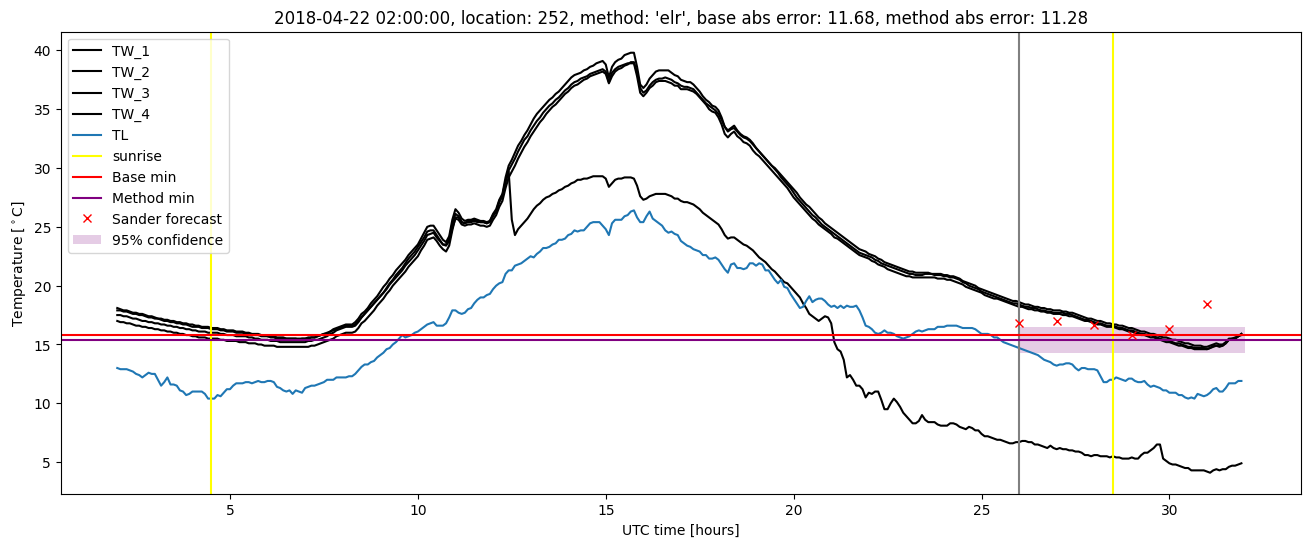
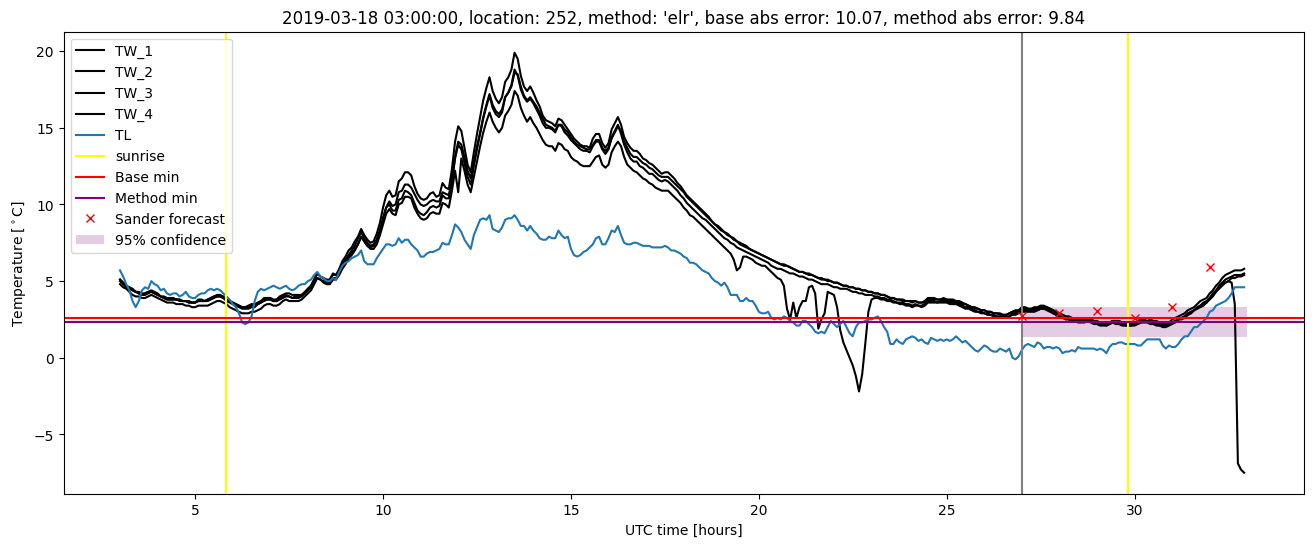
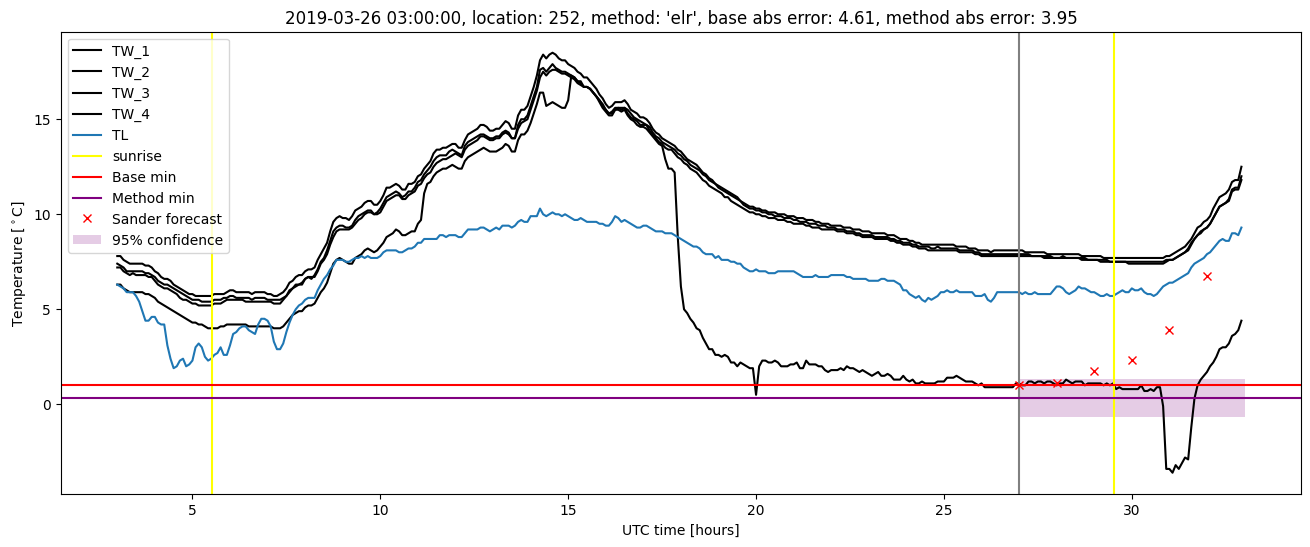
Extended logistic regression results
| names |
period |
power |
significance |
meanSquareError |
absError |
maxError |
CRPS |
IGN |
| baseline |
winter 2016 |
0.989 |
0.167 |
0.338 |
0.445 |
2.155 |
NaN |
NaN |
| elr |
winter 2016 |
1.000 |
0.111 |
0.344 |
0.469 |
2.062 |
0.509 |
1.808 |
| baseline |
winter 2017 |
0.957 |
0.028 |
0.465 |
0.480 |
2.410 |
NaN |
NaN |
| elr |
winter 2017 |
0.949 |
0.028 |
0.396 |
0.458 |
2.111 |
0.504 |
1.973 |
| baseline |
winter 2018 |
0.993 |
0.081 |
1.205 |
0.528 |
1.168e+01 |
NaN |
NaN |
| elr |
winter 2018 |
0.993 |
0.108 |
1.120 |
0.506 |
1.128e+01 |
0.518 |
2.208 |
| baseline |
winter 2019 |
0.991 |
0.105 |
1.332 |
0.576 |
1.007e+01 |
NaN |
NaN |
| elr |
winter 2019 |
0.991 |
0.158 |
1.242 |
0.579 |
9.837 |
0.545 |
2.952 |
| baseline |
all |
0.984 |
0.082 |
0.796 |
0.502 |
1.168e+01 |
NaN |
NaN |
| elr |
all |
0.985 |
0.091 |
0.741 |
0.498 |
1.128e+01 |
0.518 |
2.184 |
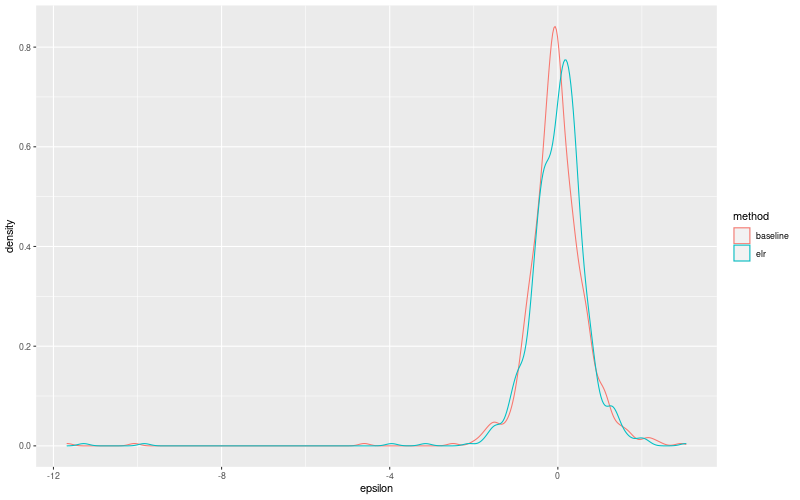
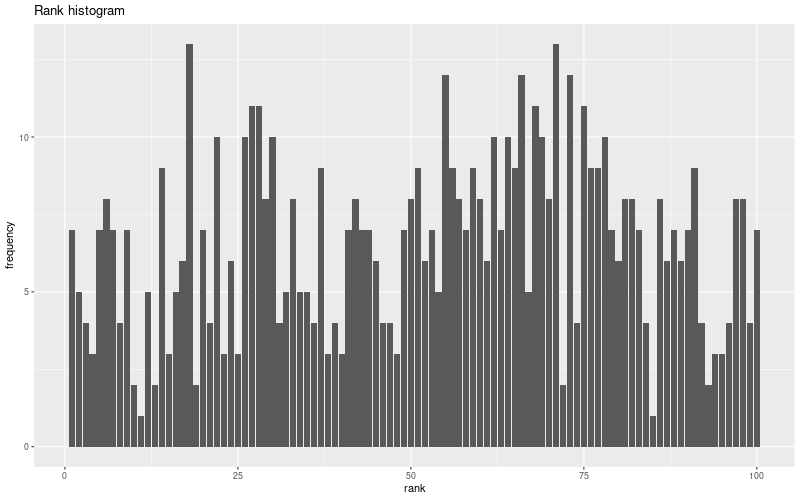
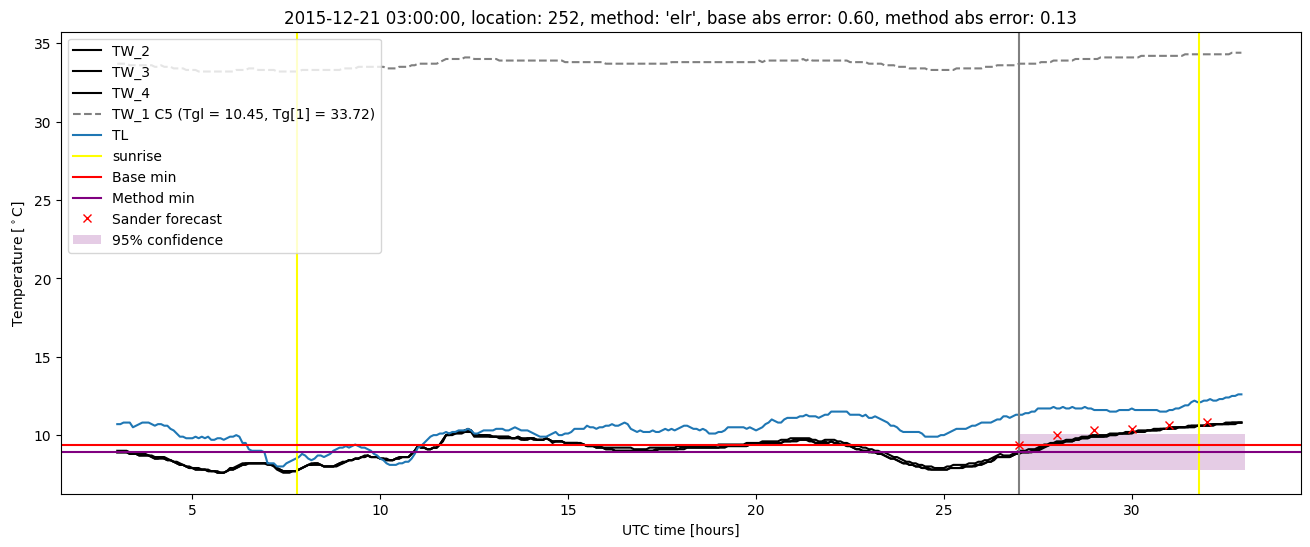
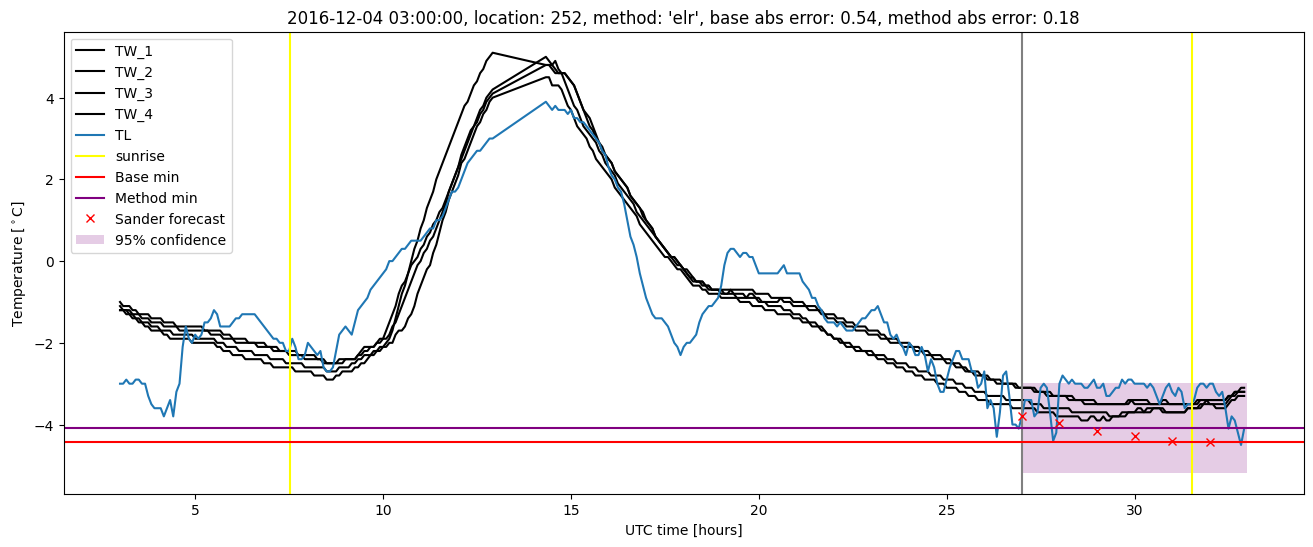
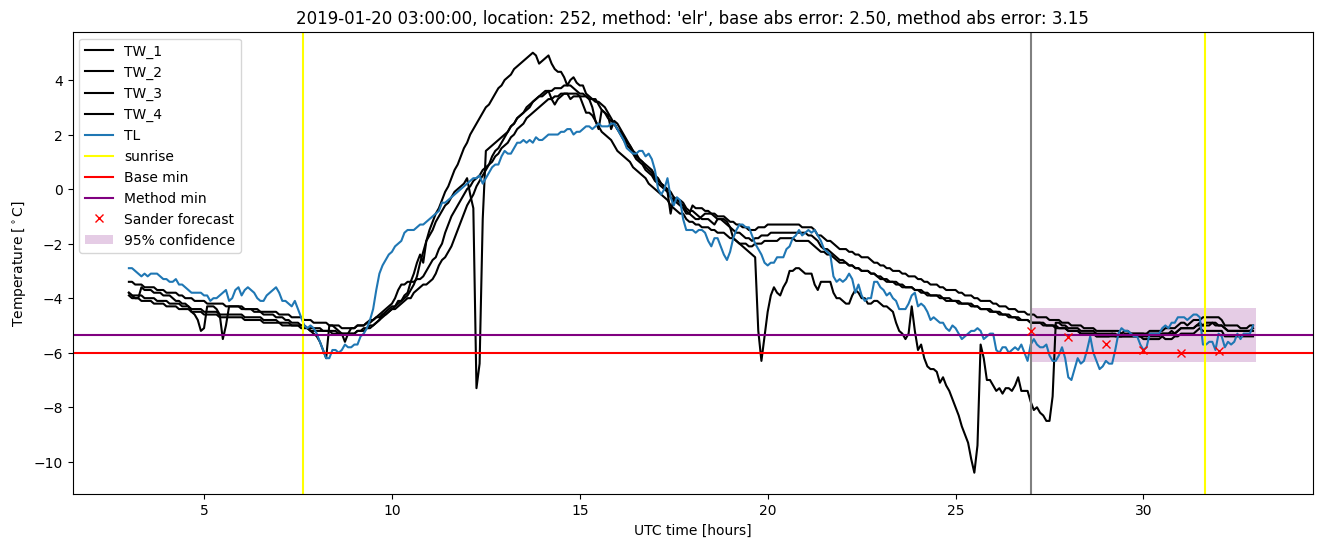
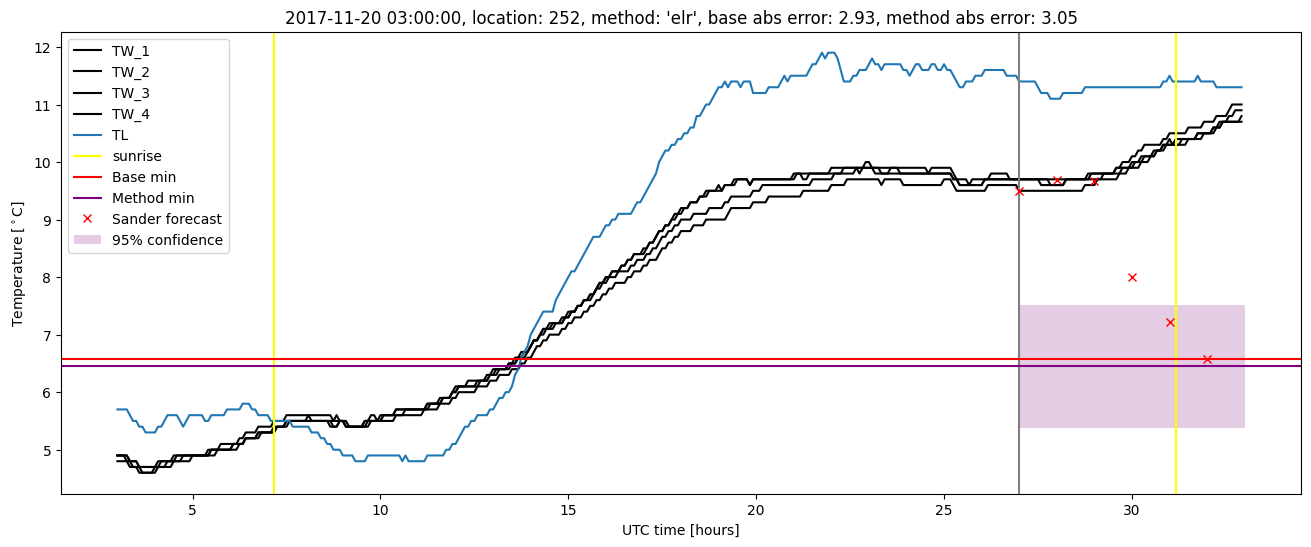
Extended logistic regression plots