GMS location: 251
Random forest results
| names |
period |
power |
significance |
meanSquareError |
absError |
maxError |
CRPS |
IGN |
| baseline |
winter 2016 |
0.994 |
0.250 |
0.423 |
0.496 |
2.001 |
NaN |
NaN |
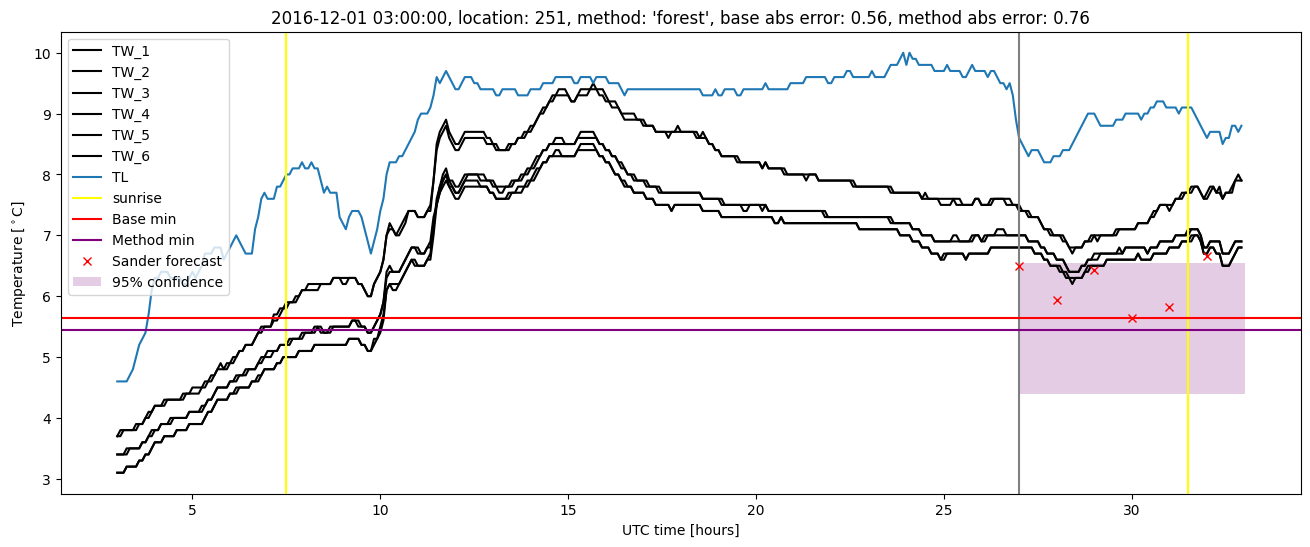
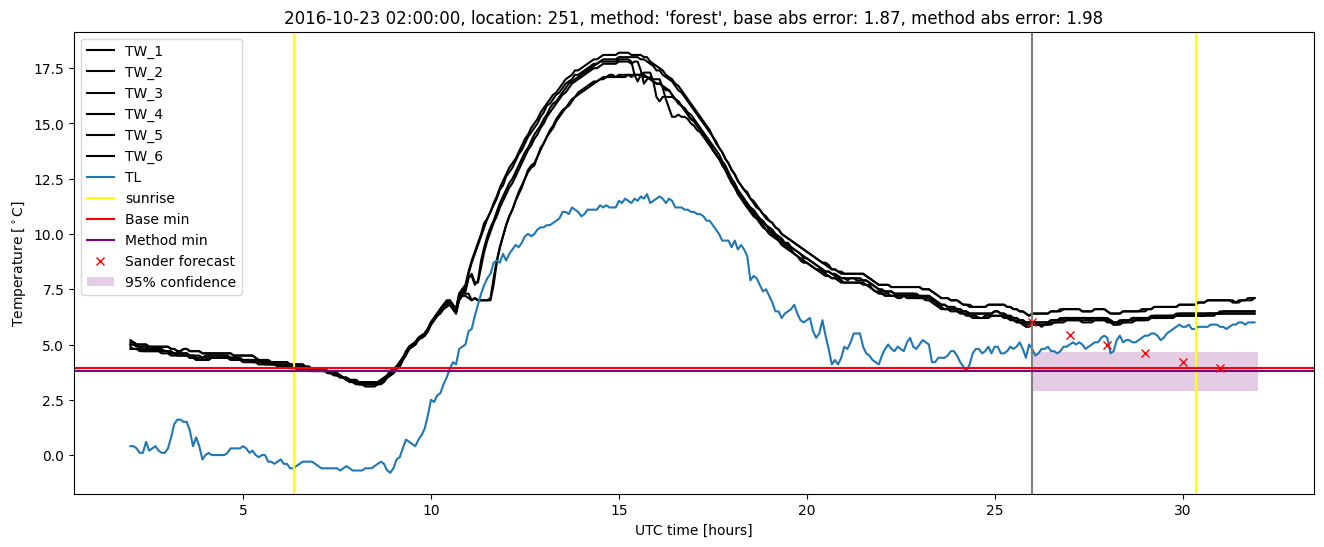
| forest |
winter 2016 |
0.994 |
0.107 |
0.357 |
0.458 |
1.928 |
0.608 |
3.374 |
| baseline |
winter 2017 |
1.000 |
0.119 |
0.486 |
0.493 |
2.205 |
NaN |
NaN |
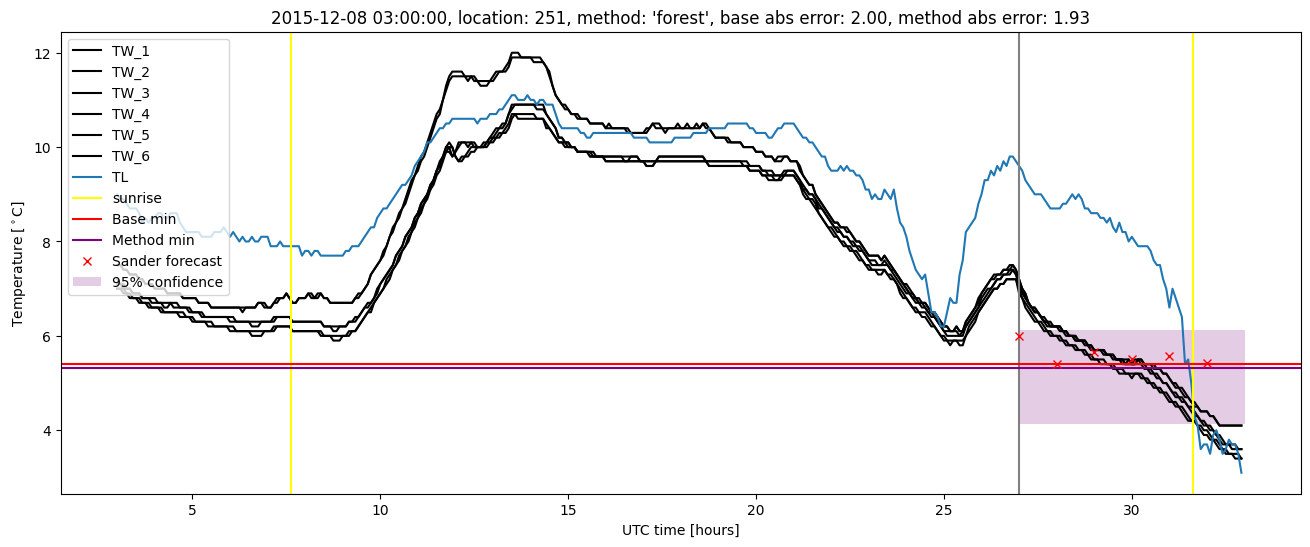
| forest |
winter 2017 |
0.973 |
0.071 |
0.394 |
0.458 |
2.022 |
0.582 |
3.374 |
| baseline |
winter 2018 |
1.000 |
0.088 |
0.466 |
0.497 |
2.152 |
NaN |
NaN |
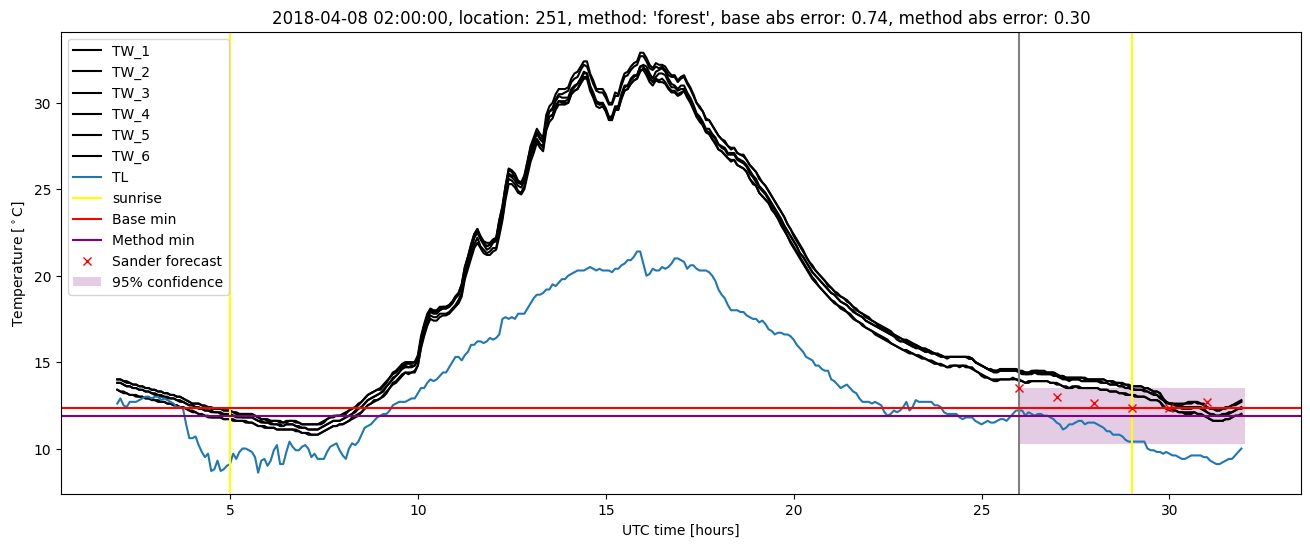
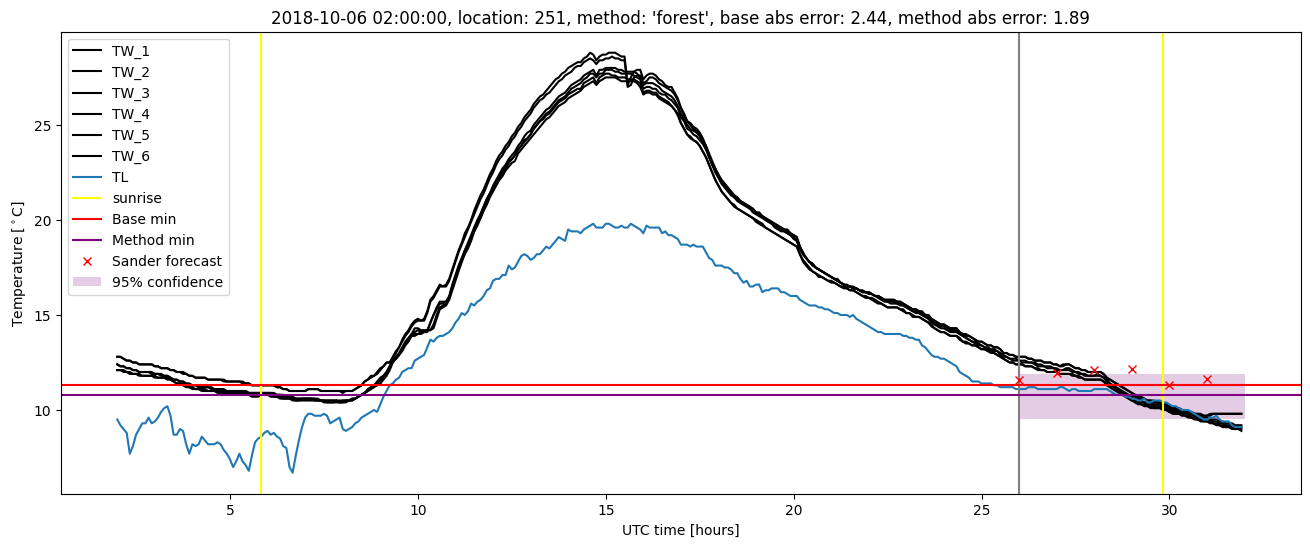
| forest |
winter 2018 |
0.986 |
0.029 |
0.334 |
0.444 |
1.646 |
0.613 |
3.027 |
| baseline |
winter 2019 |
0.994 |
0.000e+00 |
0.386 |
0.463 |
2.441 |
NaN |
NaN |
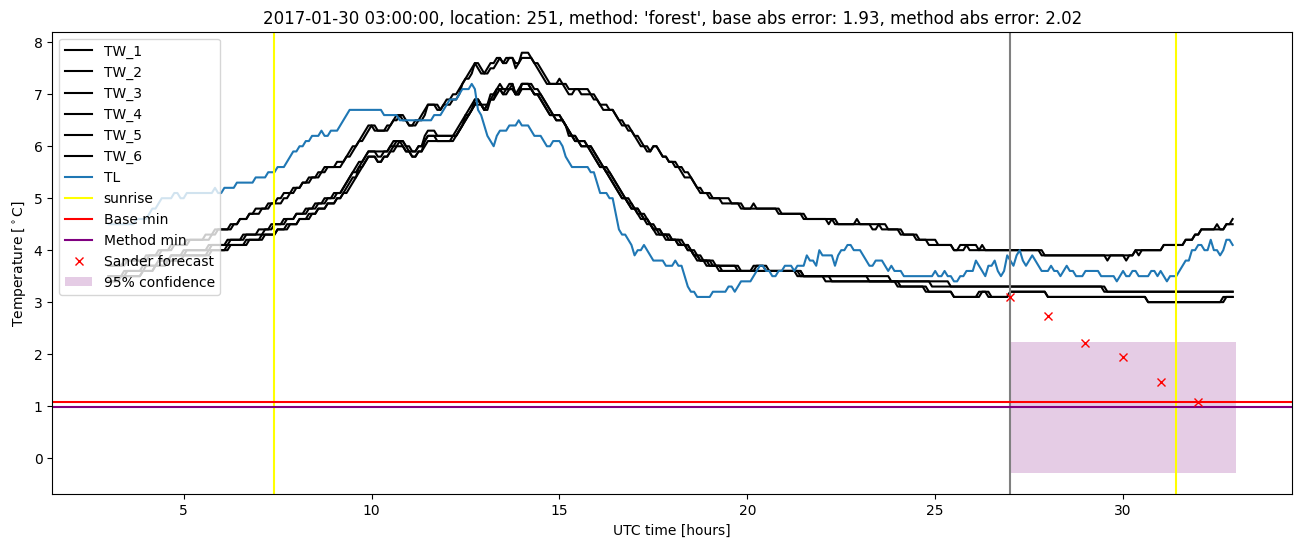
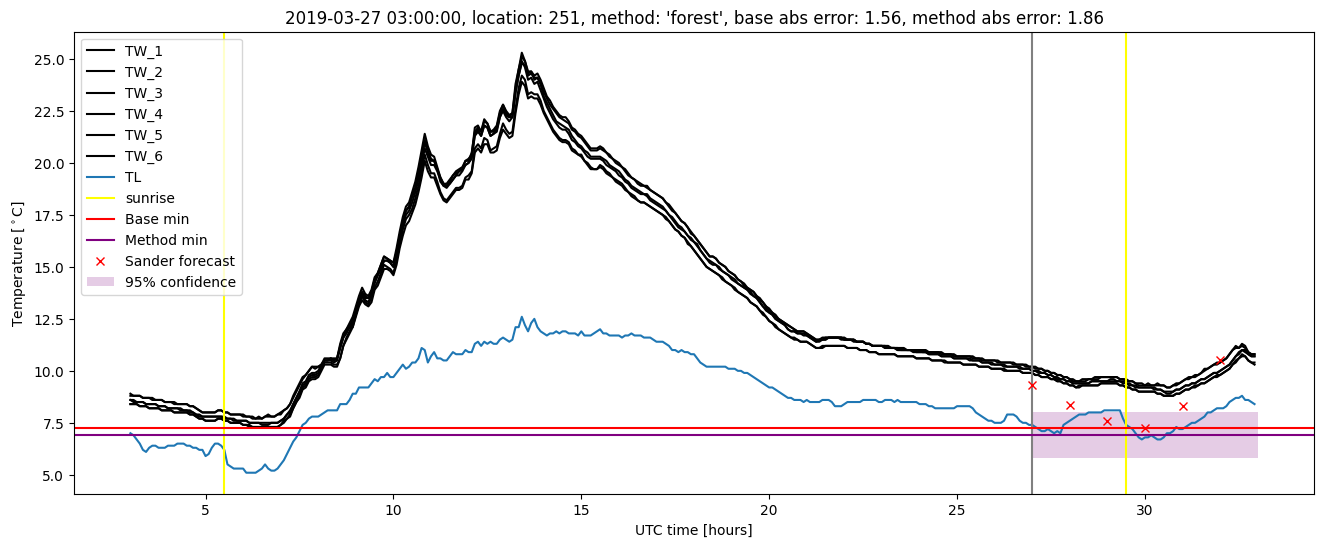
| forest |
winter 2019 |
0.987 |
0.000e+00 |
0.312 |
0.408 |
1.893 |
0.607 |
3.291 |
| baseline |
all |
0.997 |
0.129 |
0.439 |
0.488 |
2.441 |
NaN |
NaN |
| forest |
all |
0.986 |
0.060 |
0.348 |
0.443 |
2.022 |
0.603 |
3.267 |
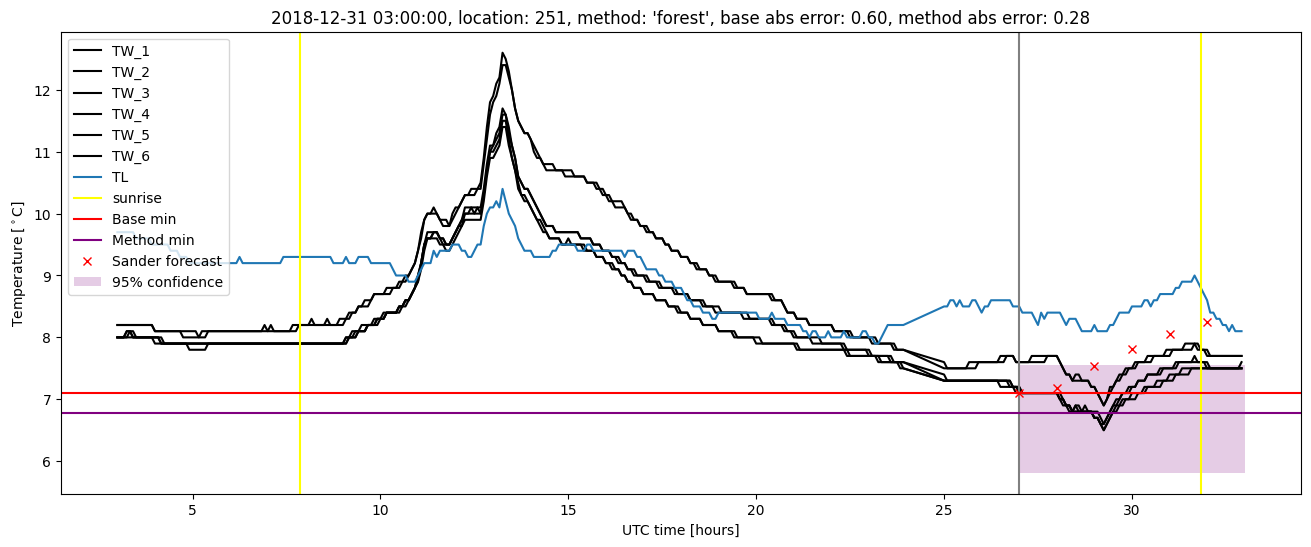
Random forest plots
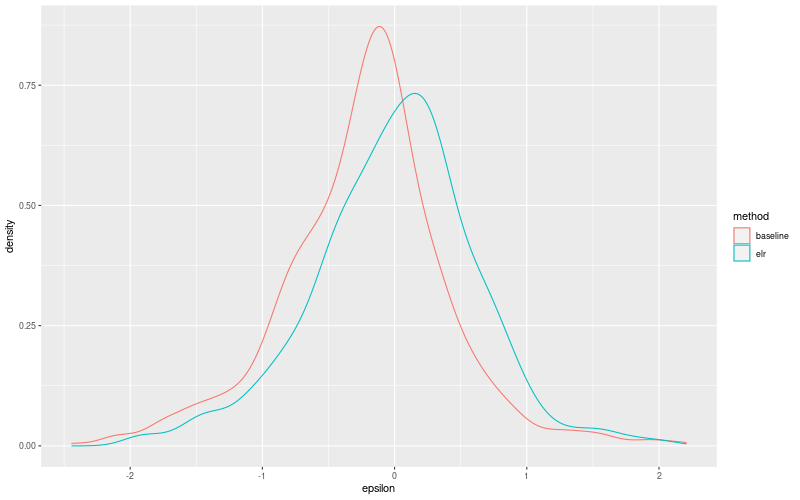
Extended logistic regression results
| names |
period |
power |
significance |
meanSquareError |
absError |
maxError |
CRPS |
IGN |
| baseline |
winter 2016 |
0.994 |
0.250 |
0.423 |
0.496 |
2.001 |
NaN |
NaN |
| elr |
winter 2016 |
0.989 |
0.143 |
0.385 |
0.496 |
1.925 |
0.669 |
5.146 |
| baseline |
winter 2017 |
1.000 |
0.119 |
0.486 |
0.493 |
2.205 |
NaN |
NaN |
| elr |
winter 2017 |
1.000 |
0.095 |
0.428 |
0.477 |
2.093 |
0.607 |
4.019 |
| baseline |
winter 2018 |
1.000 |
0.088 |
0.466 |
0.497 |
2.152 |
NaN |
NaN |
| elr |
winter 2018 |
1.000 |
0.059 |
0.384 |
0.476 |
1.947 |
0.644 |
4.495 |
| baseline |
winter 2019 |
0.994 |
0.000e+00 |
0.386 |
0.463 |
2.441 |
NaN |
NaN |
| elr |
winter 2019 |
0.994 |
0.000e+00 |
0.344 |
0.447 |
1.959 |
0.614 |
3.707 |
| baseline |
all |
0.997 |
0.129 |
0.439 |
0.488 |
2.441 |
NaN |
NaN |
| elr |
all |
0.995 |
0.086 |
0.385 |
0.475 |
2.093 |
0.636 |
4.397 |
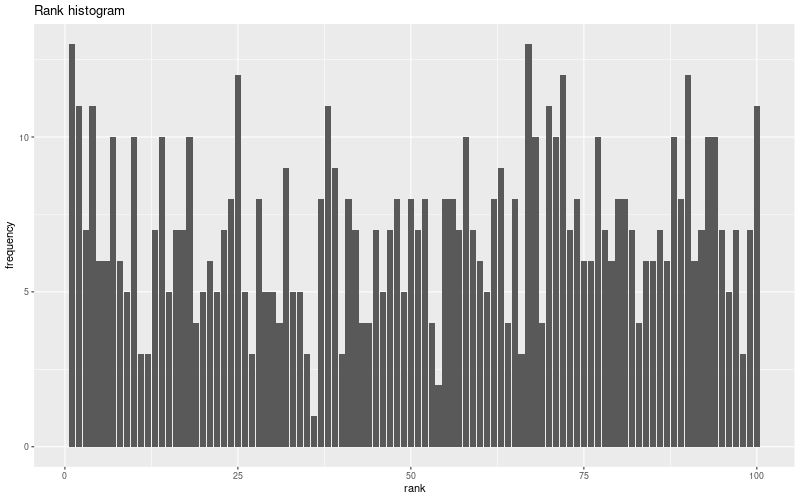
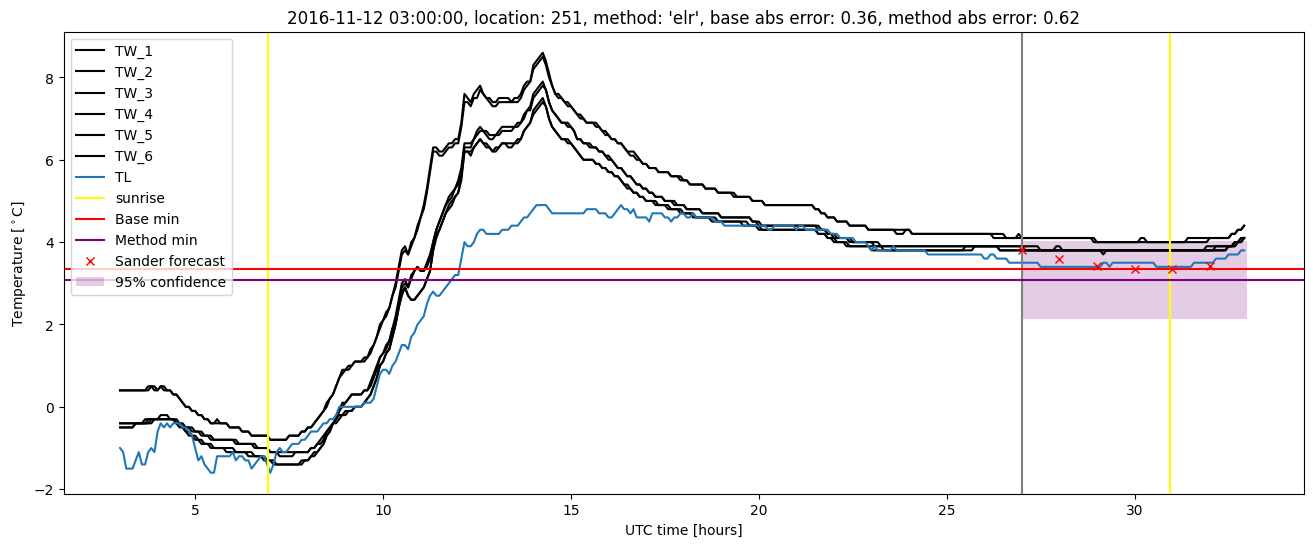
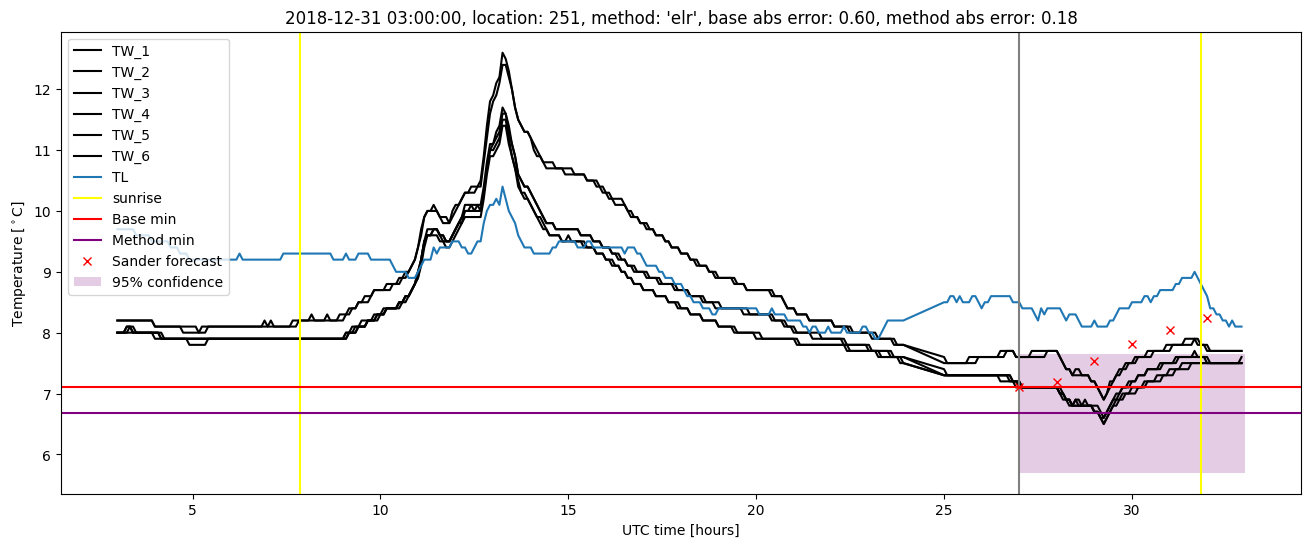
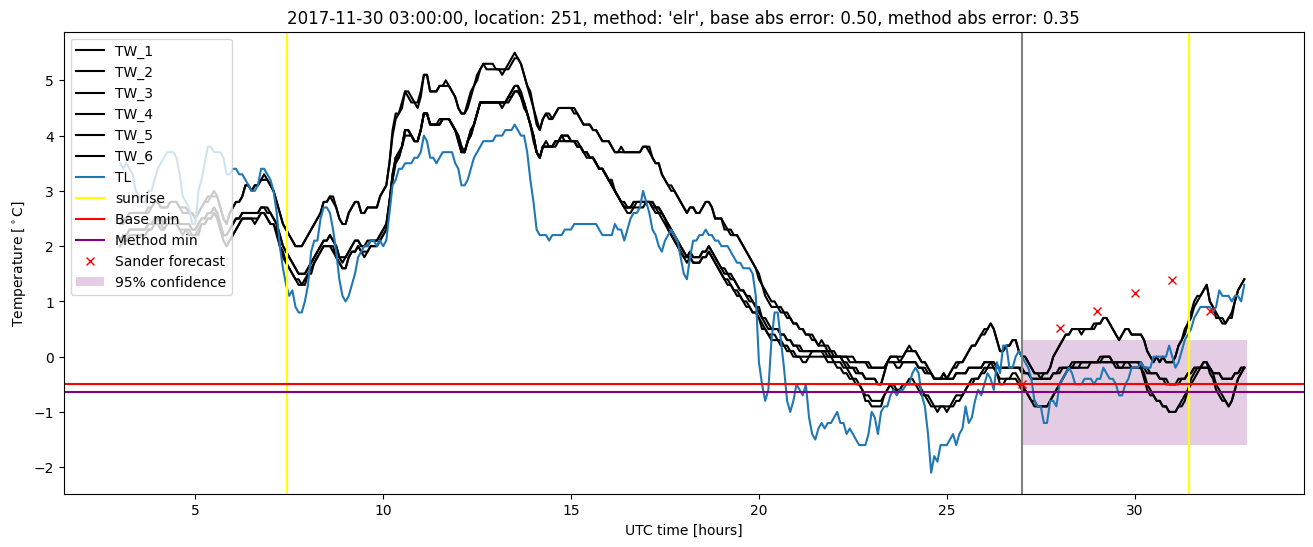
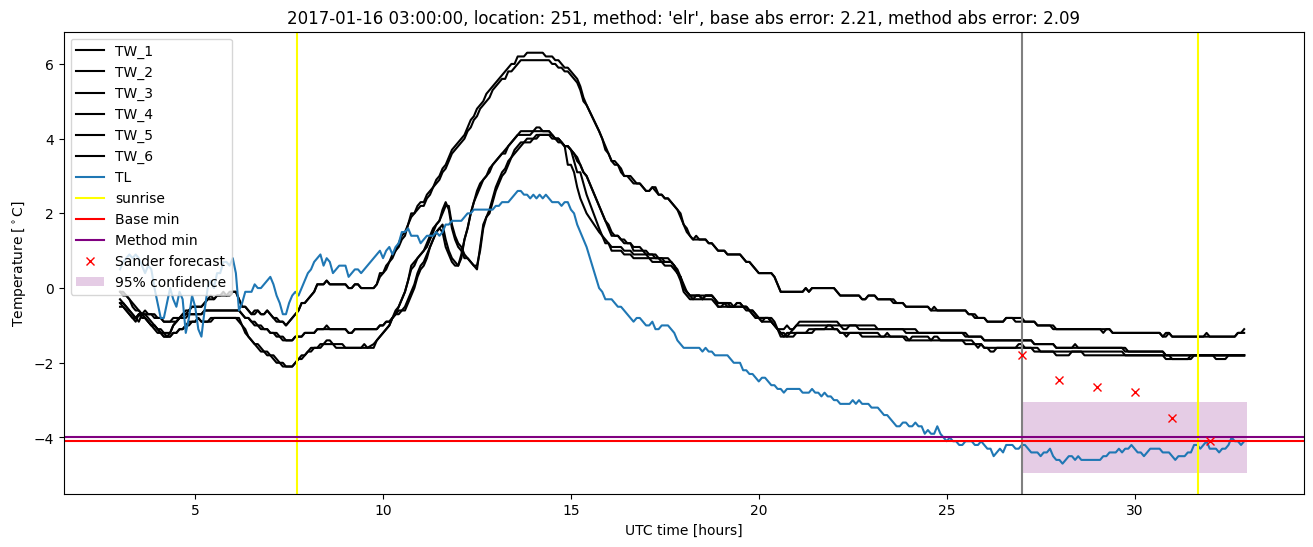
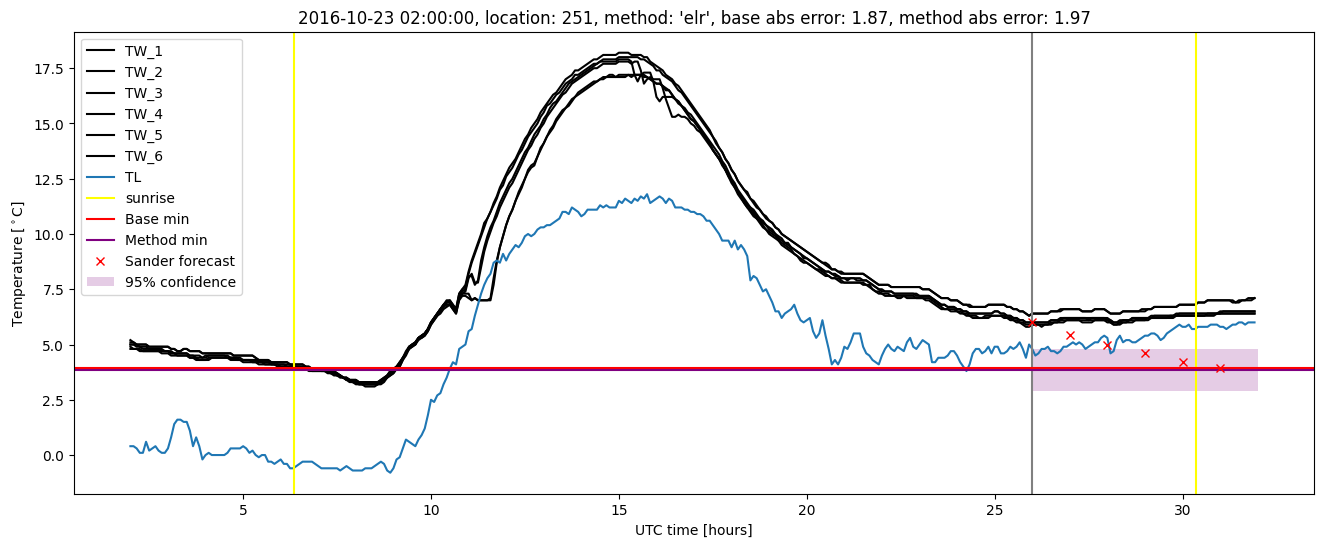
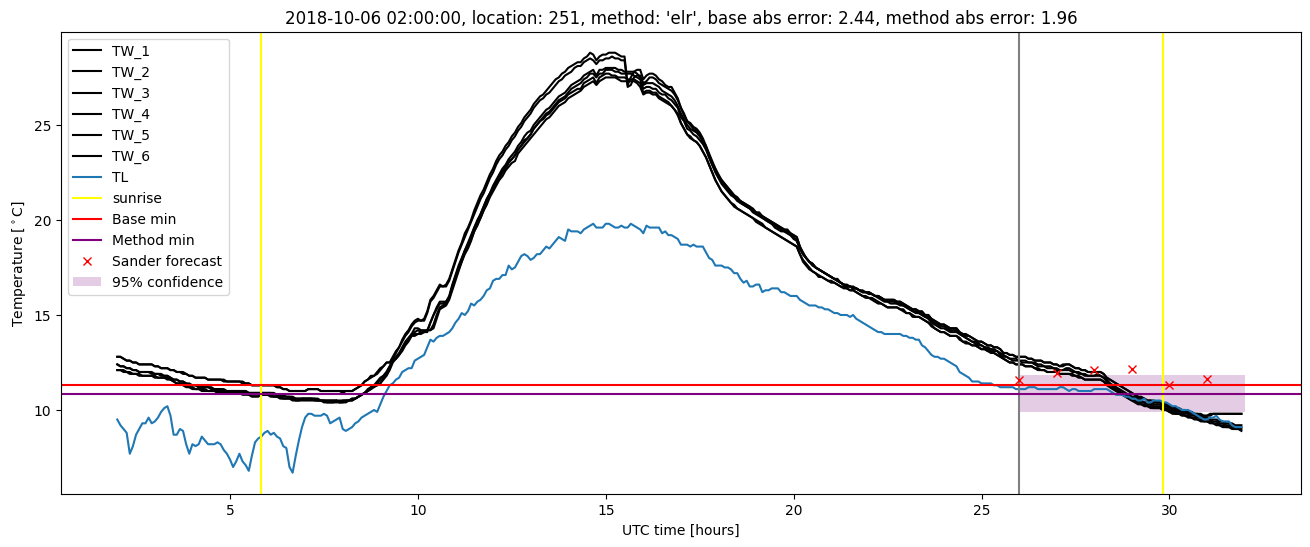
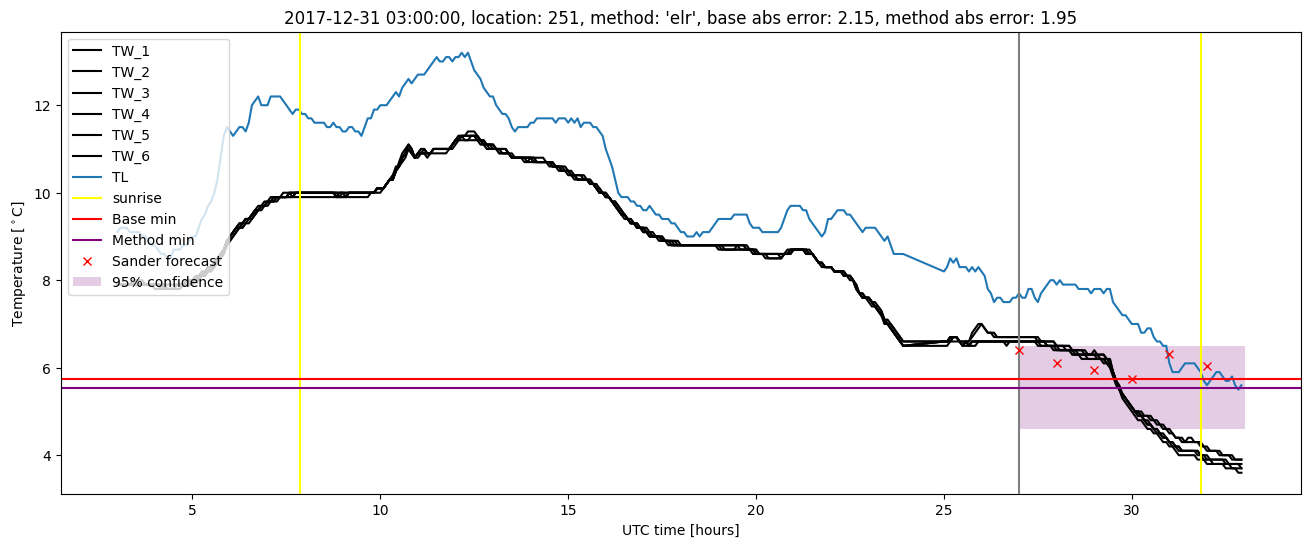
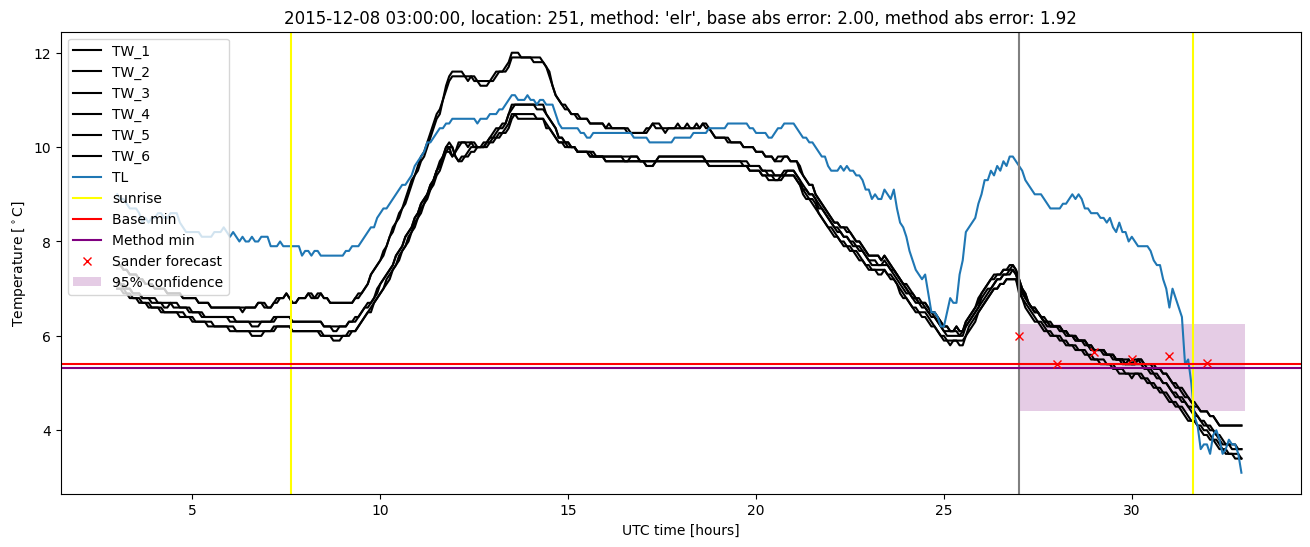
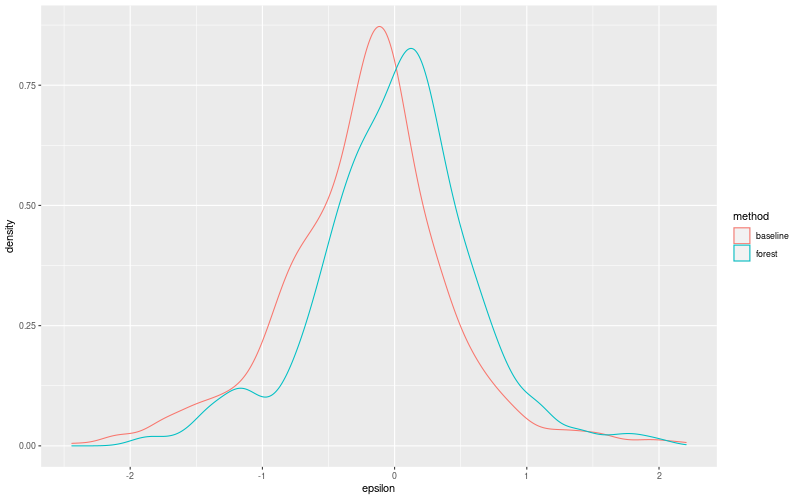
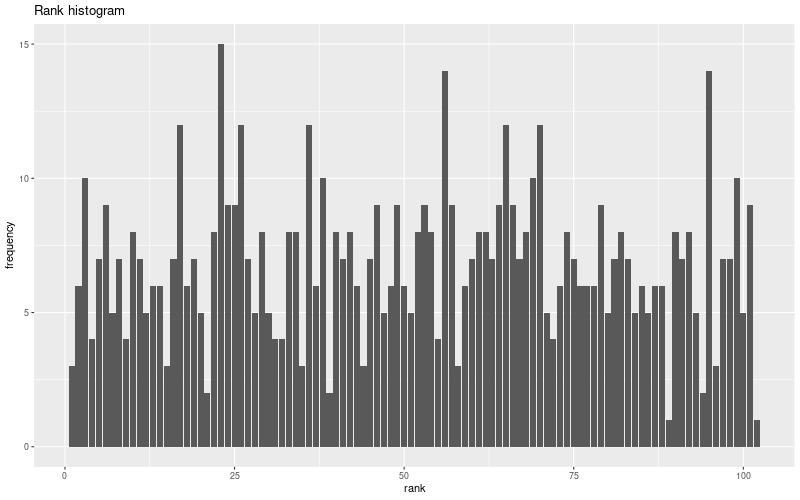
Extended logistic regression plots