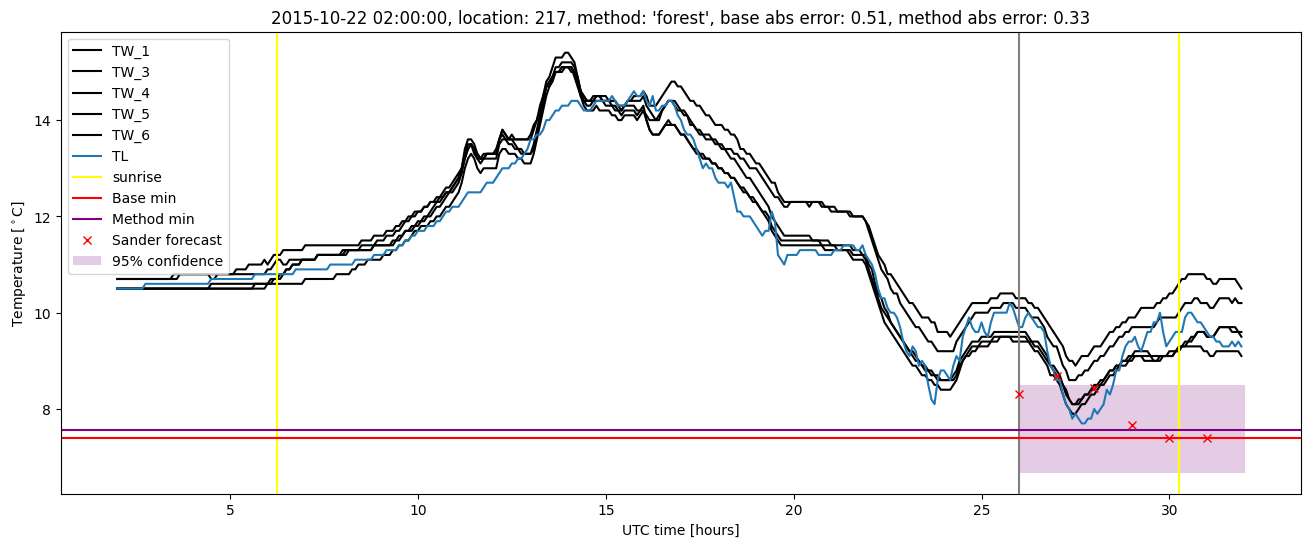
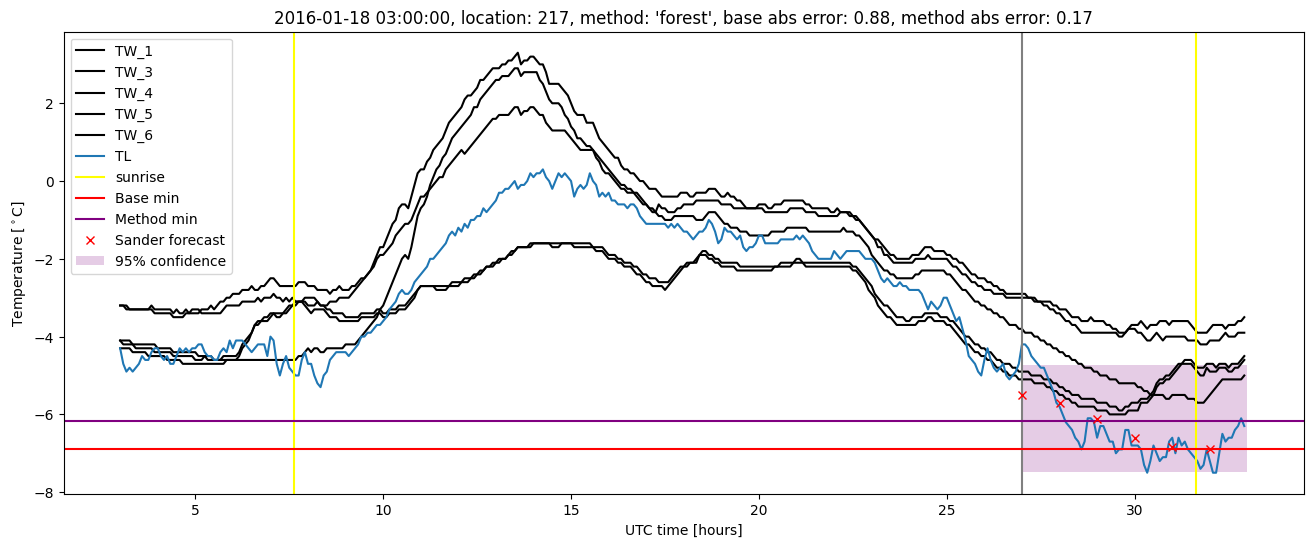
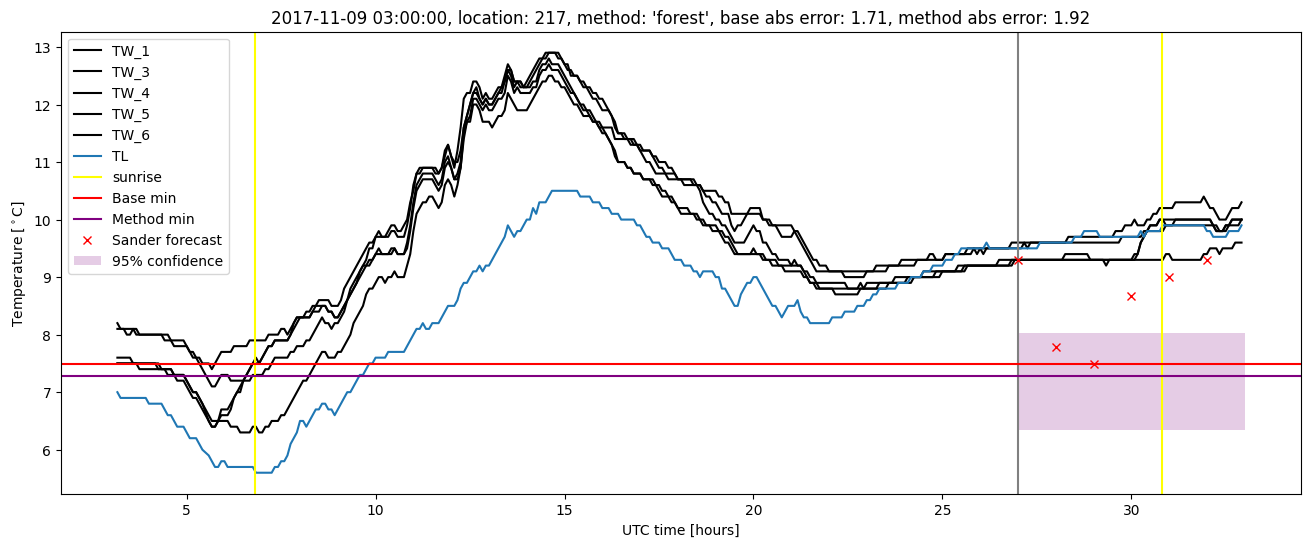
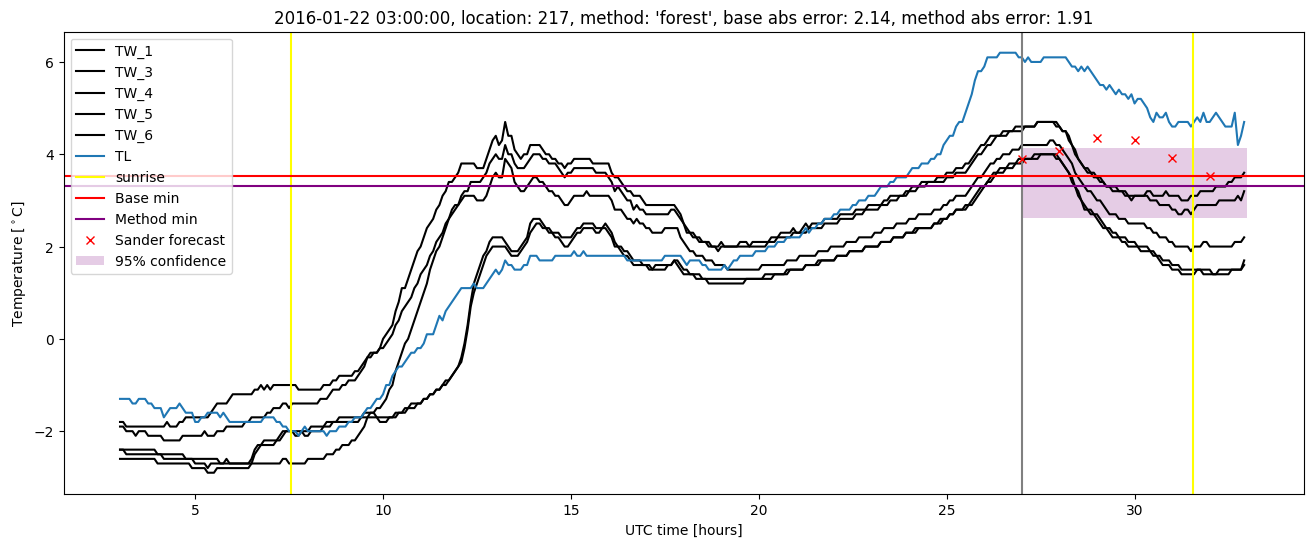
GMS location: 217
Random forest results
| names |
period |
power |
significance |
meanSquareError |
absError |
maxError |
CRPS |
IGN |
| baseline |
winter 2016 |
0.994 |
0.000e+00 |
0.348 |
0.449 |
2.137 |
NaN |
NaN |
| forest |
winter 2016 |
0.982 |
0.000e+00 |
0.281 |
0.395 |
1.914 |
0.534 |
5.587 |
| baseline |
winter 2017 |
0.956 |
0.077 |
0.346 |
0.446 |
2.156 |
NaN |
NaN |
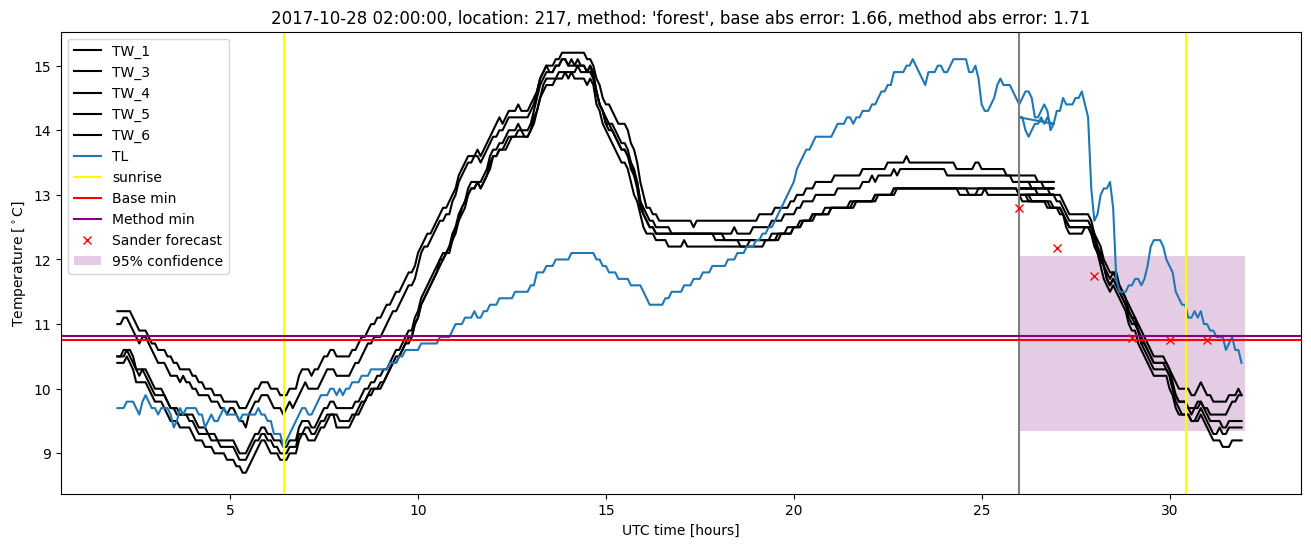
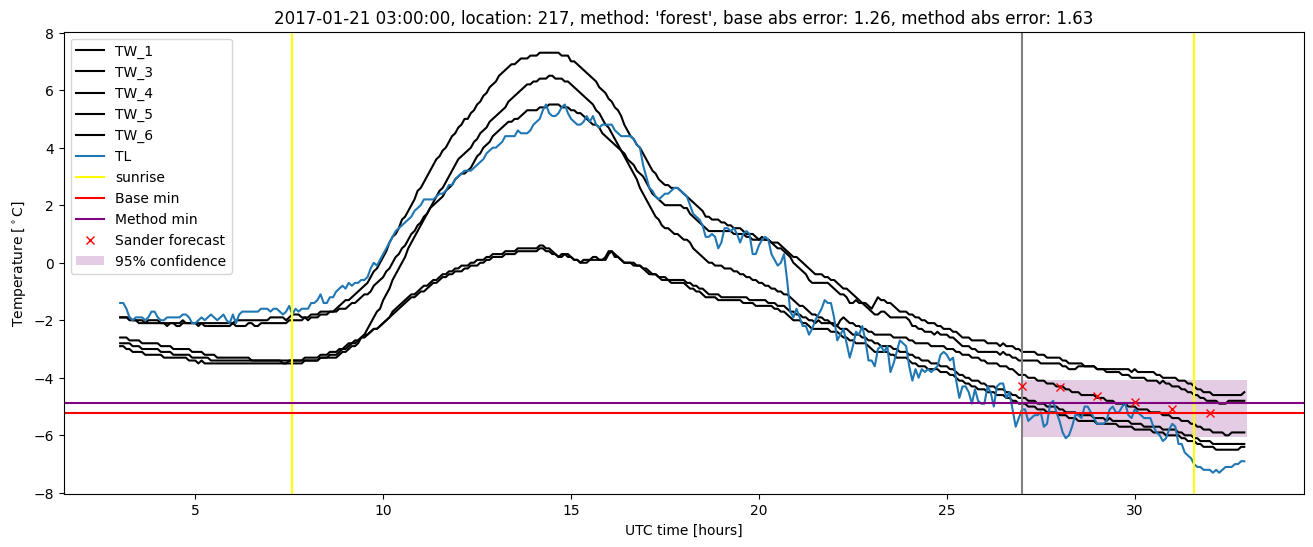
| forest |
winter 2017 |
0.939 |
0.051 |
0.279 |
0.390 |
1.625 |
0.516 |
4.836 |
| baseline |
winter 2018 |
0.993 |
0.167 |
0.340 |
0.428 |
1.712 |
NaN |
NaN |
| forest |
winter 2018 |
0.993 |
0.167 |
0.281 |
0.393 |
1.916 |
0.537 |
5.039 |
| baseline |
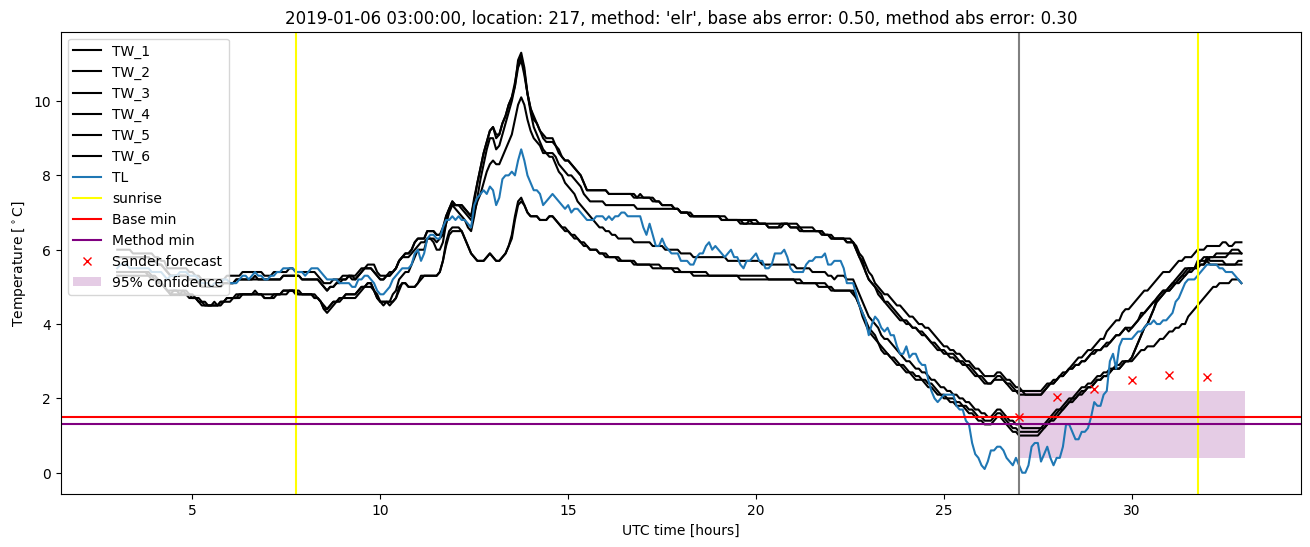
winter 2019 |
0.985 |
0.071 |
0.278 |
0.361 |
2.211 |
NaN |
NaN |
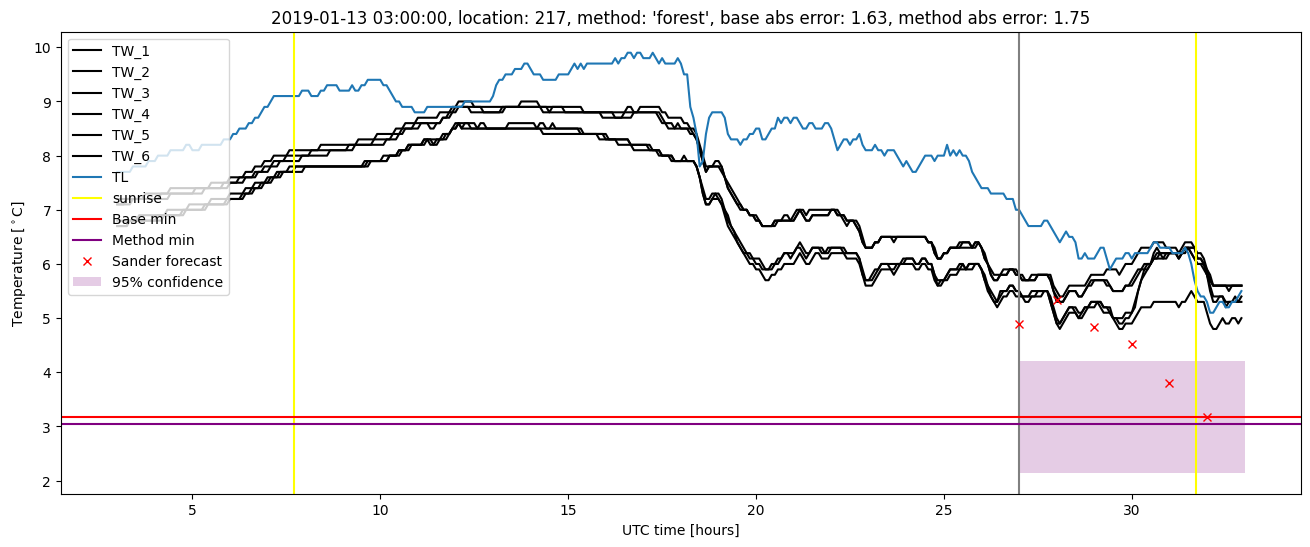
| forest |
winter 2019 |
0.993 |
0.000e+00 |
0.204 |
0.320 |
1.750 |
0.532 |
3.975 |
| baseline |
all |
0.984 |
0.083 |
0.330 |
0.423 |
2.211 |
NaN |
NaN |
| forest |
all |
0.978 |
0.064 |
0.263 |
0.377 |
1.916 |
0.530 |
4.914 |
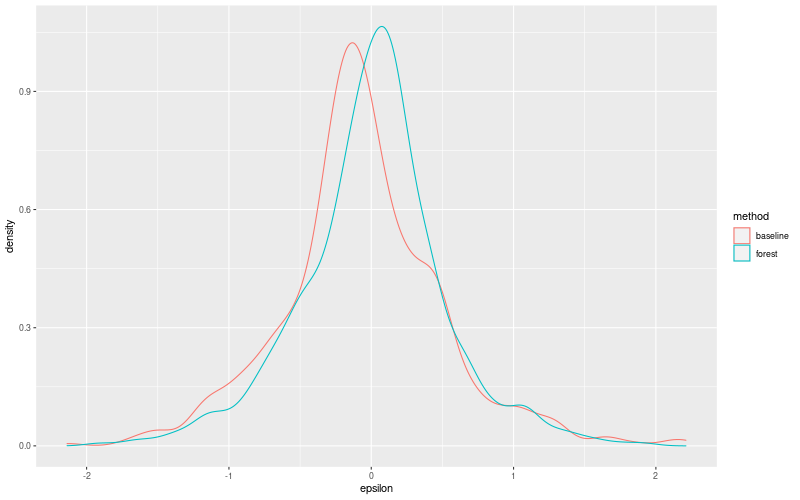
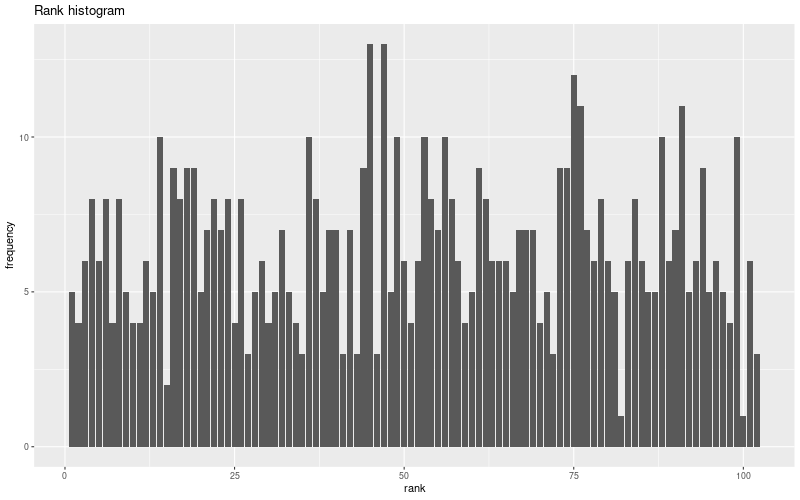
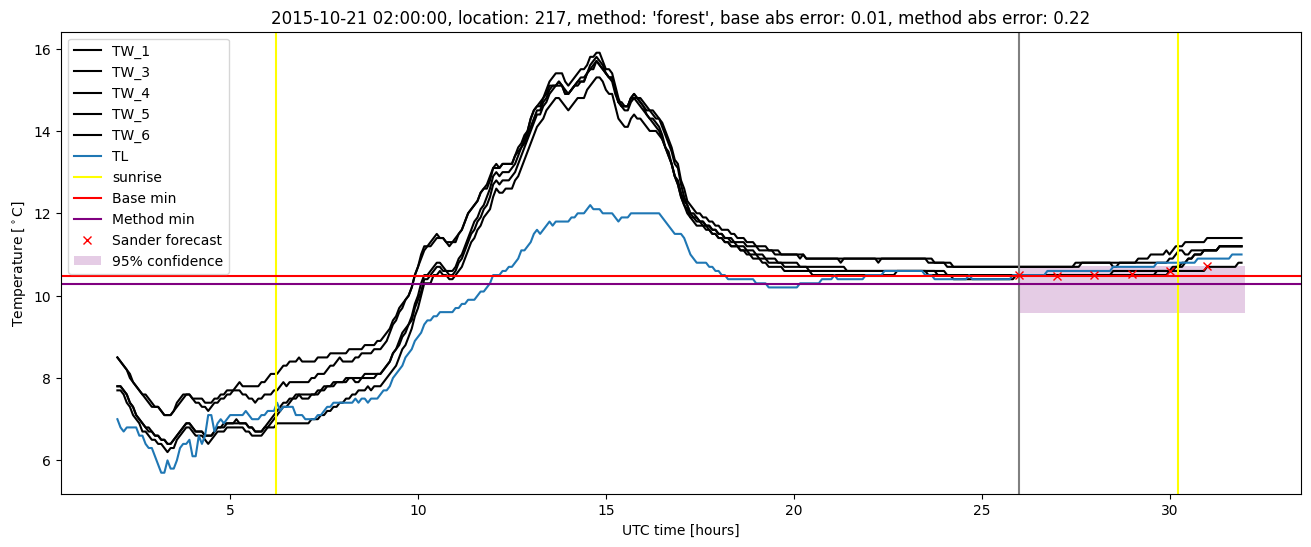
Random forest plots
Extended logistic regression results
| names |
period |
power |
significance |
meanSquareError |
absError |
maxError |
CRPS |
IGN |
| baseline |
winter 2016 |
0.994 |
0.000e+00 |
0.348 |
0.449 |
2.137 |
NaN |
NaN |
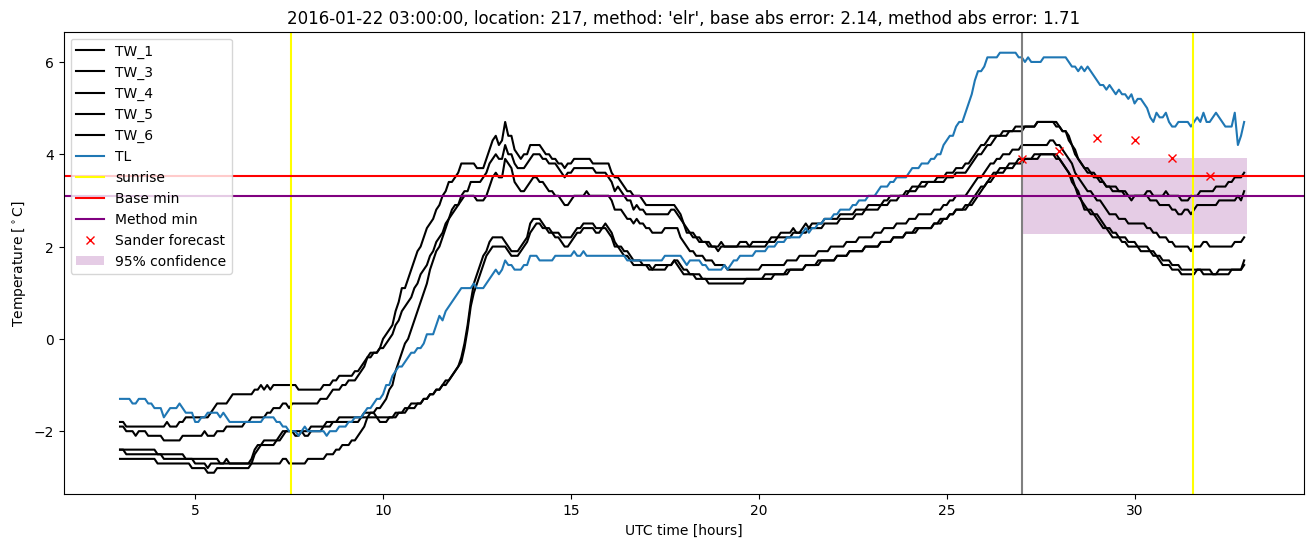
| elr |
winter 2016 |
0.988 |
0.000e+00 |
0.317 |
0.438 |
1.706 |
0.627 |
6.890 |
| baseline |
winter 2017 |
0.956 |
0.077 |
0.346 |
0.446 |
2.156 |
NaN |
NaN |
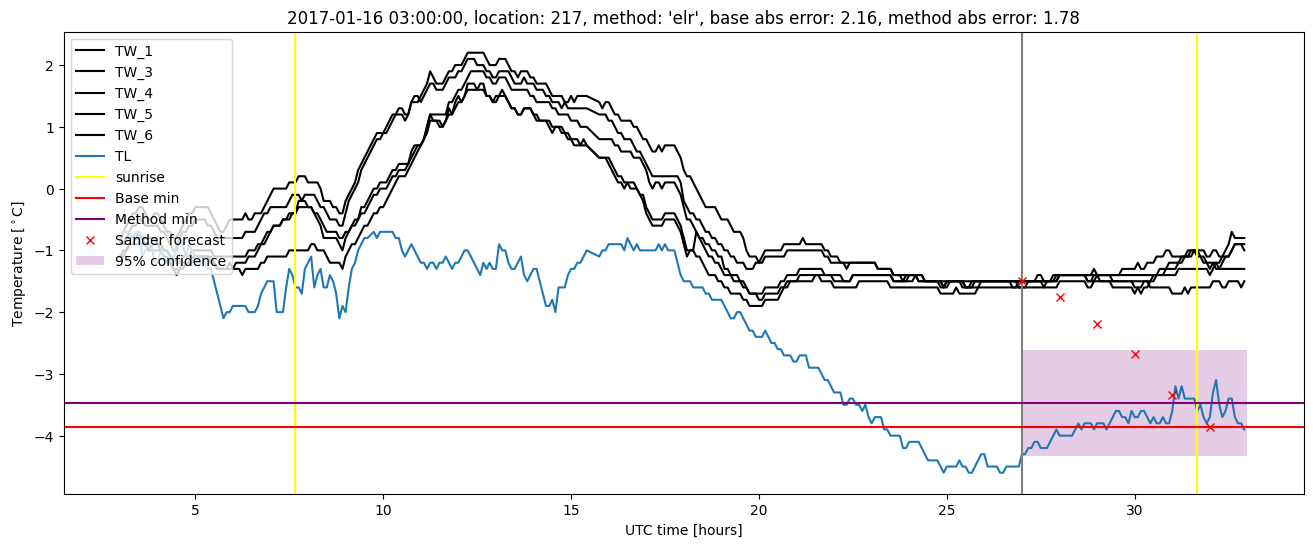
| elr |
winter 2017 |
0.965 |
0.051 |
0.283 |
0.394 |
1.778 |
0.545 |
4.685 |
| baseline |
winter 2018 |
0.993 |
0.167 |
0.340 |
0.428 |
1.712 |
NaN |
NaN |
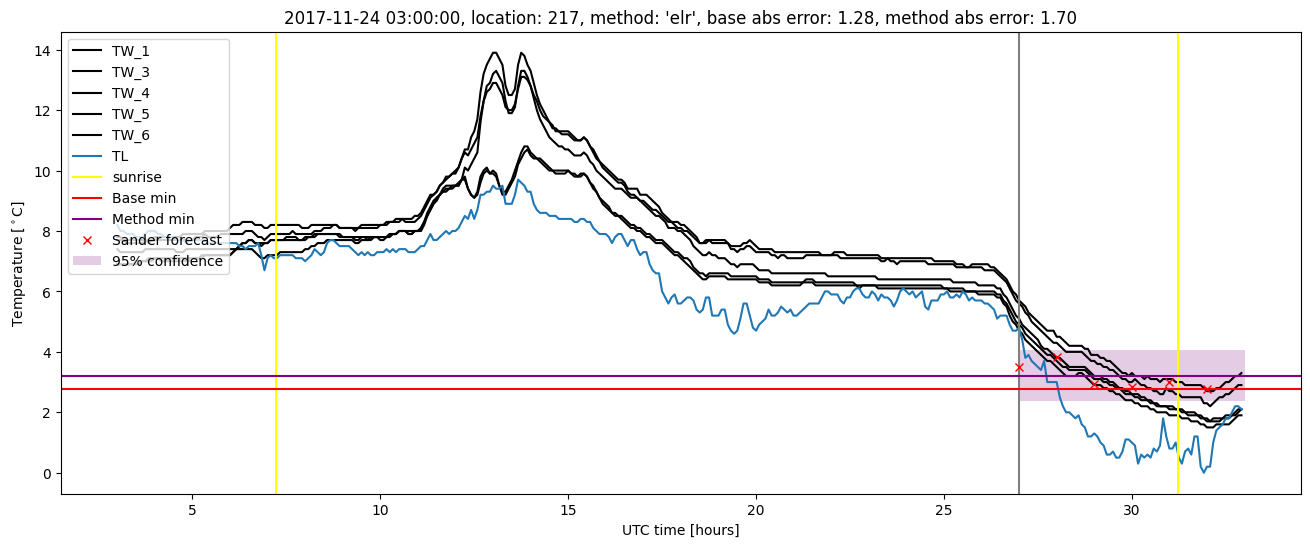
| elr |
winter 2018 |
0.985 |
0.167 |
0.344 |
0.448 |
2.163 |
0.597 |
5.939 |
| baseline |
winter 2019 |
0.985 |
0.071 |
0.278 |
0.361 |
2.211 |
NaN |
NaN |
| elr |
winter 2019 |
0.993 |
0.071 |
0.227 |
0.350 |
1.490 |
0.555 |
4.181 |
| baseline |
all |
0.984 |
0.083 |
0.330 |
0.423 |
2.211 |
NaN |
NaN |
| elr |
all |
0.984 |
0.073 |
0.296 |
0.410 |
2.163 |
0.584 |
5.532 |
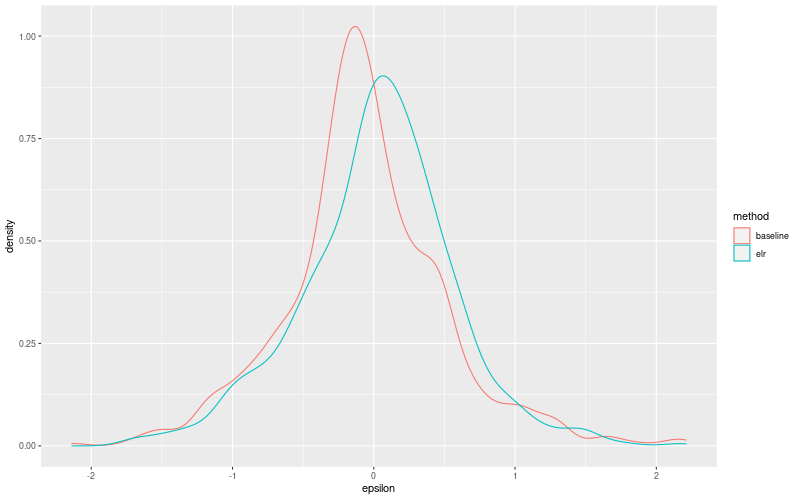
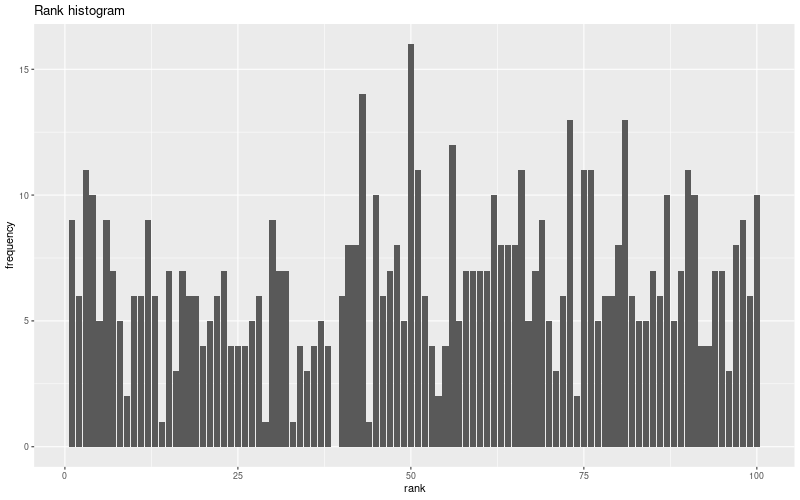
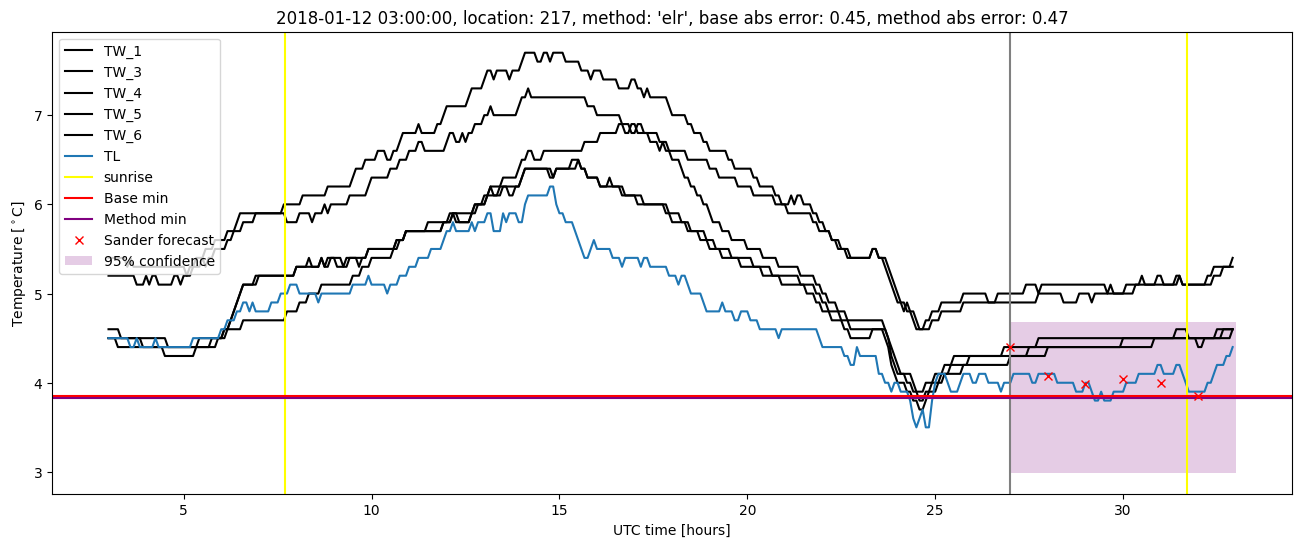
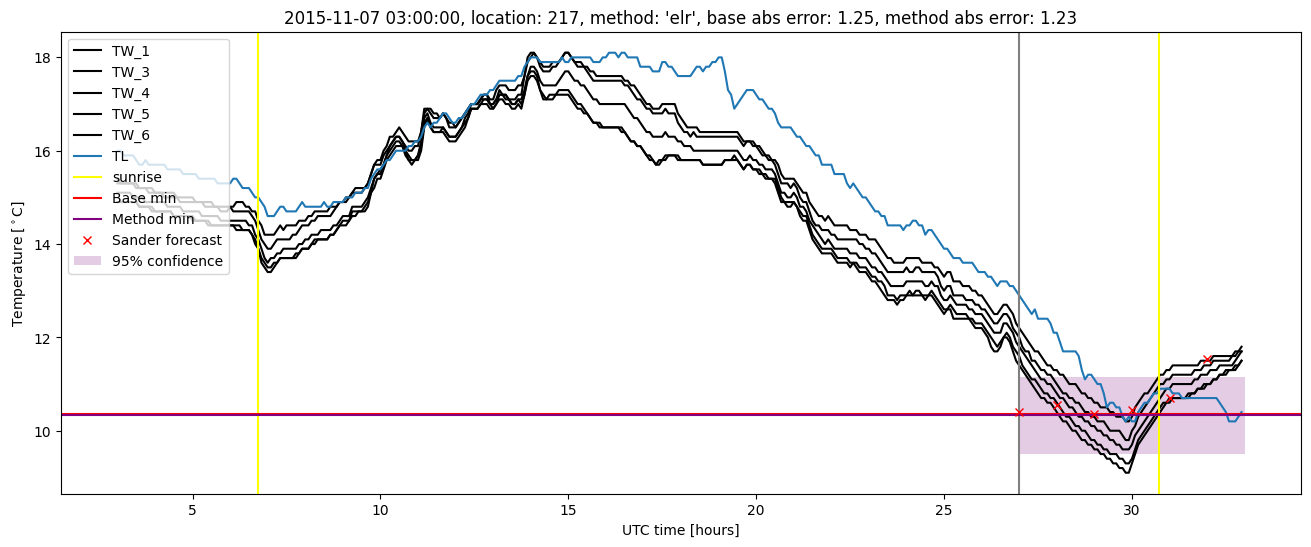
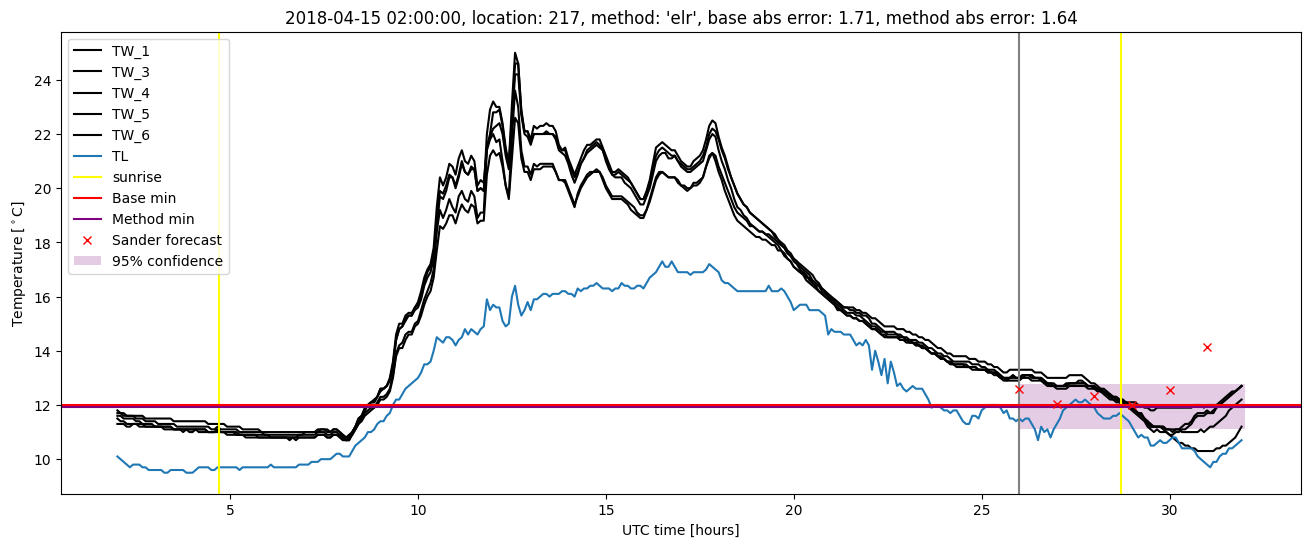
Extended logistic regression plots