GMS location: 216
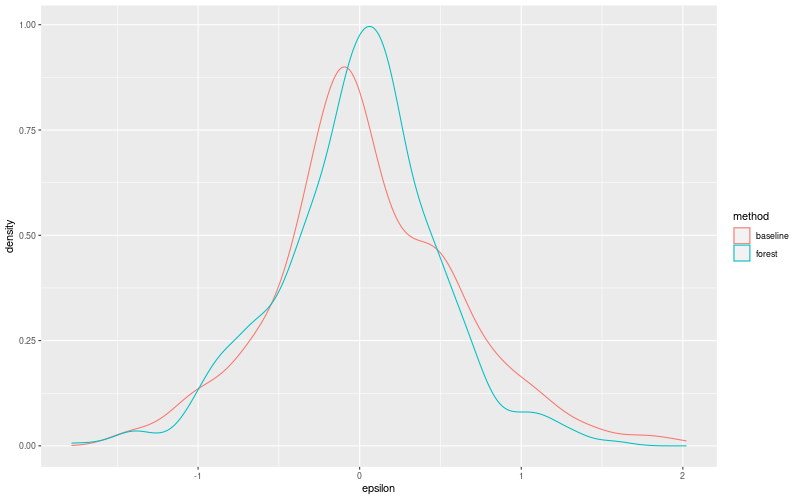
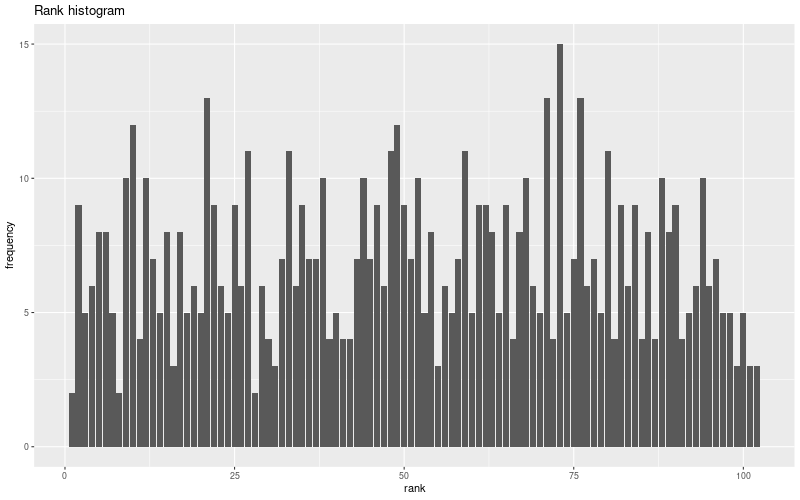
Random forest results
| names |
period |
power |
significance |
meanSquareError |
absError |
maxError |
CRPS |
IGN |
| baseline |
winter 2016 |
0.989 |
0.000e+00 |
0.328 |
0.440 |
1.680 |
NaN |
NaN |
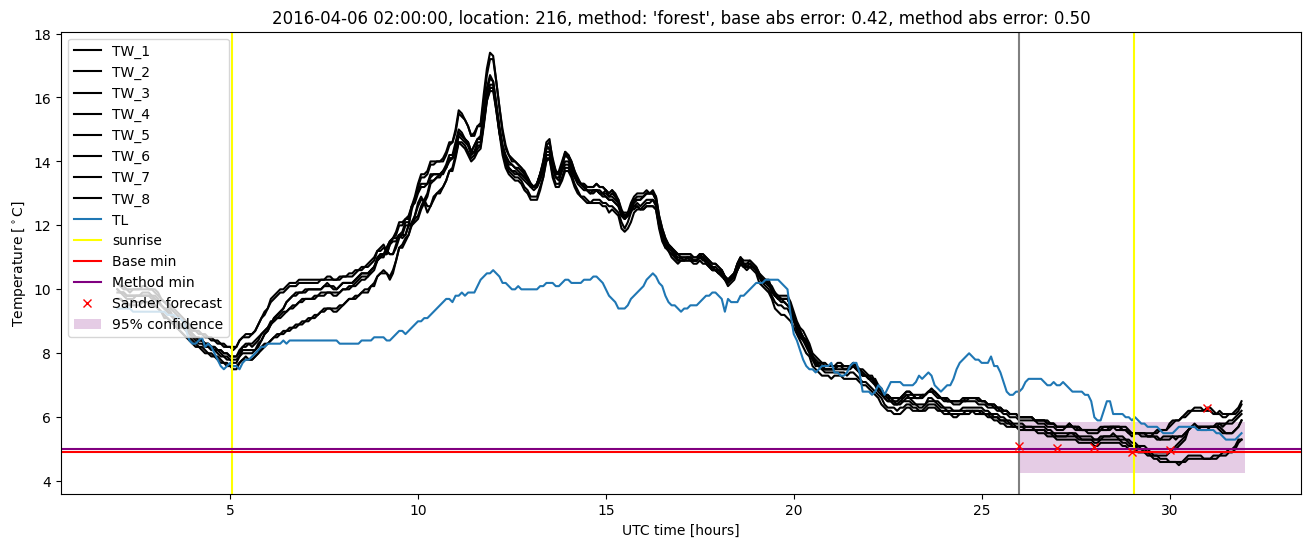
| forest |
winter 2016 |
1.000 |
0.150 |
0.235 |
0.371 |
1.781 |
0.466 |
6.184 |
| baseline |
winter 2017 |
0.966 |
0.059 |
0.413 |
0.481 |
2.020 |
NaN |
NaN |
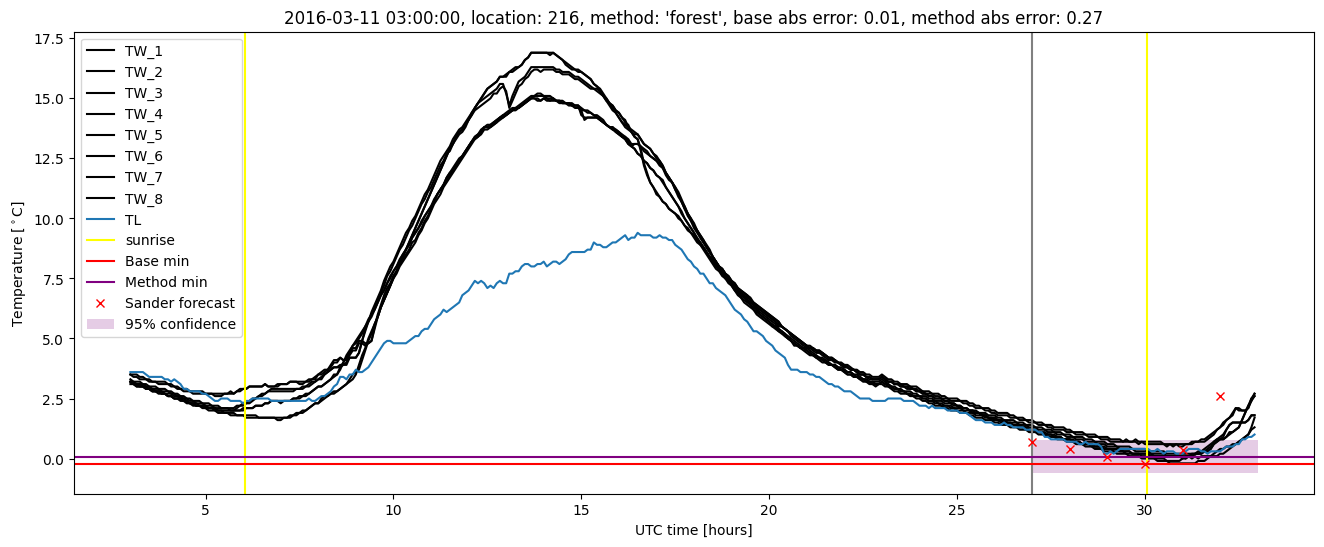
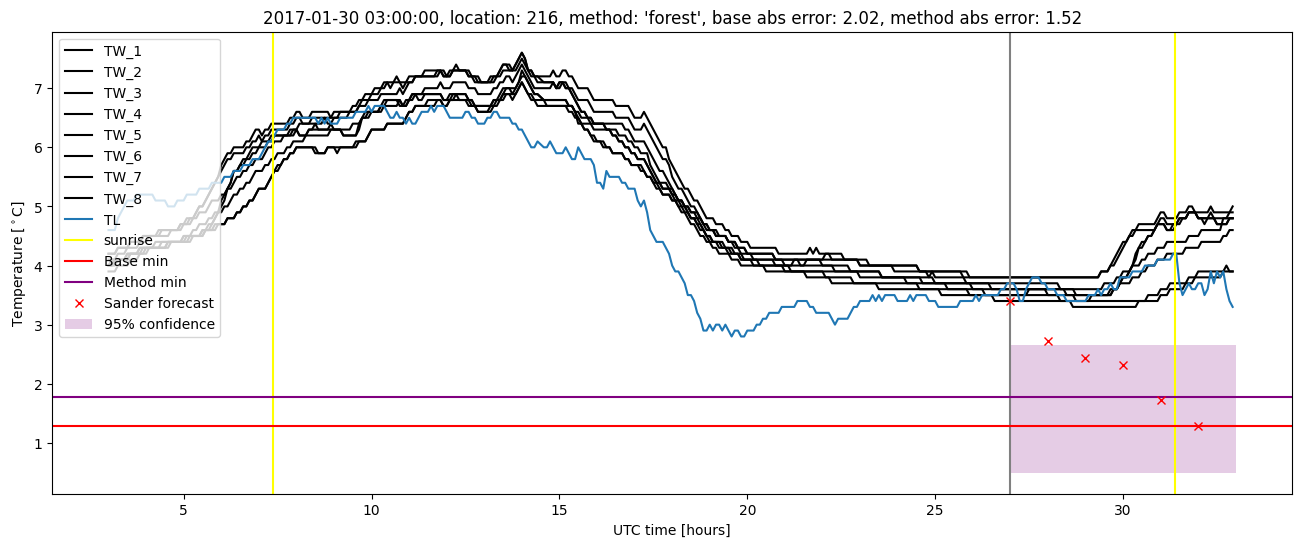
| forest |
winter 2017 |
0.958 |
0.029 |
0.269 |
0.402 |
1.524 |
0.497 |
7.812 |
| baseline |
winter 2018 |
0.993 |
0.061 |
0.296 |
0.414 |
1.720 |
NaN |
NaN |
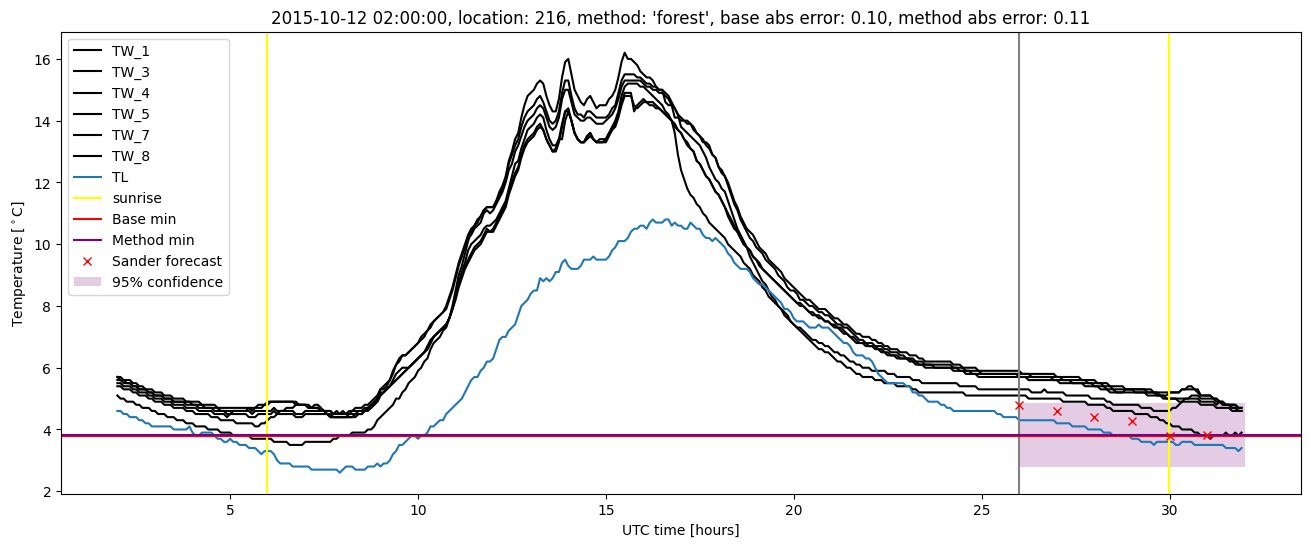
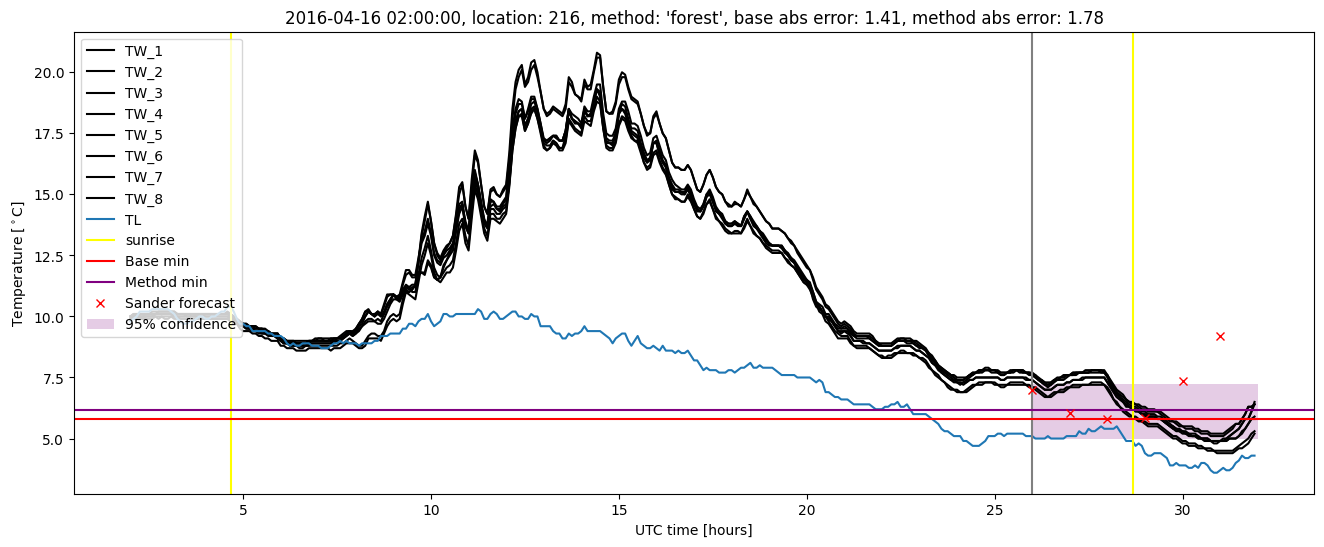
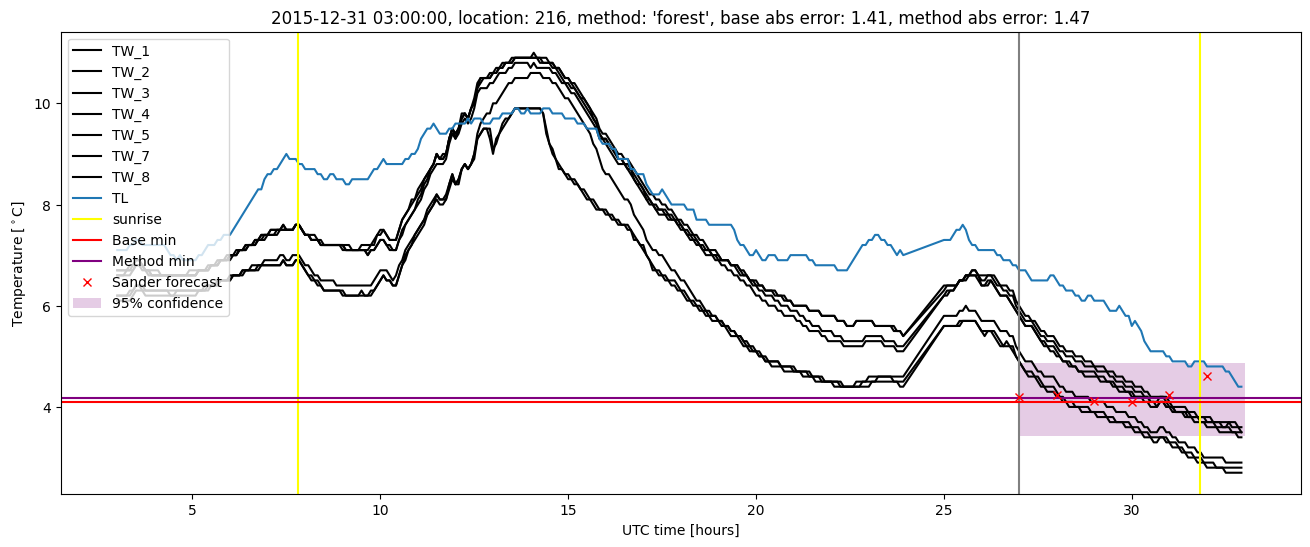
| forest |
winter 2018 |
0.987 |
0.121 |
0.244 |
0.376 |
1.431 |
0.482 |
4.165 |
| baseline |
winter 2019 |
0.993 |
0.071 |
0.288 |
0.404 |
1.801 |
NaN |
NaN |
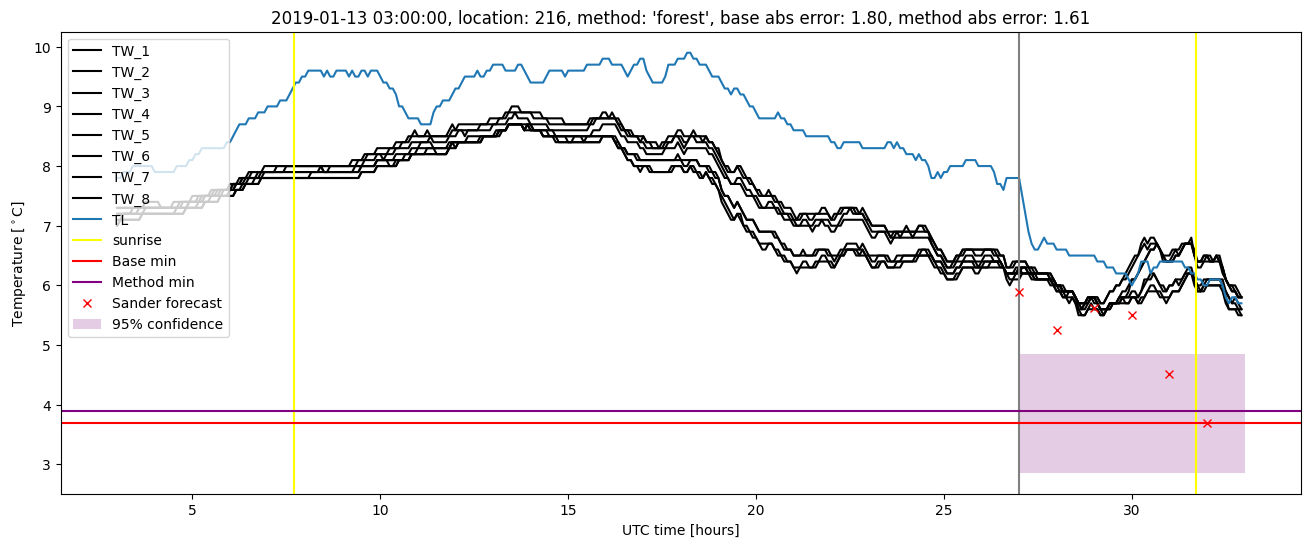
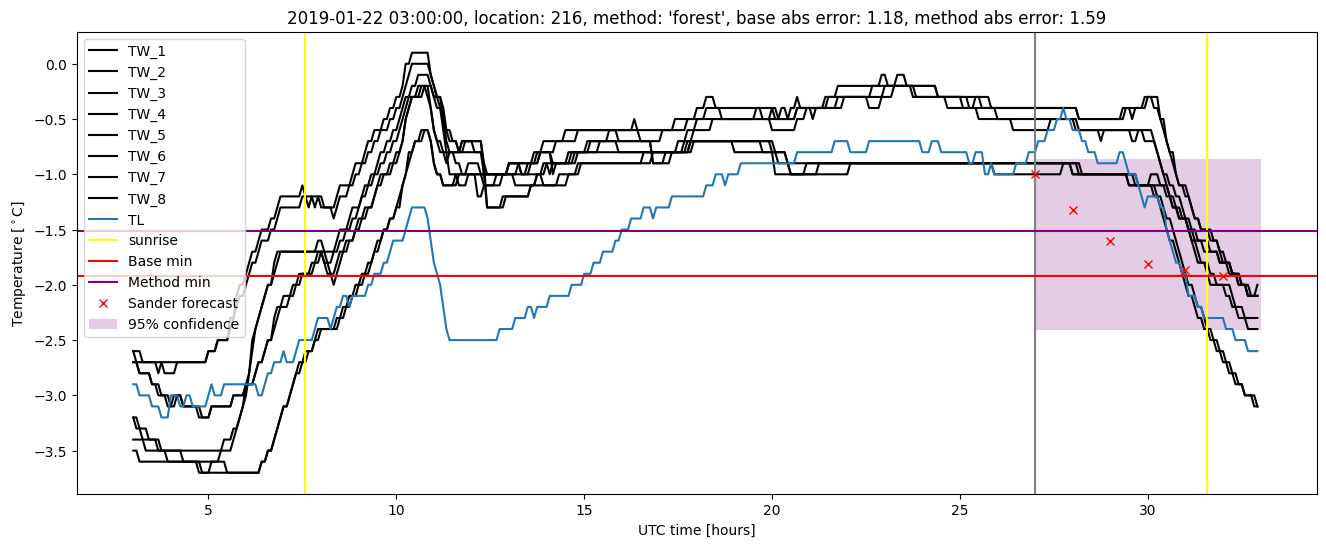
| forest |
winter 2019 |
0.993 |
0.143 |
0.223 |
0.346 |
1.608 |
0.470 |
4.949 |
| baseline |
all |
0.987 |
0.050 |
0.329 |
0.434 |
2.020 |
NaN |
NaN |
| forest |
all |
0.987 |
0.099 |
0.242 |
0.373 |
1.781 |
0.478 |
5.727 |
Random forest plots
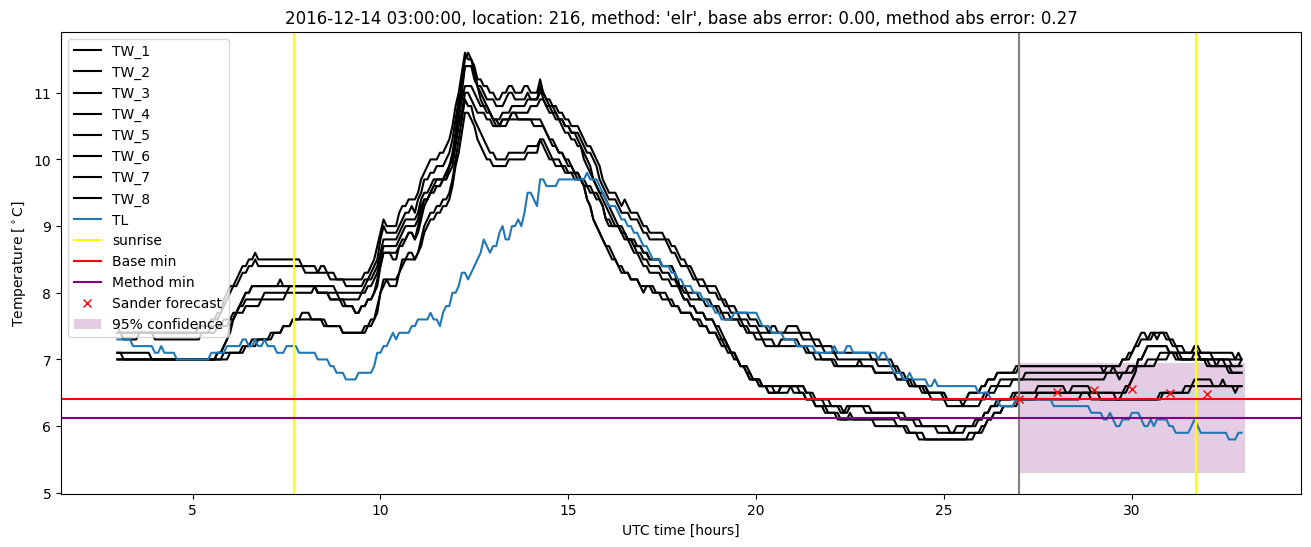
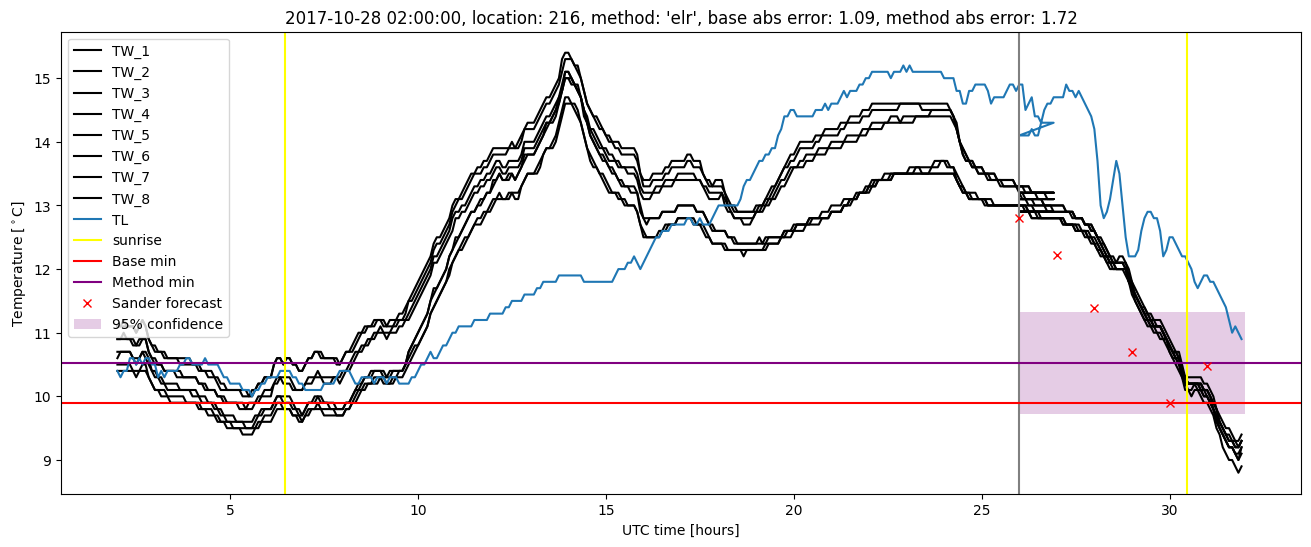
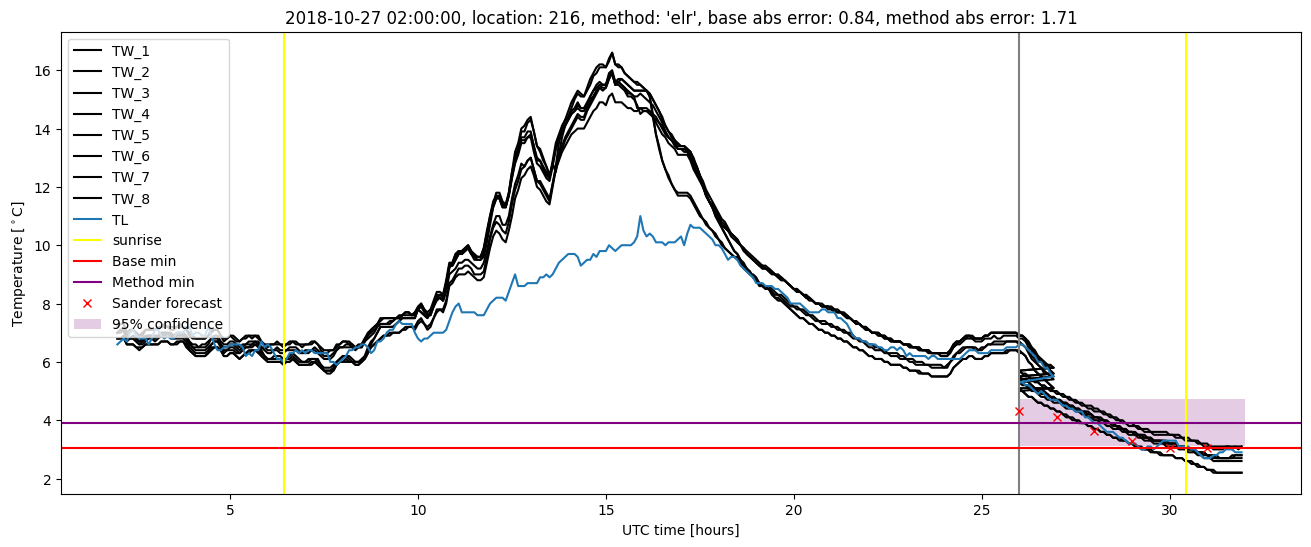
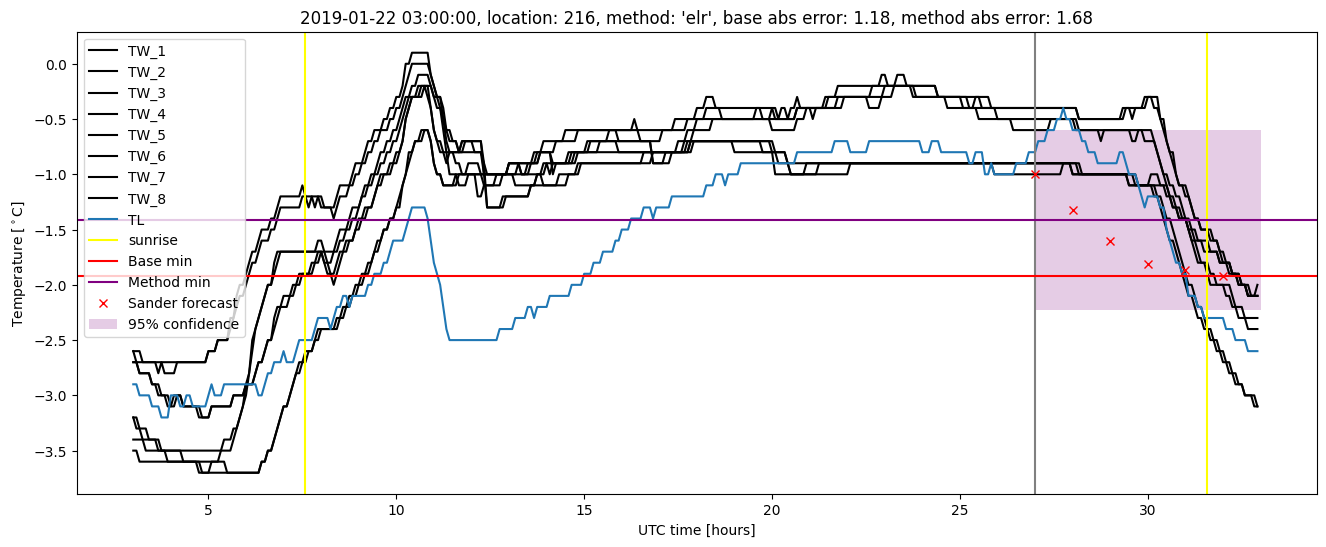
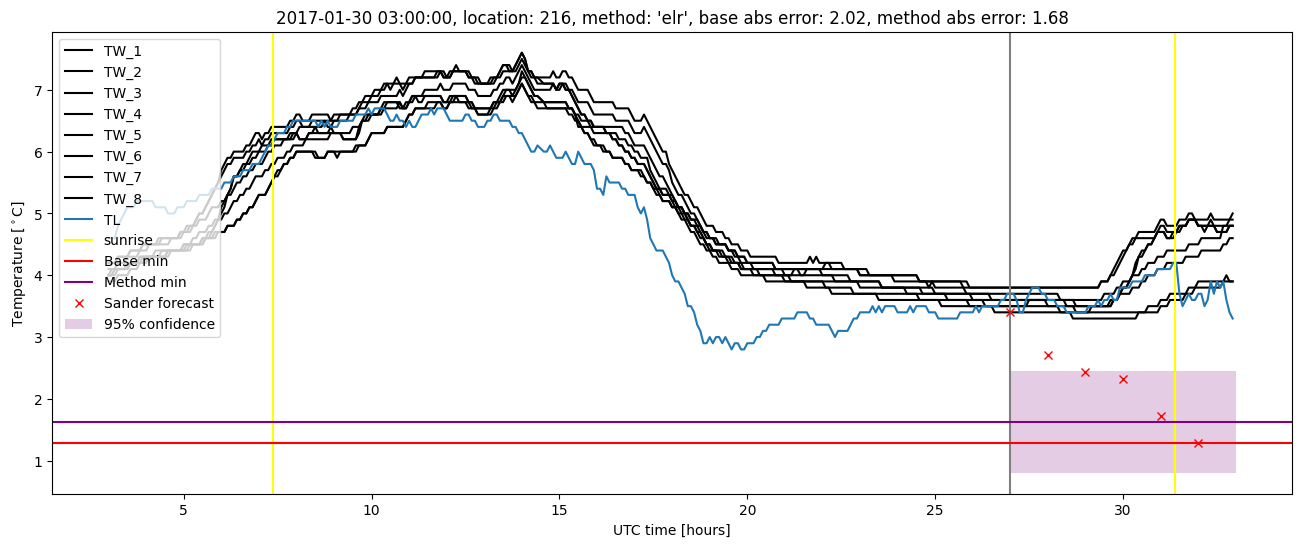
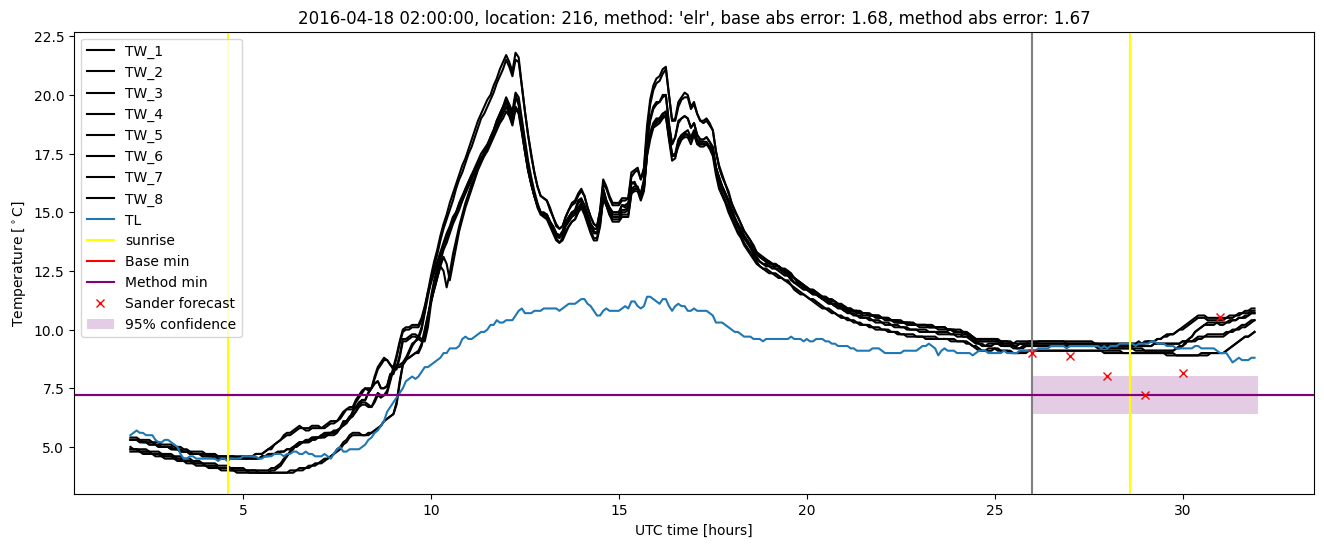
Extended logistic regression results
| names |
period |
power |
significance |
meanSquareError |
absError |
maxError |
CRPS |
IGN |
| baseline |
winter 2016 |
0.989 |
0.000e+00 |
0.328 |
0.440 |
1.680 |
NaN |
NaN |
| elr |
winter 2016 |
0.995 |
0.100 |
0.261 |
0.404 |
1.673 |
0.571 |
6.286 |
| baseline |
winter 2017 |
0.966 |
0.059 |
0.413 |
0.481 |
2.020 |
NaN |
NaN |
| elr |
winter 2017 |
0.975 |
0.059 |
0.300 |
0.426 |
1.677 |
0.536 |
5.390 |
| baseline |
winter 2018 |
0.993 |
0.061 |
0.296 |
0.414 |
1.720 |
NaN |
NaN |
| elr |
winter 2018 |
0.980 |
0.091 |
0.281 |
0.407 |
1.723 |
0.547 |
5.984 |
| baseline |
winter 2019 |
0.993 |
0.071 |
0.288 |
0.404 |
1.801 |
NaN |
NaN |
| elr |
winter 2019 |
0.993 |
0.071 |
0.244 |
0.365 |
1.713 |
0.540 |
5.528 |
| baseline |
all |
0.987 |
0.050 |
0.329 |
0.434 |
2.020 |
NaN |
NaN |
| elr |
all |
0.987 |
0.079 |
0.271 |
0.400 |
1.723 |
0.550 |
5.838 |
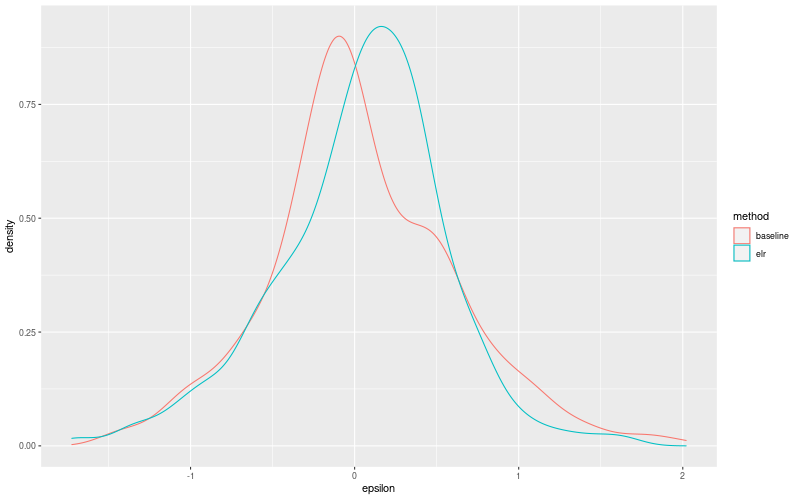
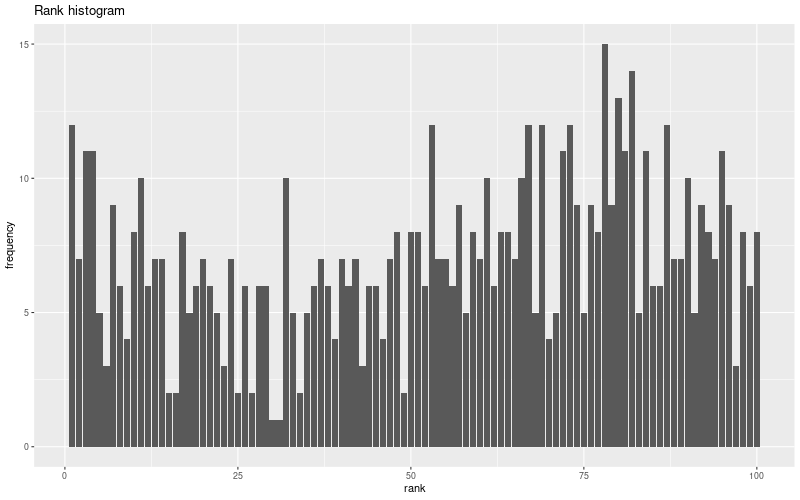
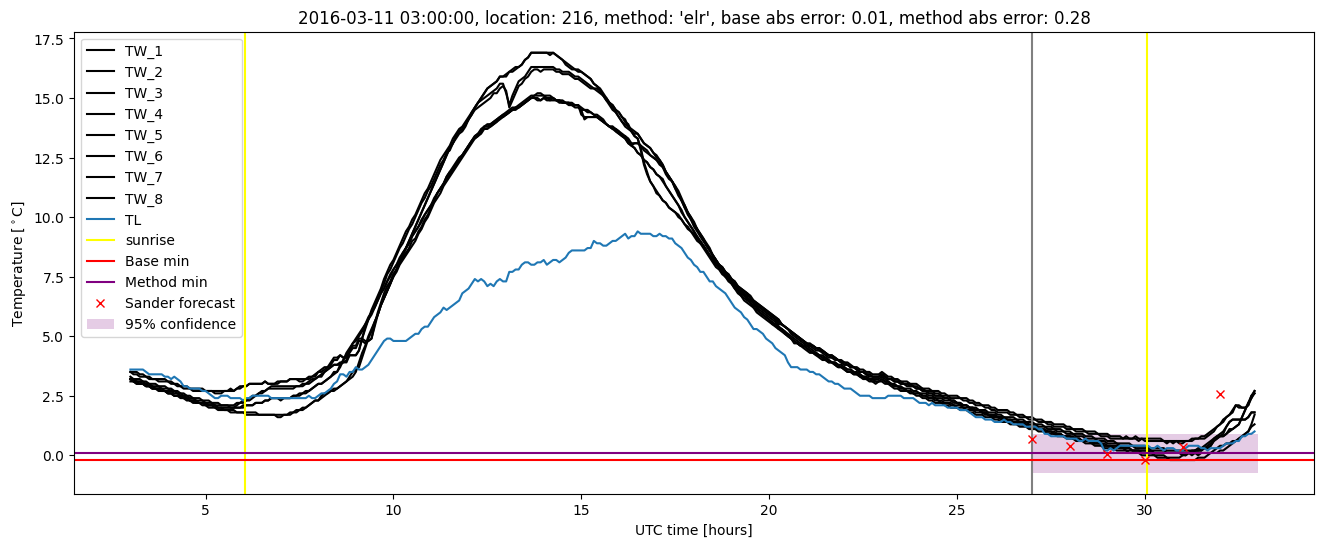
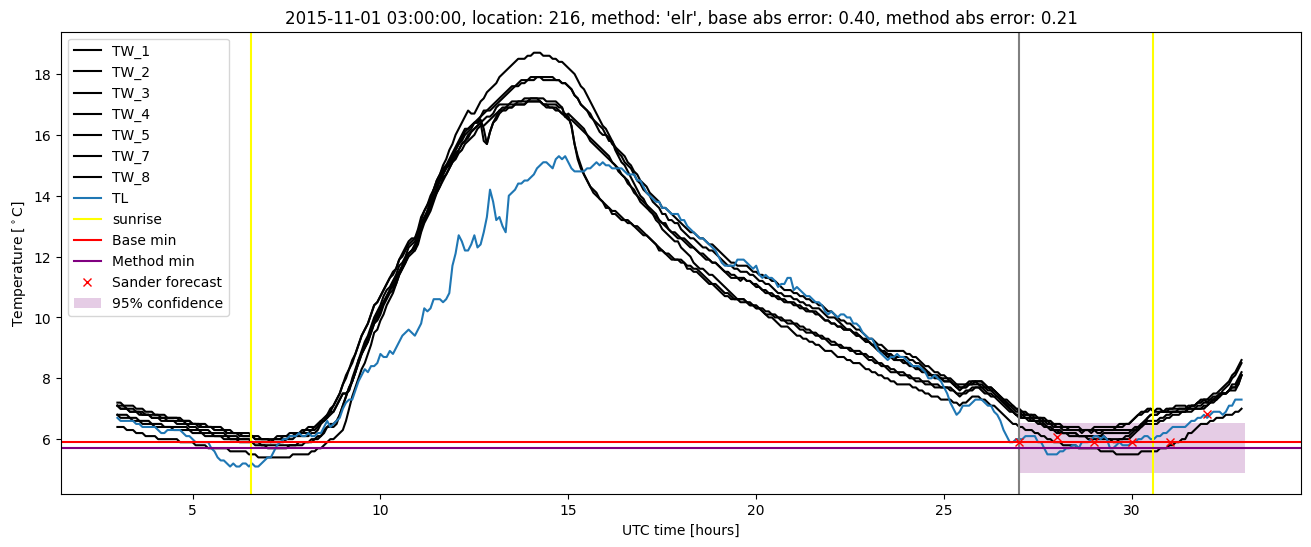
Extended logistic regression plots