GMS location: 215
Random forest results
| names |
period |
power |
significance |
meanSquareError |
absError |
maxError |
CRPS |
IGN |
| baseline |
winter 2016 |
0.965 |
0.000e+00 |
0.391 |
0.480 |
1.987 |
NaN |
NaN |
| forest |
winter 2016 |
0.977 |
0.048 |
0.262 |
0.390 |
1.607 |
0.431 |
2.324 |
| baseline |
winter 2017 |
0.975 |
0.061 |
0.468 |
0.517 |
2.315 |
NaN |
NaN |
| forest |
winter 2017 |
1.000 |
0.091 |
0.388 |
0.465 |
2.212 |
0.444 |
2.437 |
| baseline |
winter 2018 |
1.000 |
NaN |
0.486 |
0.456 |
2.359 |
NaN |
NaN |
| forest |
winter 2018 |
1.000 |
NaN |
0.511 |
0.481 |
2.308 |
0.468 |
3.387 |
| baseline |
winter 2019 |
1.000 |
NaN |
0.218 |
0.353 |
1.161 |
NaN |
NaN |
| forest |
winter 2019 |
1.000 |
NaN |
0.324 |
0.470 |
1.310 |
0.366 |
1.032 |
| baseline |
all |
0.975 |
0.037 |
0.424 |
0.485 |
2.359 |
NaN |
NaN |
| forest |
all |
0.989 |
0.074 |
0.342 |
0.432 |
2.308 |
0.437 |
2.442 |
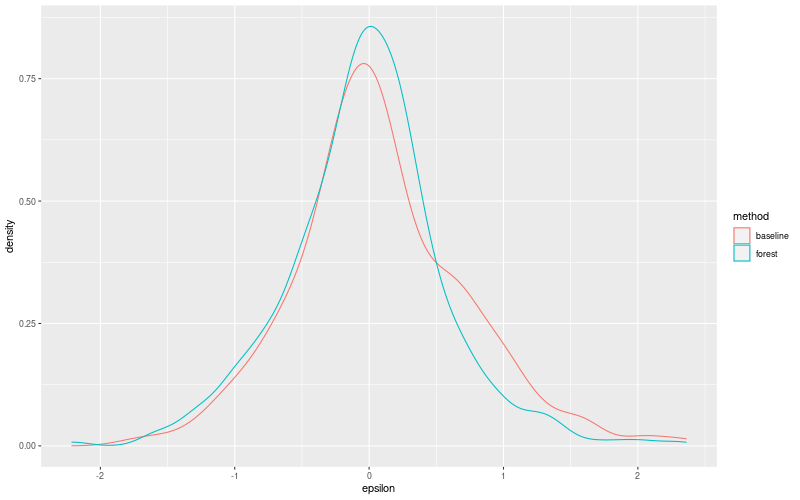
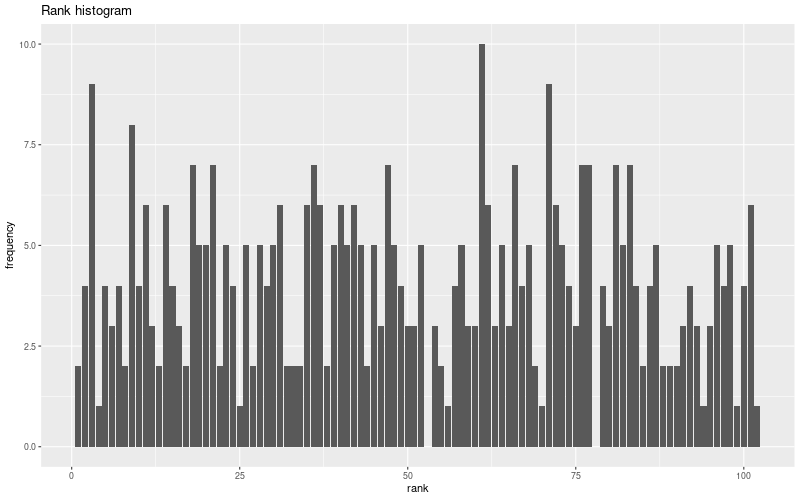
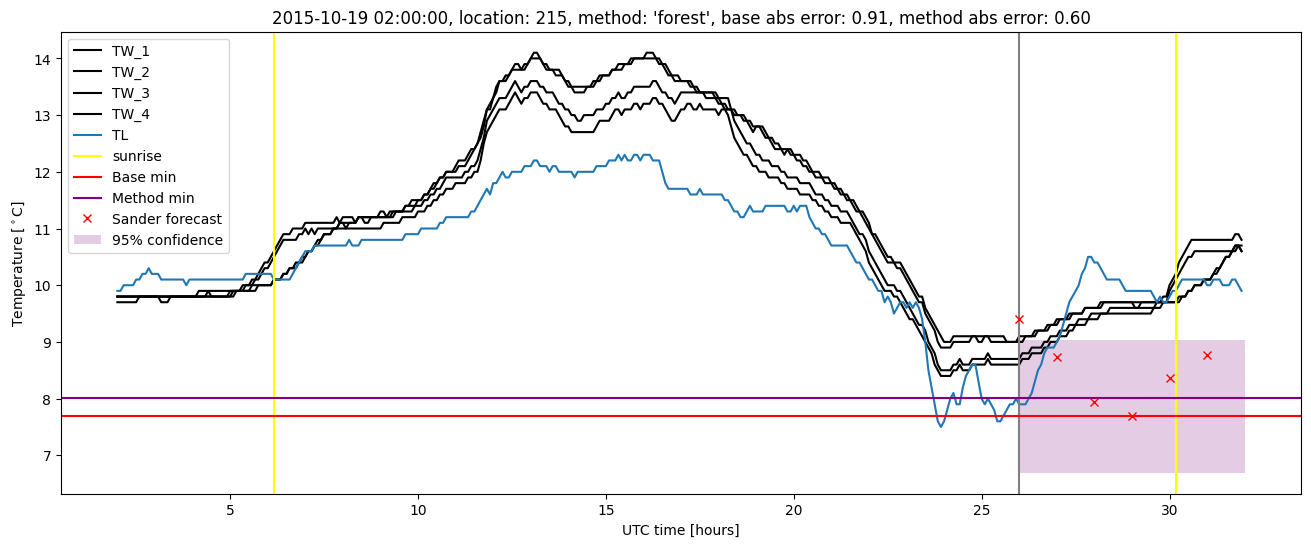
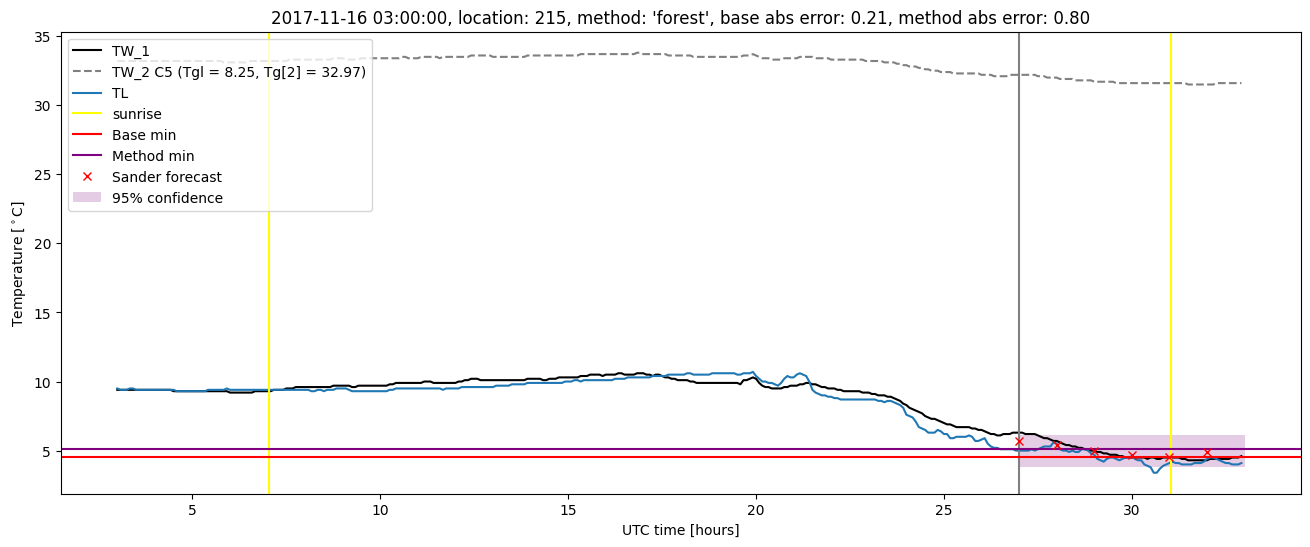
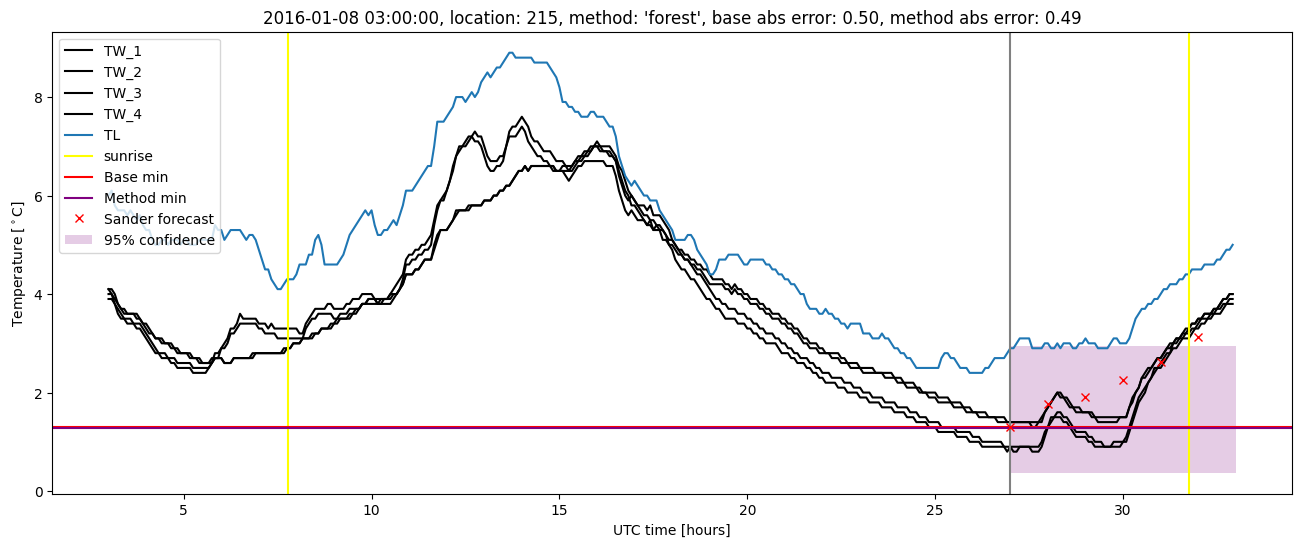
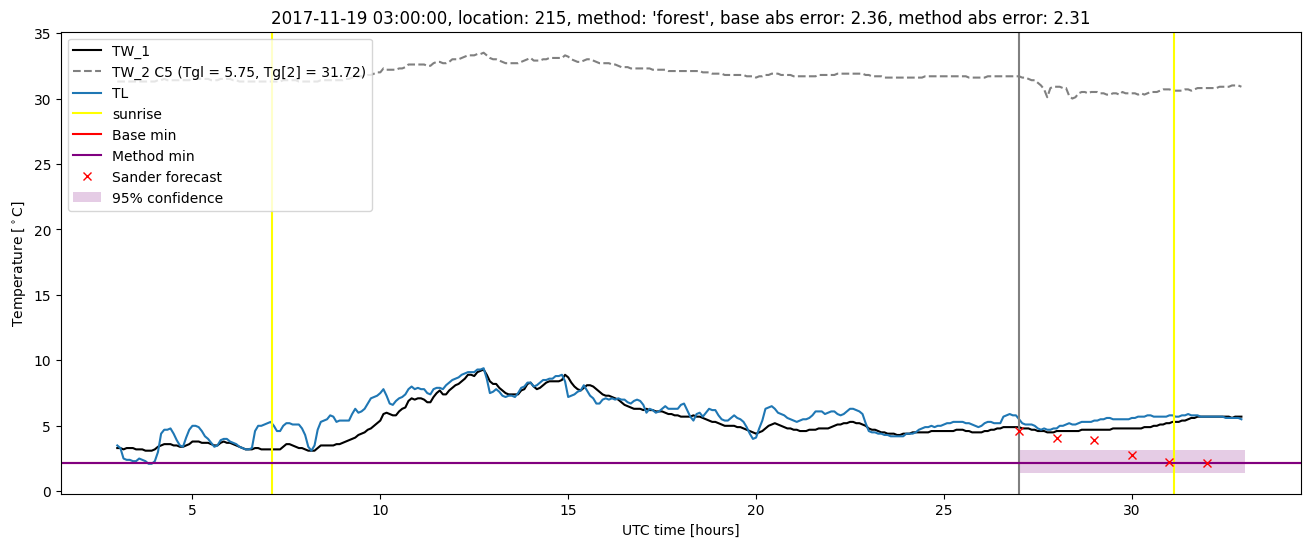
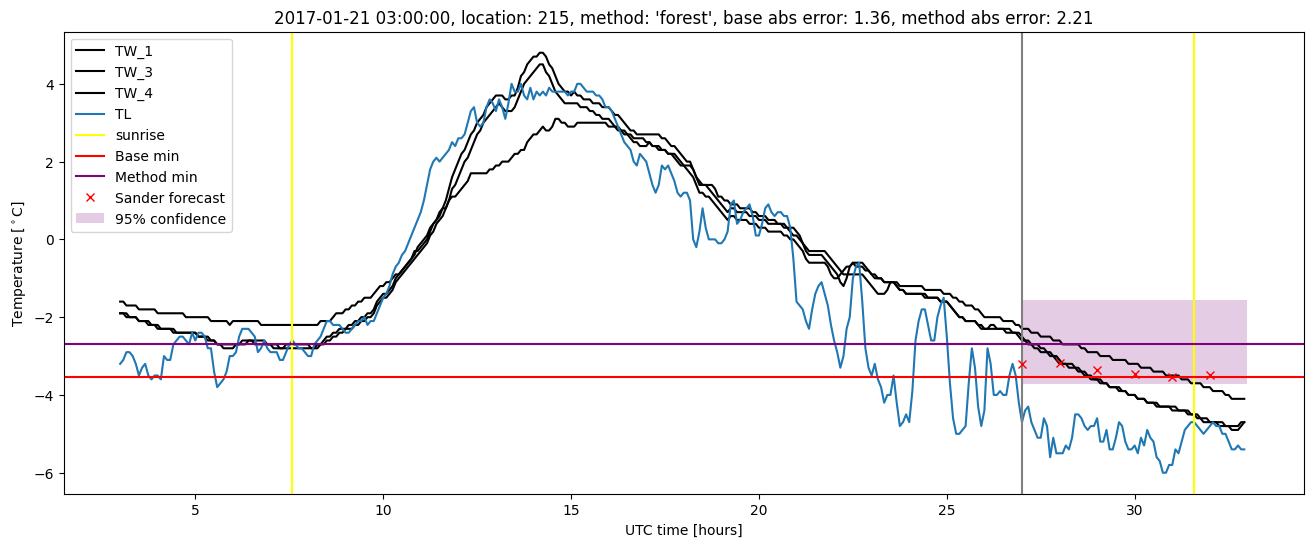
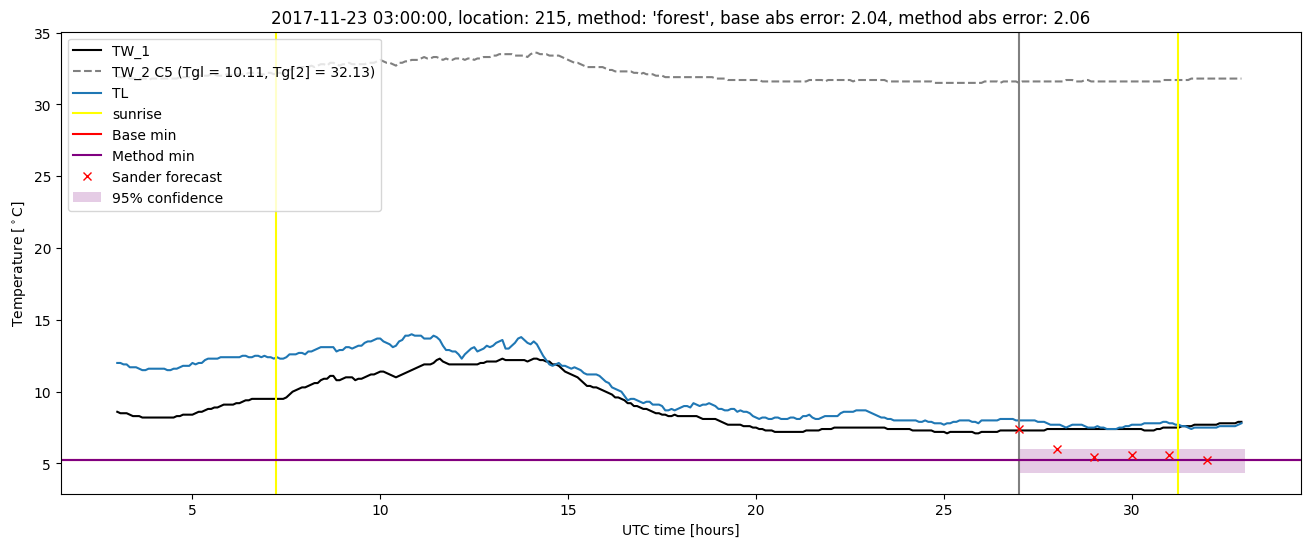
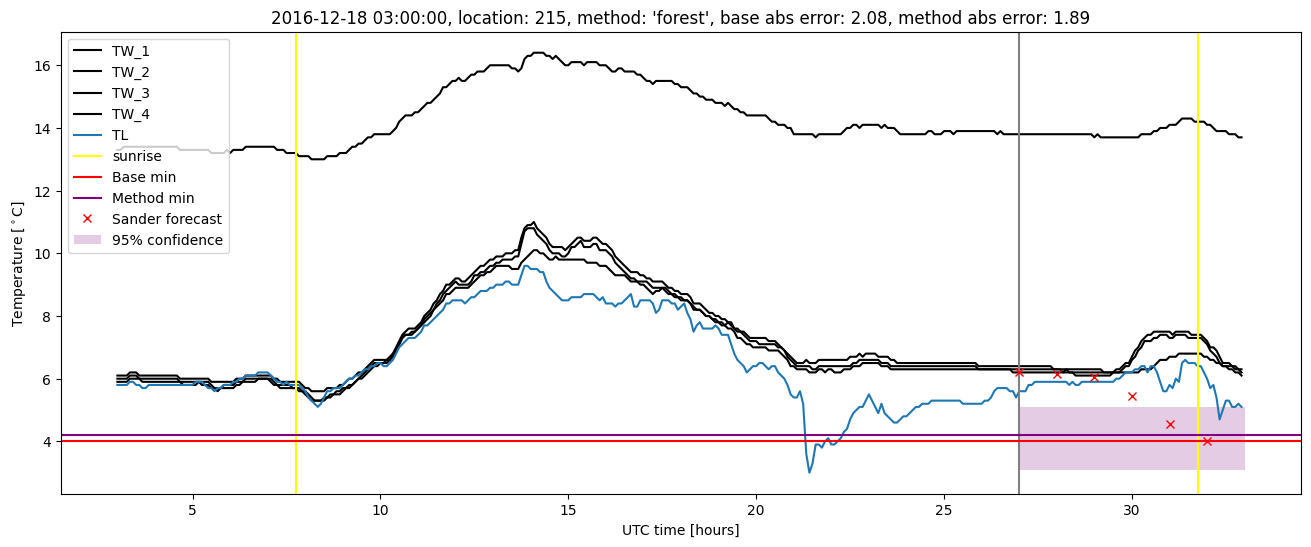
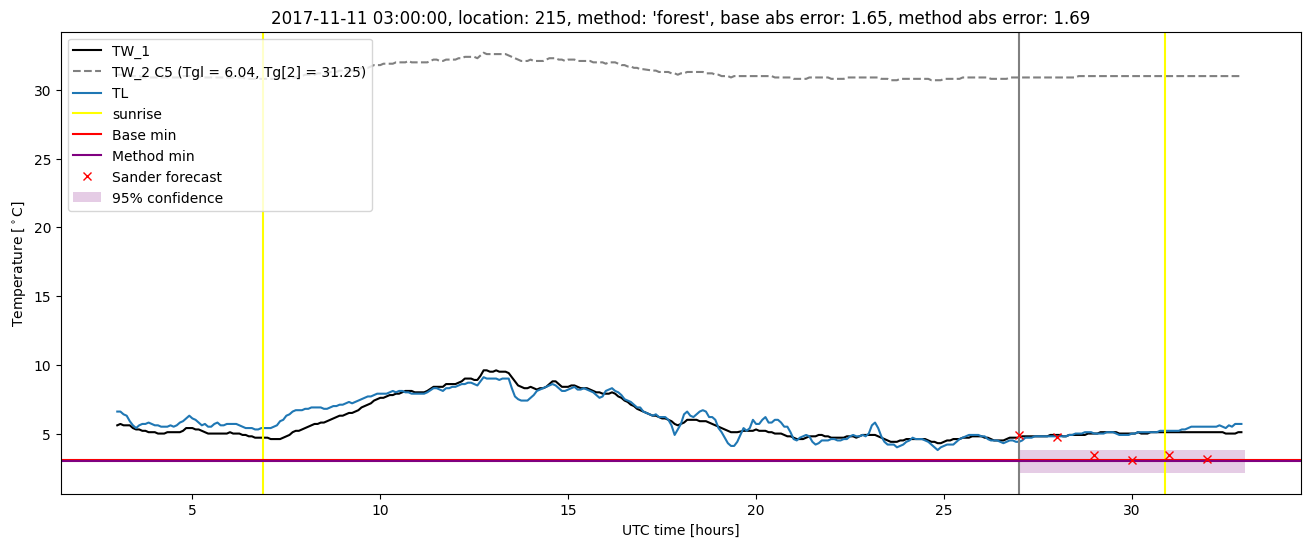
Random forest plots
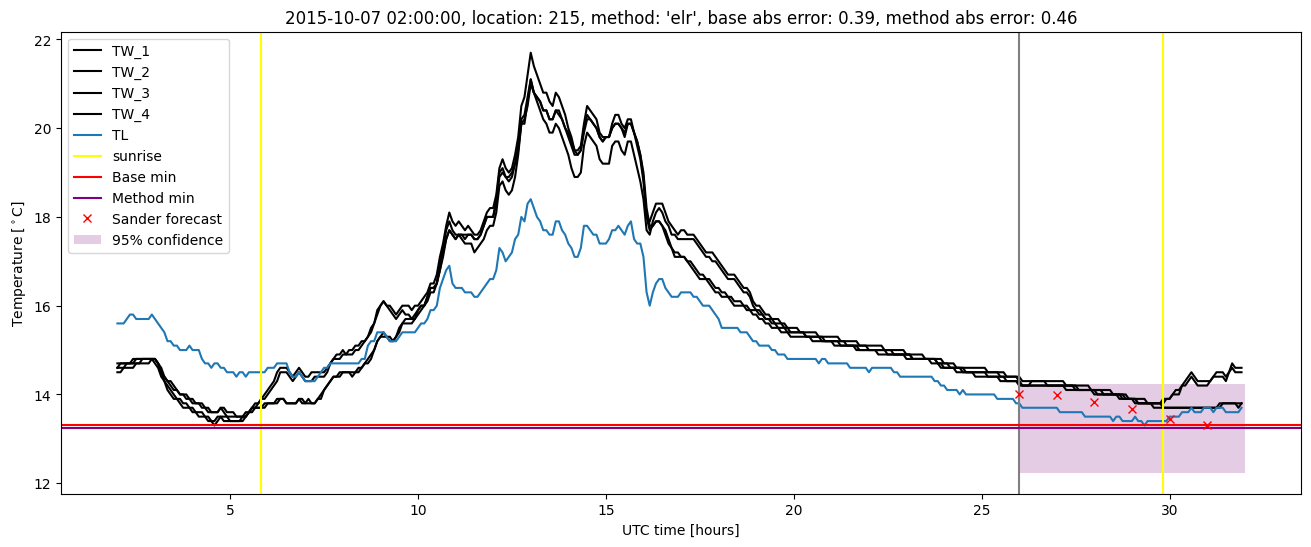
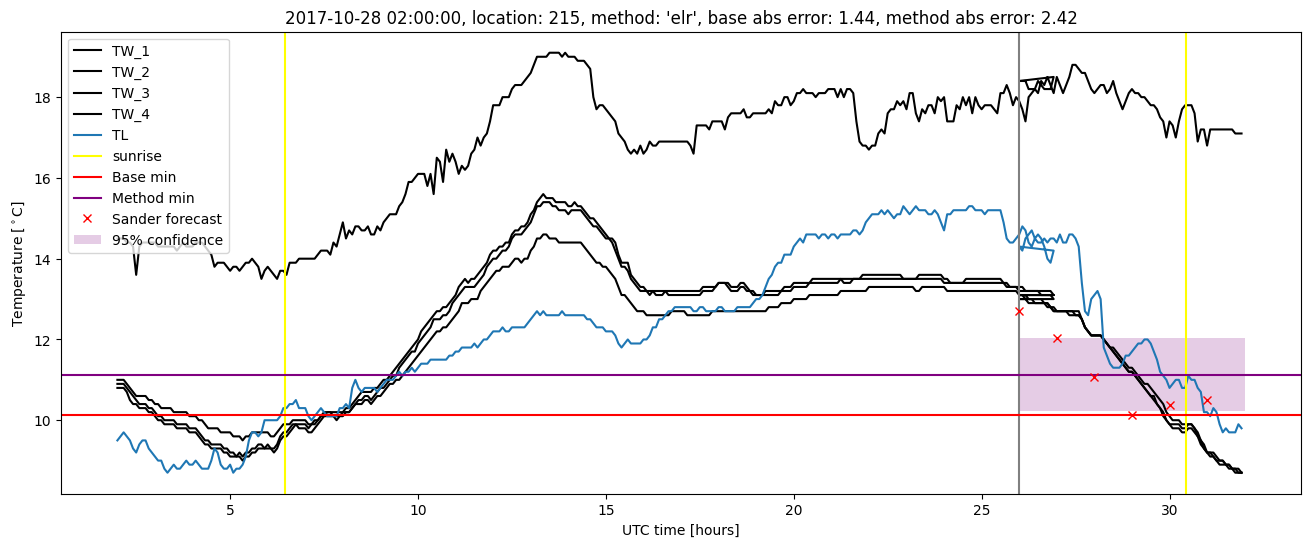
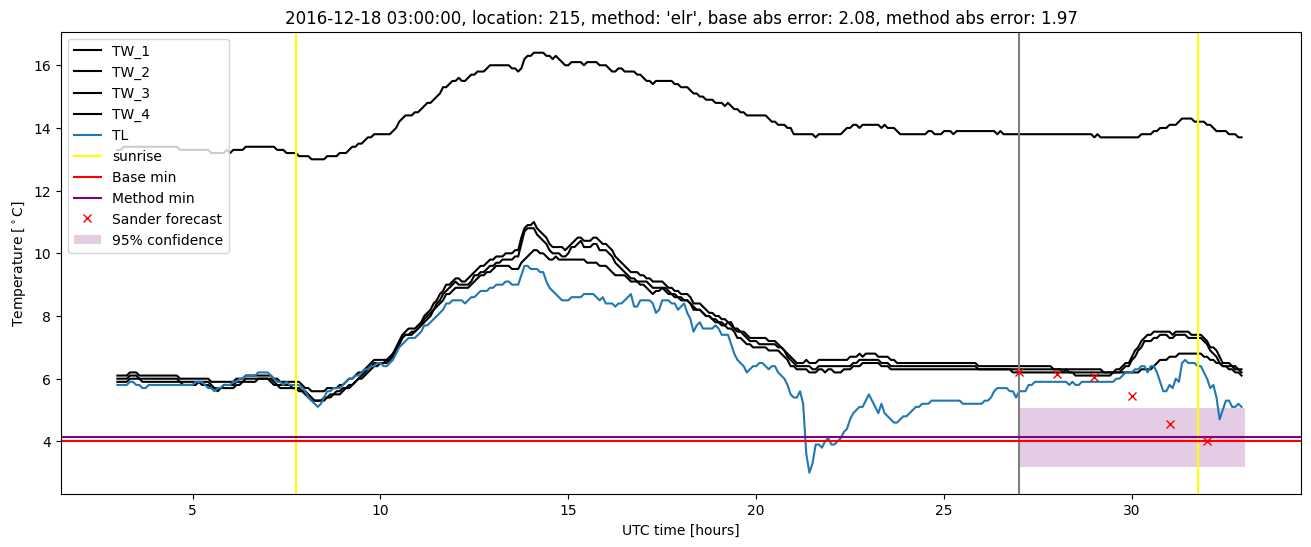
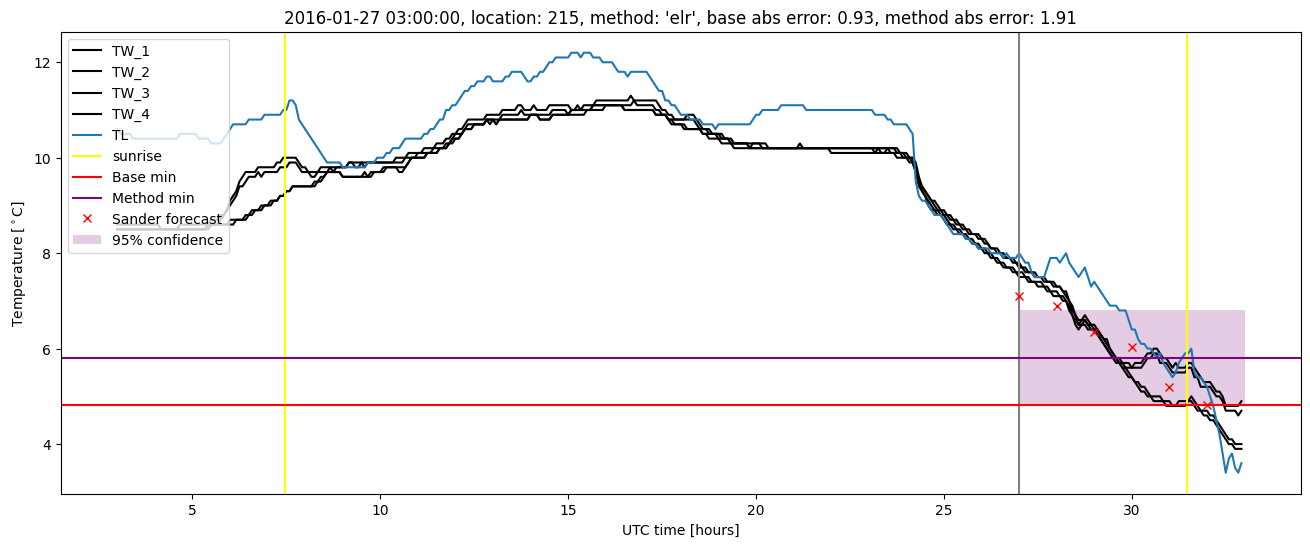
Extended logistic regression results
| names |
period |
power |
significance |
meanSquareError |
absError |
maxError |
CRPS |
IGN |
| baseline |
winter 2016 |
0.965 |
0.000e+00 |
0.391 |
0.480 |
1.987 |
NaN |
NaN |
| elr |
winter 2016 |
0.965 |
0.000e+00 |
0.386 |
0.486 |
1.905 |
0.509 |
2.562 |
| baseline |
winter 2017 |
0.975 |
0.061 |
0.468 |
0.517 |
2.315 |
NaN |
NaN |
| elr |
winter 2017 |
1.000 |
0.091 |
0.364 |
0.463 |
1.970 |
0.475 |
2.770 |
| baseline |
winter 2018 |
1.000 |
NaN |
0.486 |
0.456 |
2.359 |
NaN |
NaN |
| elr |
winter 2018 |
1.000 |
NaN |
0.492 |
0.517 |
2.421 |
0.529 |
3.664 |
| baseline |
winter 2019 |
1.000 |
NaN |
0.218 |
0.353 |
1.161 |
NaN |
NaN |
| elr |
winter 2019 |
1.000 |
NaN |
0.383 |
0.509 |
1.167 |
0.418 |
2.004 |
| baseline |
all |
0.975 |
0.037 |
0.424 |
0.485 |
2.359 |
NaN |
NaN |
| elr |
all |
0.983 |
0.056 |
0.391 |
0.482 |
2.421 |
0.495 |
2.752 |
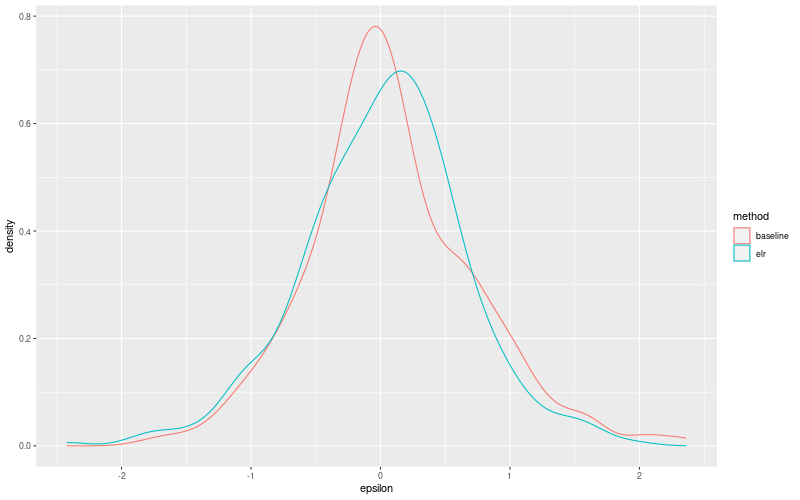
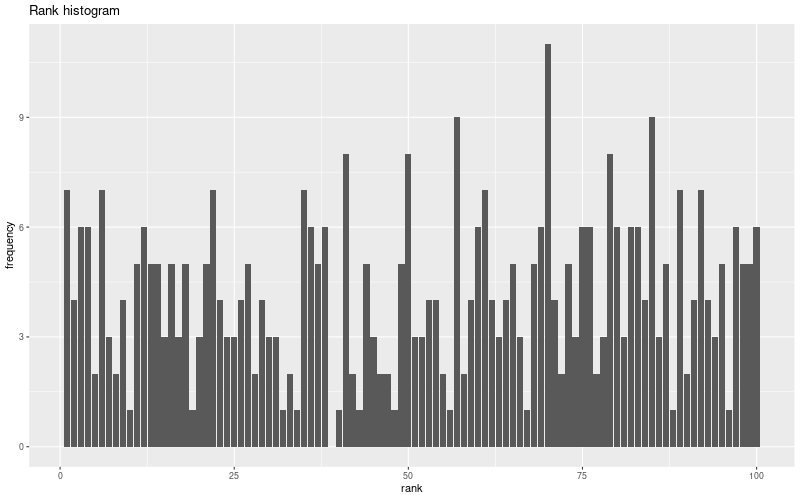
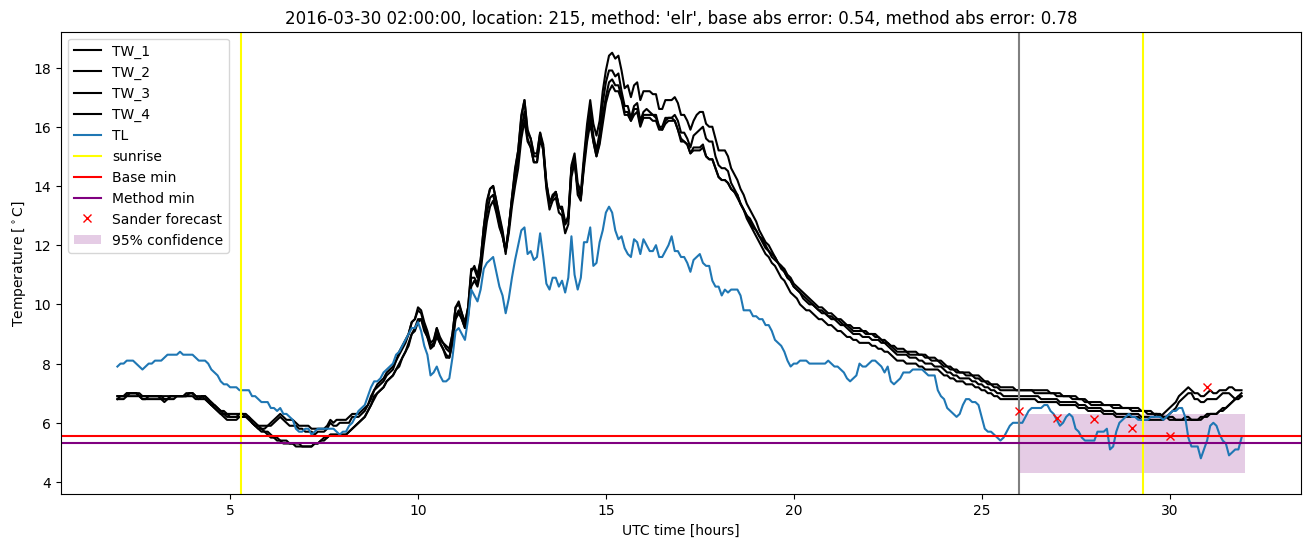
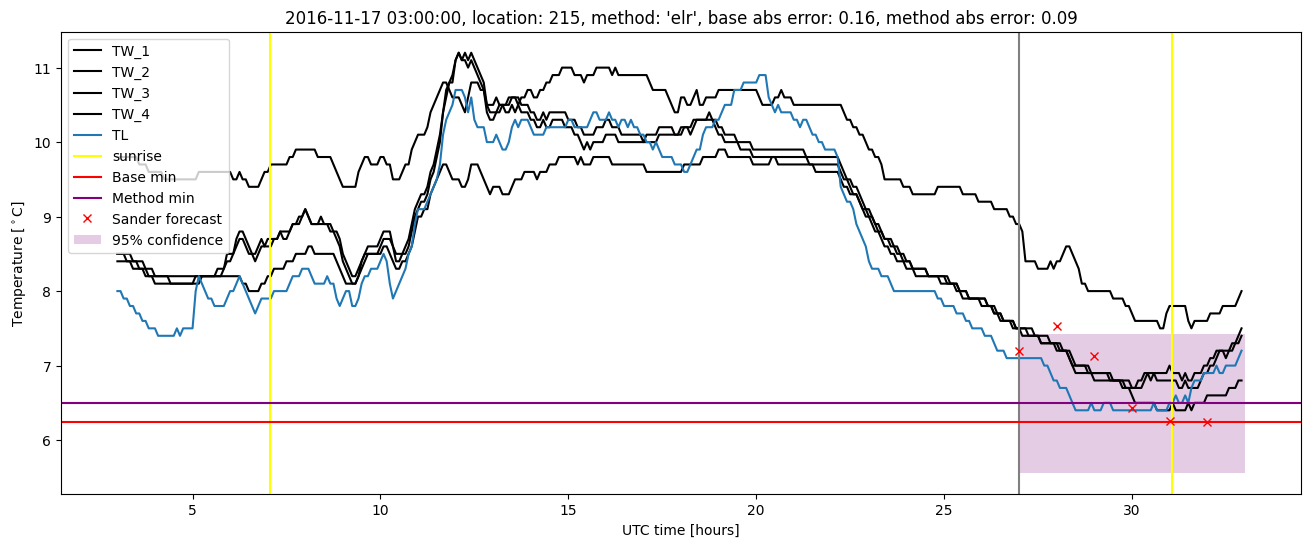
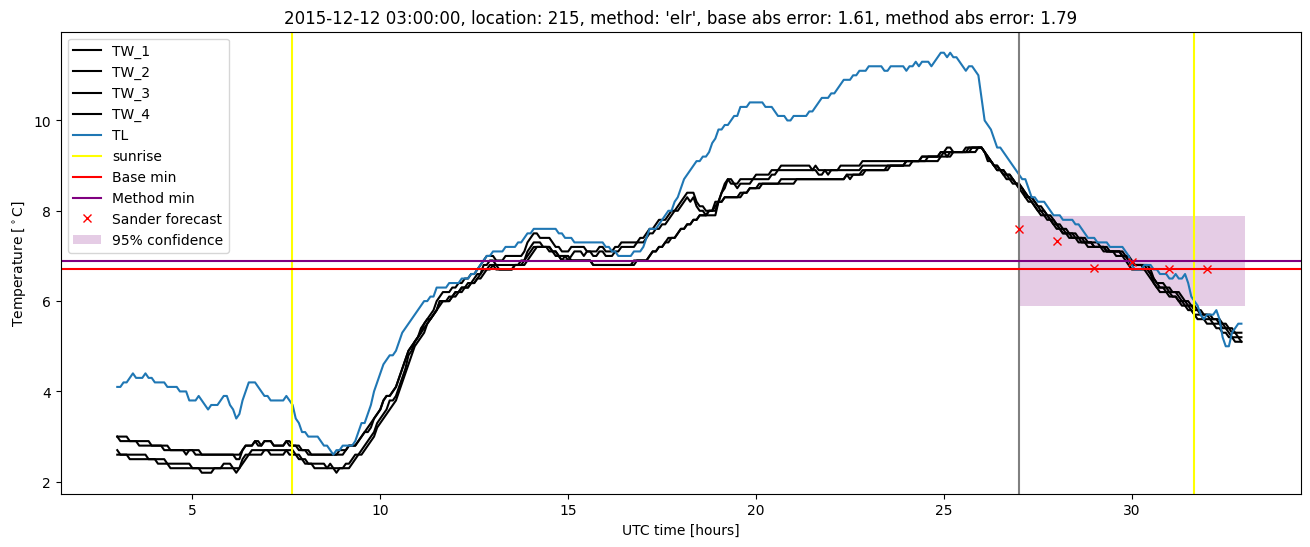
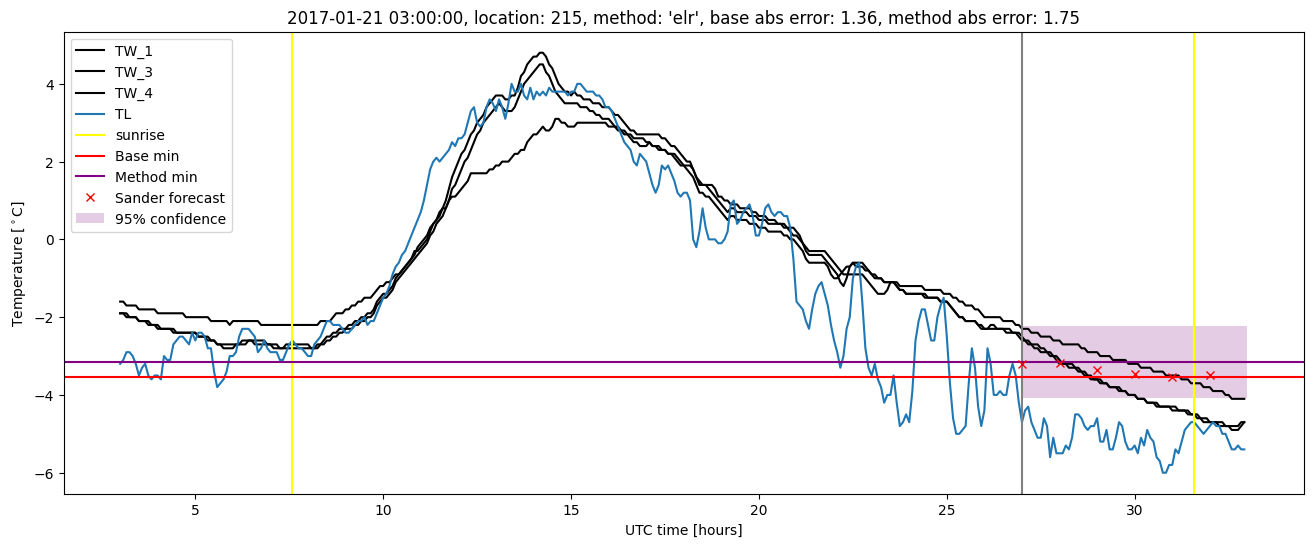
Extended logistic regression plots