GMS location: 214
Random forest results
| names |
period |
power |
significance |
meanSquareError |
absError |
maxError |
CRPS |
IGN |
| baseline |
winter 2016 |
0.977 |
0.053 |
0.276 |
0.385 |
1.734 |
NaN |
NaN |
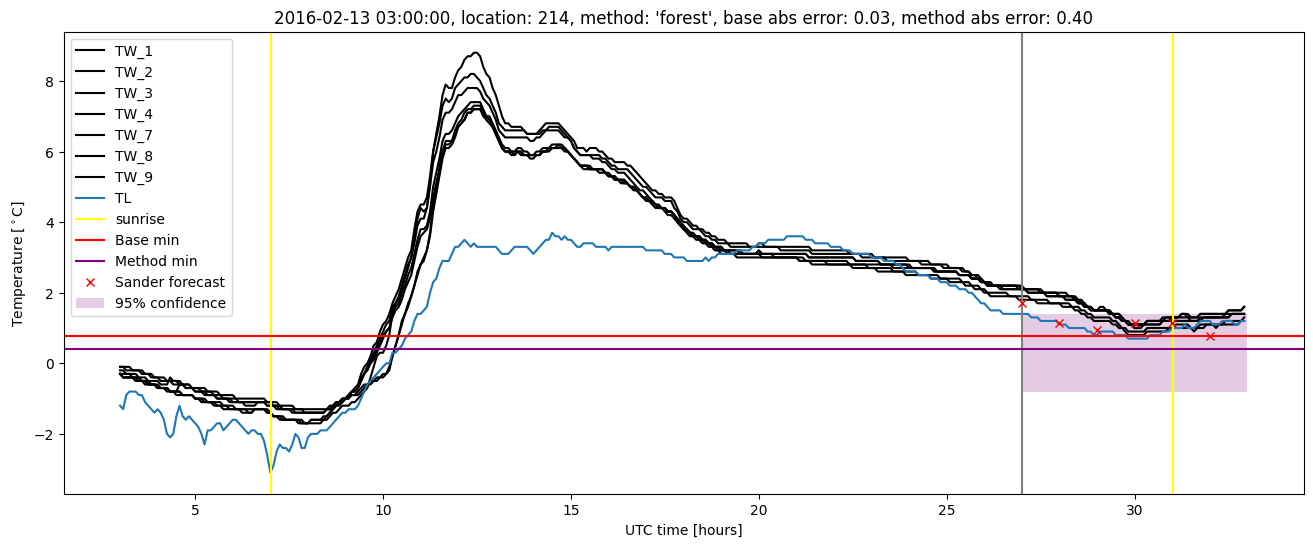
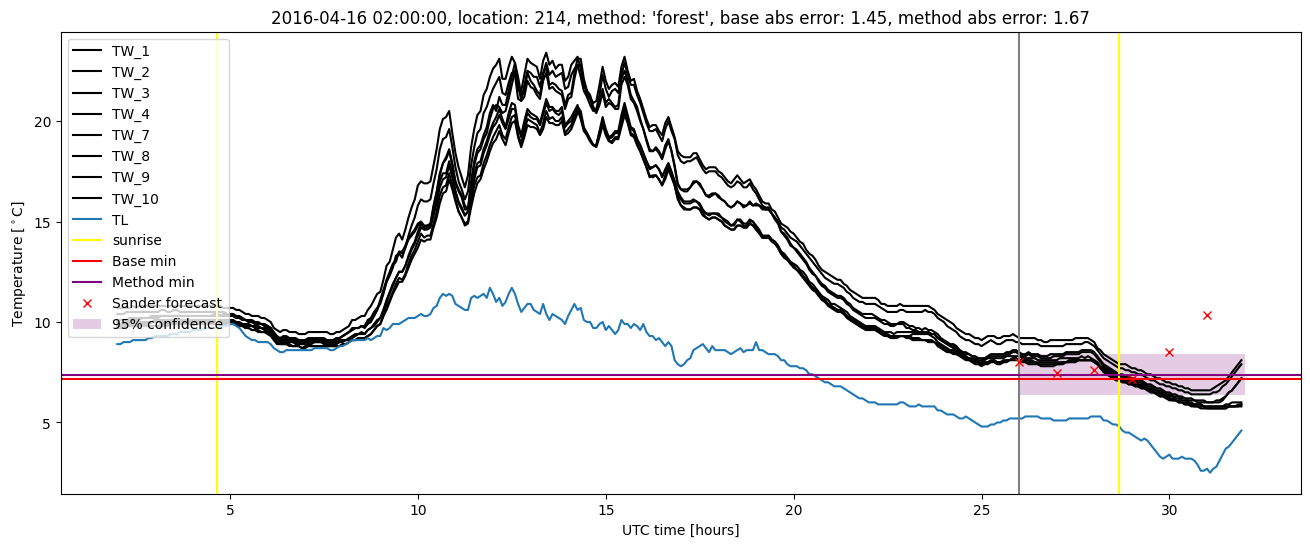
| forest |
winter 2016 |
0.966 |
0.053 |
0.233 |
0.353 |
1.669 |
0.525 |
7.150 |
| baseline |
winter 2017 |
0.946 |
0.024 |
0.409 |
0.474 |
1.951 |
NaN |
NaN |
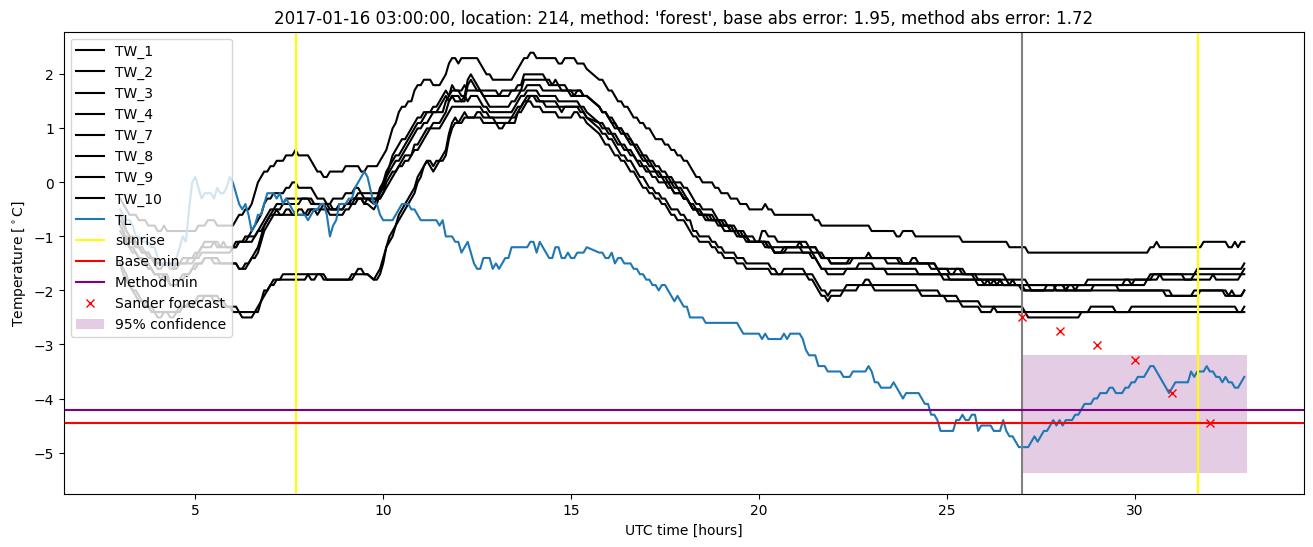
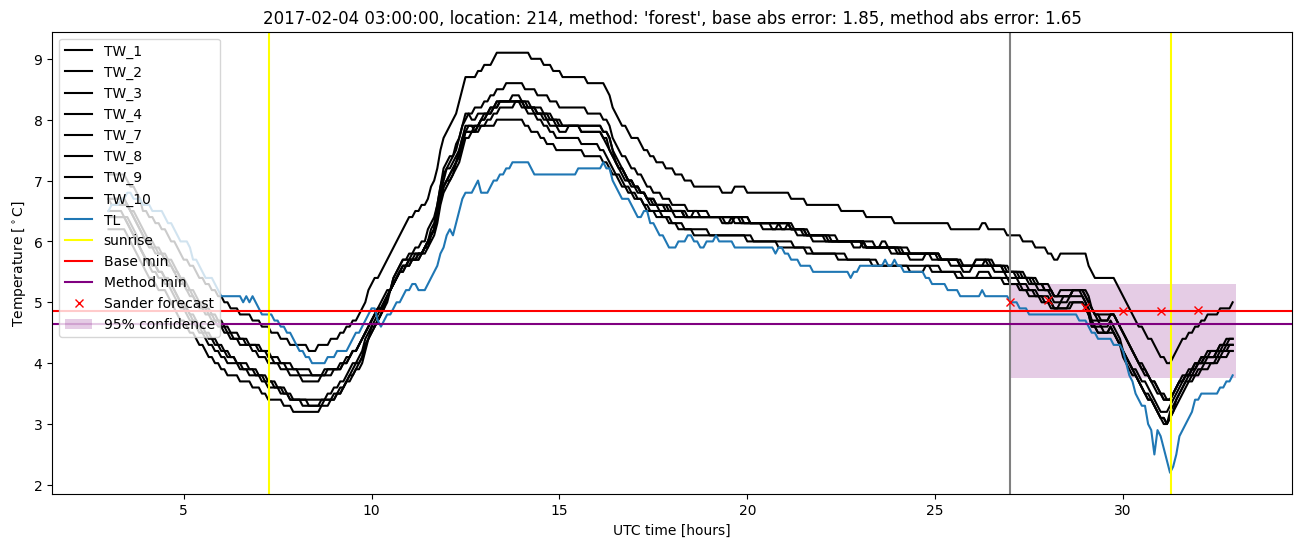
| forest |
winter 2017 |
0.946 |
0.049 |
0.350 |
0.433 |
1.717 |
0.533 |
6.426 |
| baseline |
winter 2018 |
0.984 |
0.175 |
0.312 |
0.424 |
1.486 |
NaN |
NaN |
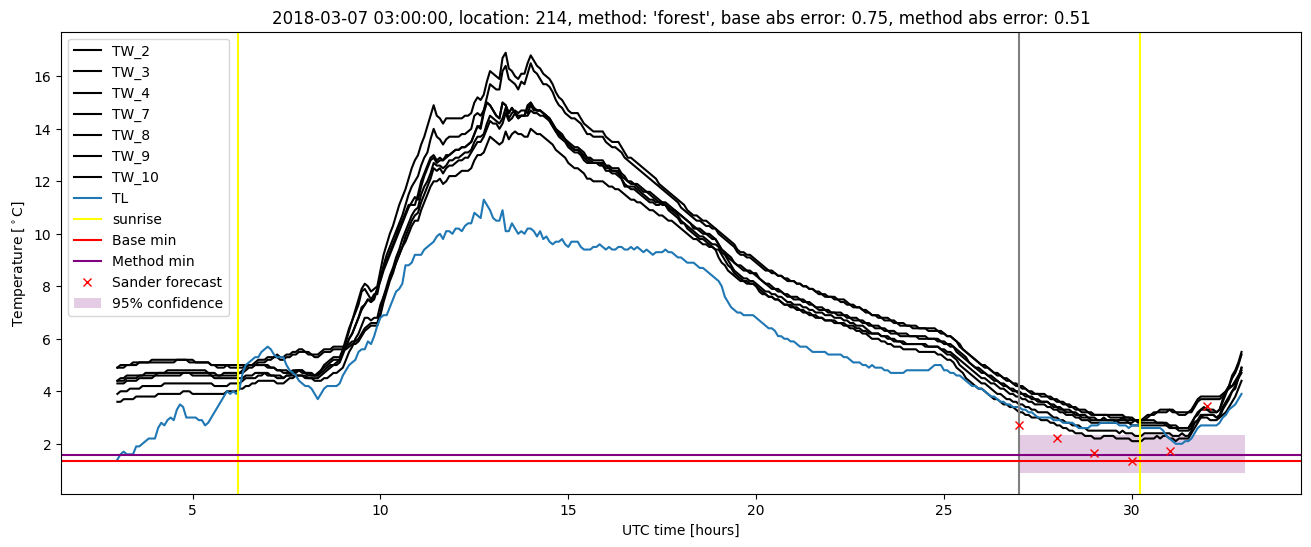
| forest |
winter 2018 |
0.984 |
0.125 |
0.279 |
0.402 |
1.605 |
0.530 |
4.540 |
| baseline |
winter 2019 |
1.000 |
0.067 |
0.276 |
0.399 |
1.610 |
NaN |
NaN |
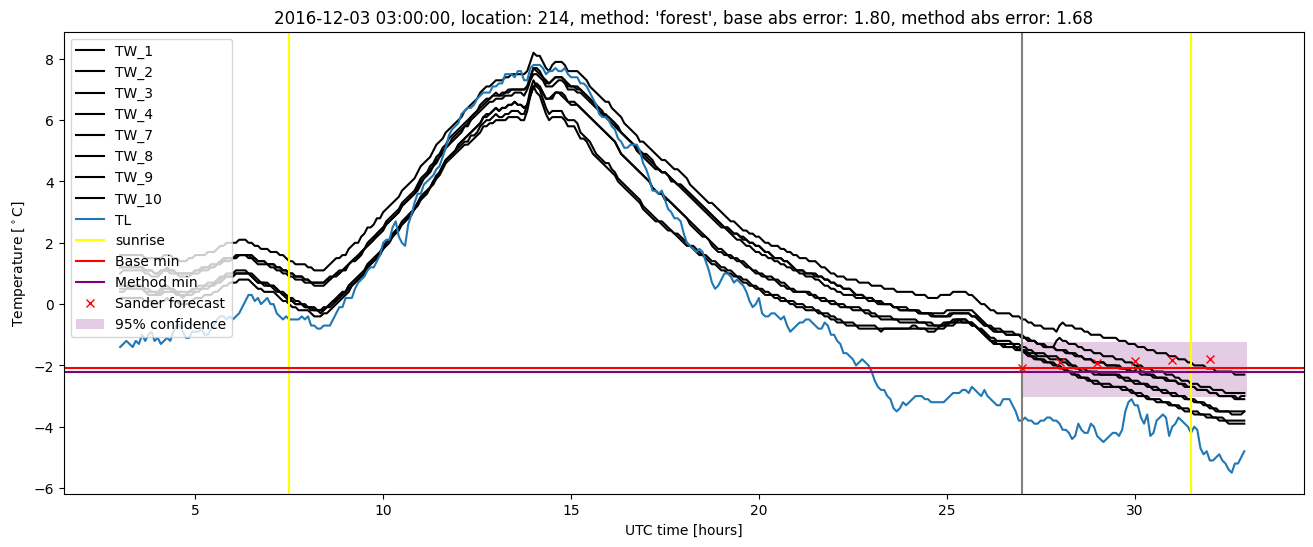
| forest |
winter 2019 |
1.000 |
0.133 |
0.230 |
0.351 |
1.393 |
0.525 |
5.544 |
| baseline |
all |
0.978 |
0.087 |
0.316 |
0.418 |
1.951 |
NaN |
NaN |
| forest |
all |
0.974 |
0.087 |
0.271 |
0.383 |
1.717 |
0.528 |
5.973 |
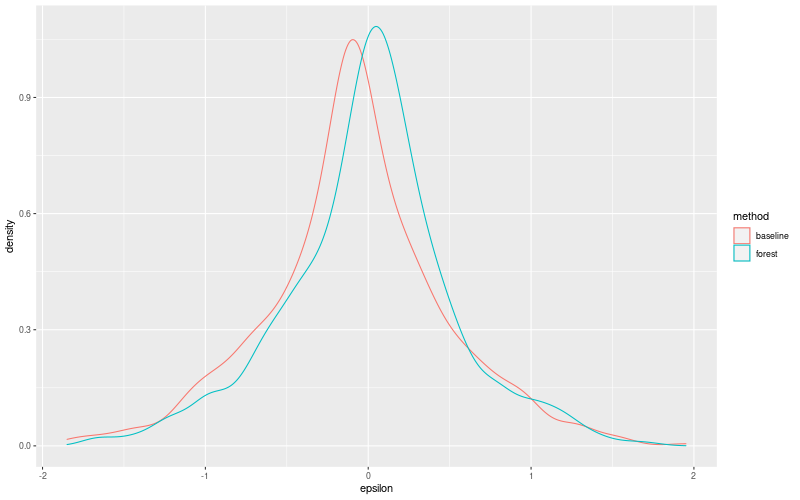
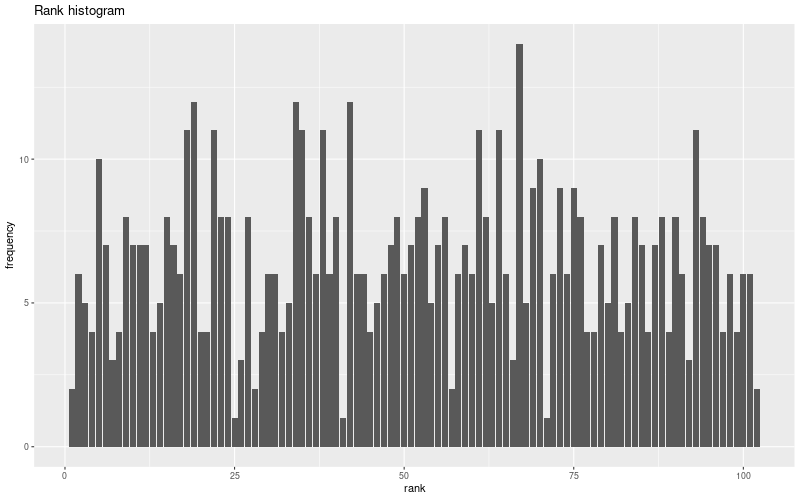
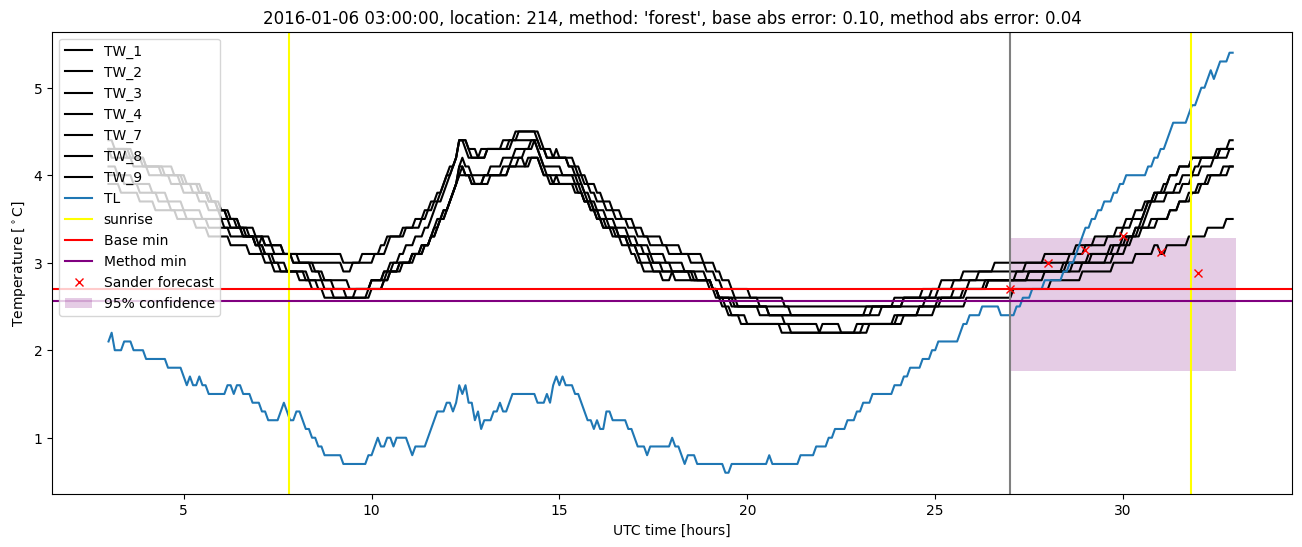
Random forest plots

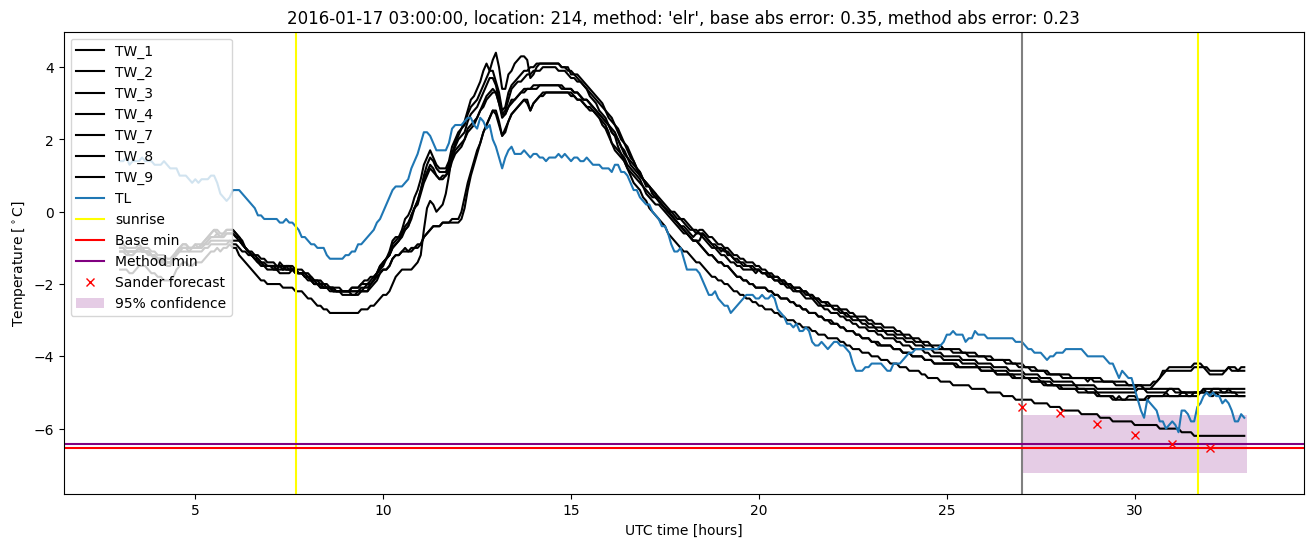
Extended logistic regression results
| names |
period |
power |
significance |
meanSquareError |
absError |
maxError |
CRPS |
IGN |
| baseline |
winter 2016 |
0.977 |
0.053 |
0.276 |
0.385 |
1.734 |
NaN |
NaN |
| elr |
winter 2016 |
0.971 |
0.053 |
0.255 |
0.387 |
1.508 |
0.613 |
7.753 |
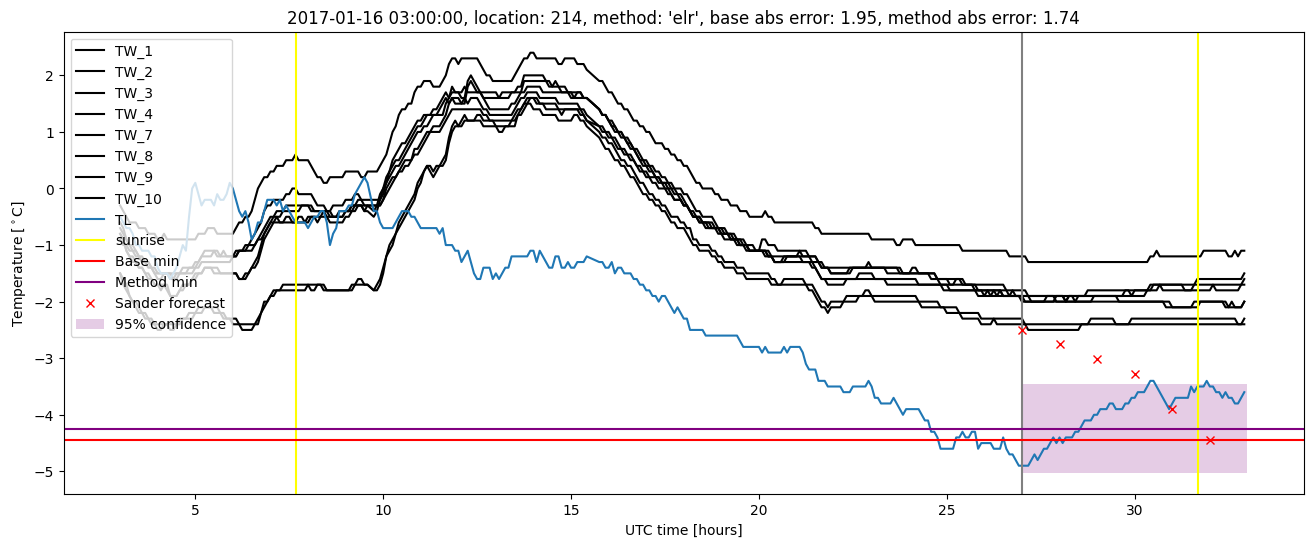
| baseline |
winter 2017 |
0.946 |
0.024 |
0.409 |
0.474 |
1.951 |
NaN |
NaN |
| elr |
winter 2017 |
0.938 |
0.049 |
0.355 |
0.459 |
1.744 |
0.633 |
8.630 |
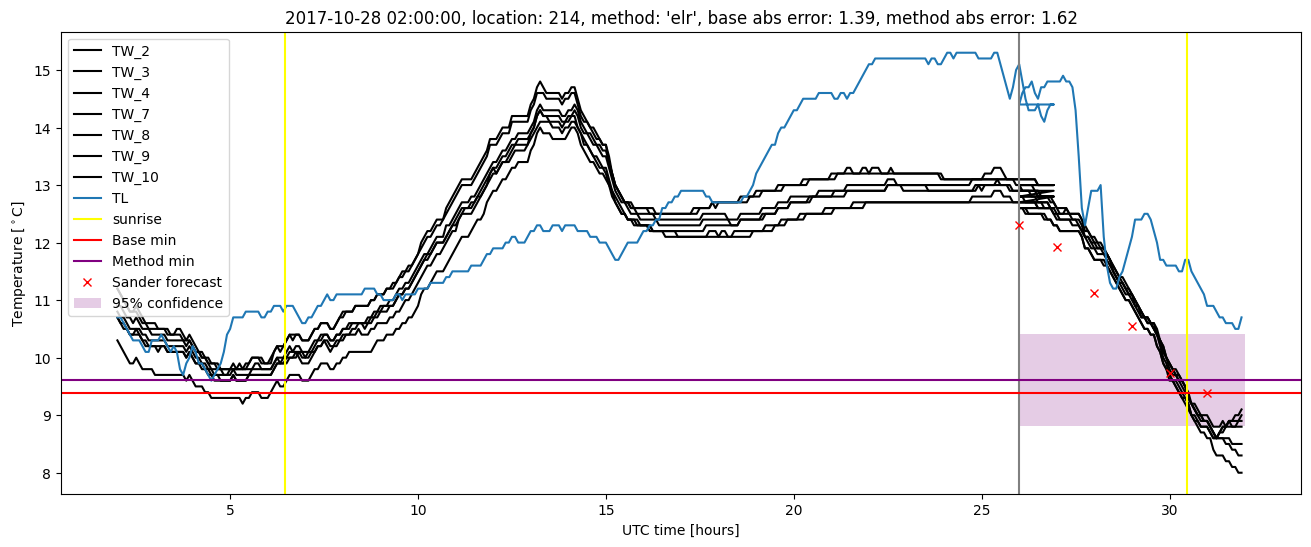
| baseline |
winter 2018 |
0.984 |
0.175 |
0.312 |
0.424 |
1.486 |
NaN |
NaN |
| elr |
winter 2018 |
0.976 |
0.075 |
0.295 |
0.426 |
1.616 |
0.605 |
7.271 |
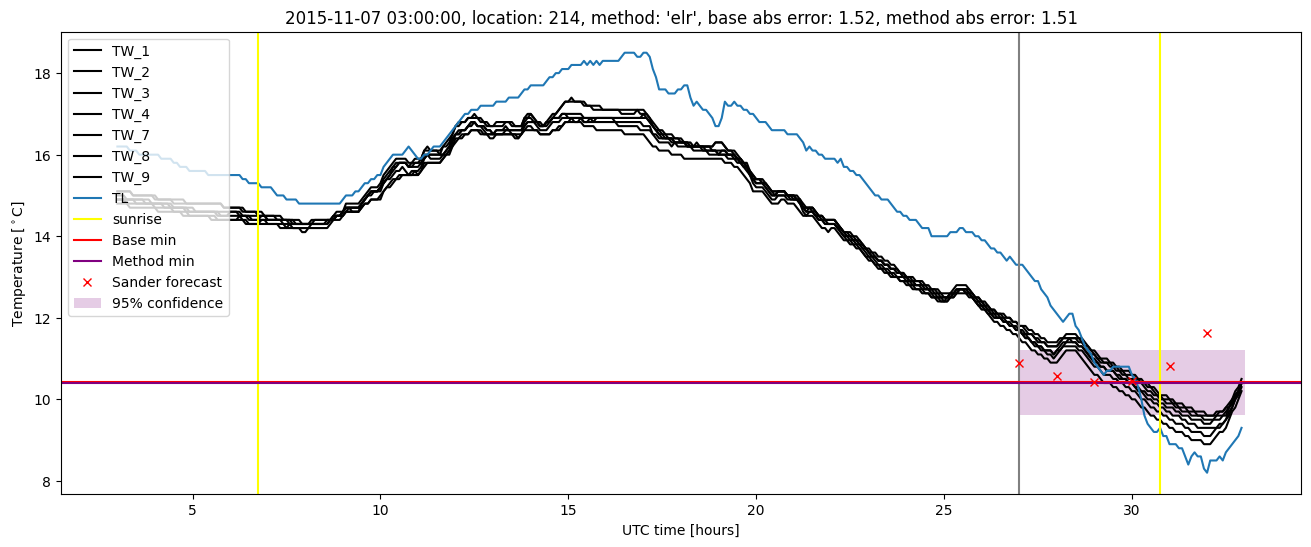
| baseline |
winter 2019 |
1.000 |
0.067 |
0.276 |
0.399 |
1.610 |
NaN |
NaN |
| elr |
winter 2019 |
1.000 |
0.133 |
0.223 |
0.367 |
1.158 |
0.599 |
6.449 |
| baseline |
all |
0.978 |
0.087 |
0.316 |
0.418 |
1.951 |
NaN |
NaN |
| elr |
all |
0.972 |
0.070 |
0.281 |
0.409 |
1.744 |
0.613 |
7.543 |
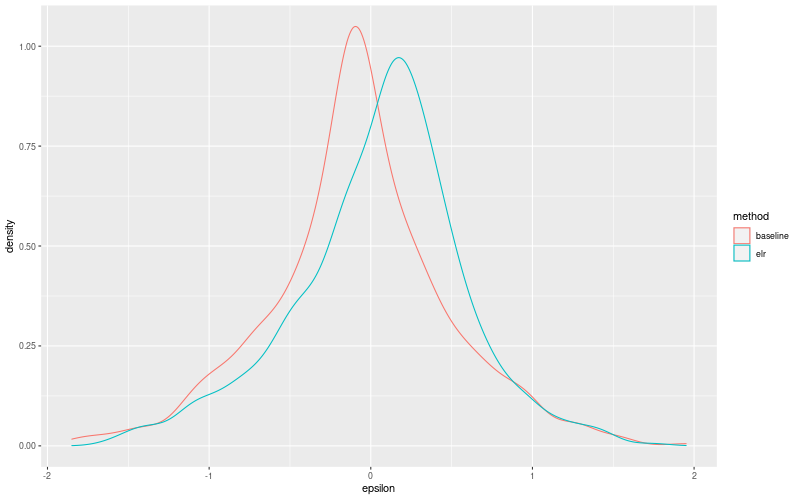
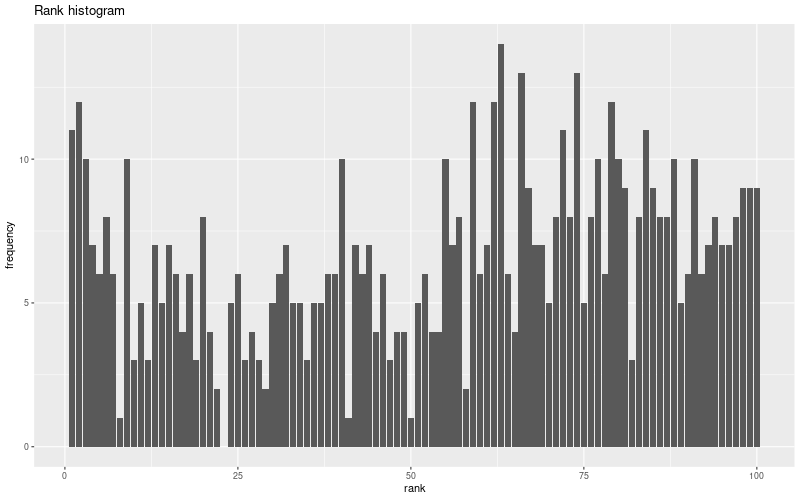
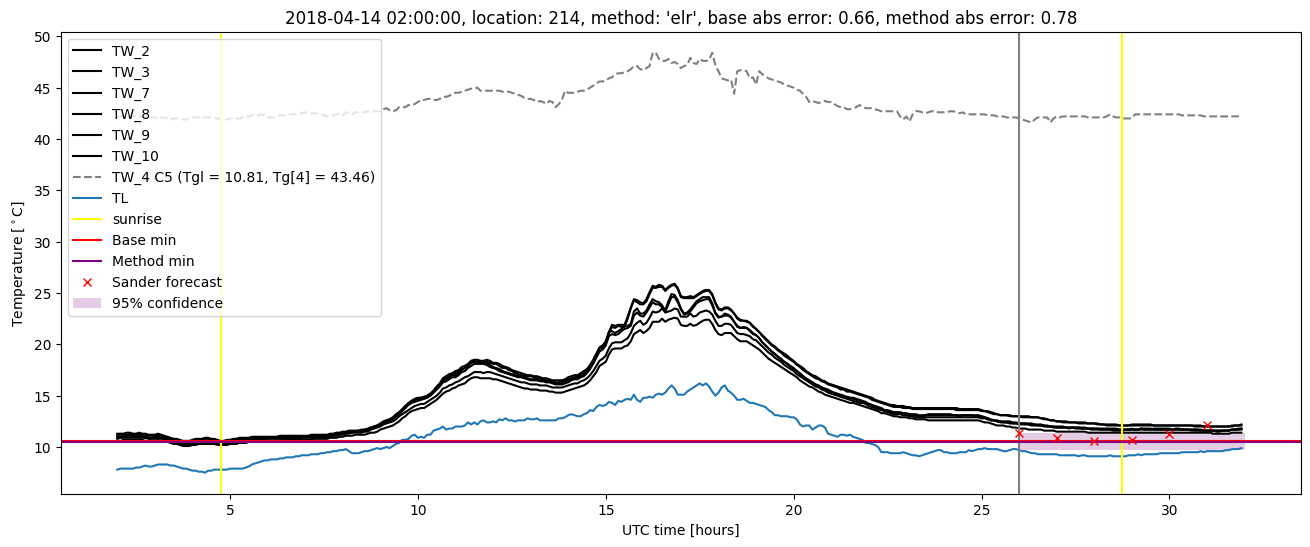
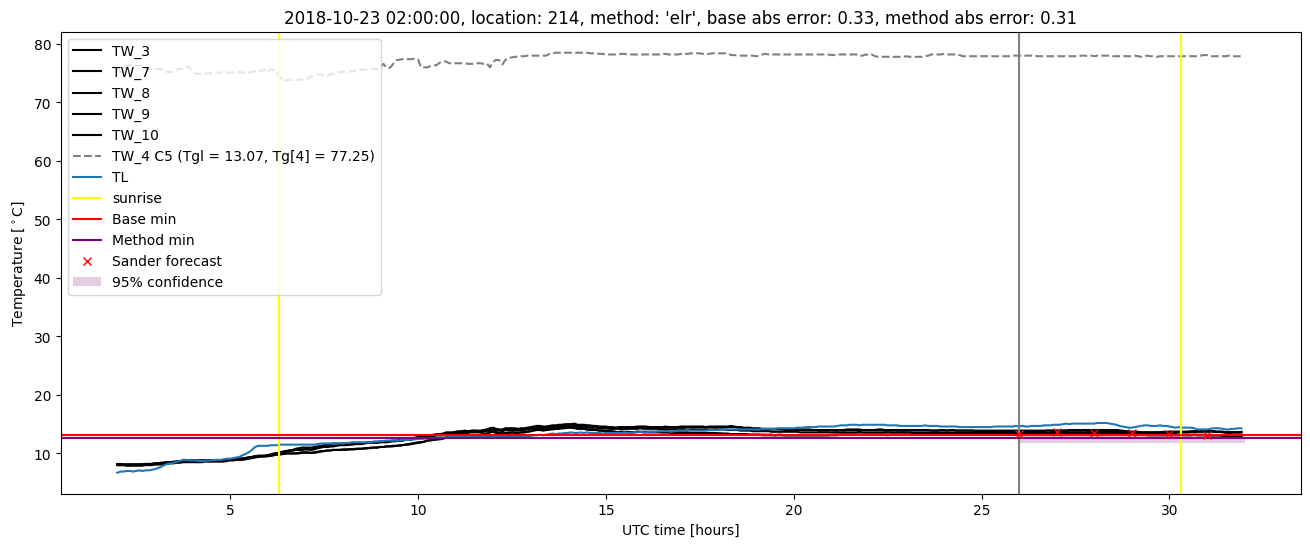
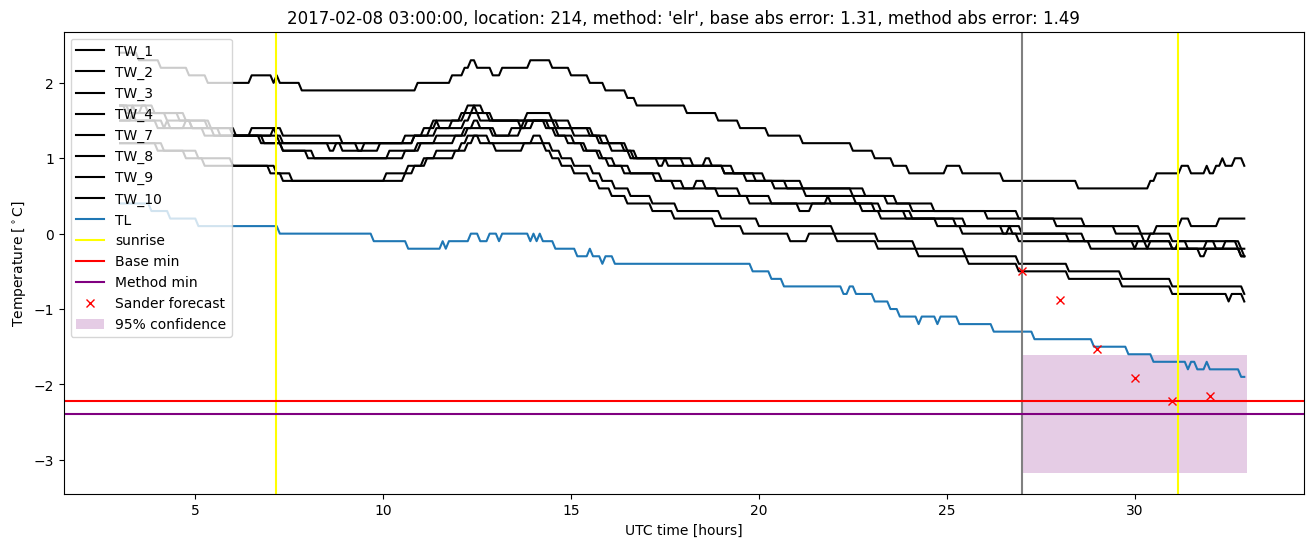
Extended logistic regression plots