GMS location: 213
Random forest results
| names |
period |
power |
significance |
meanSquareError |
absError |
maxError |
CRPS |
IGN |
| baseline |
winter 2016 |
0.989 |
0.167 |
0.299 |
0.397 |
1.737 |
NaN |
NaN |
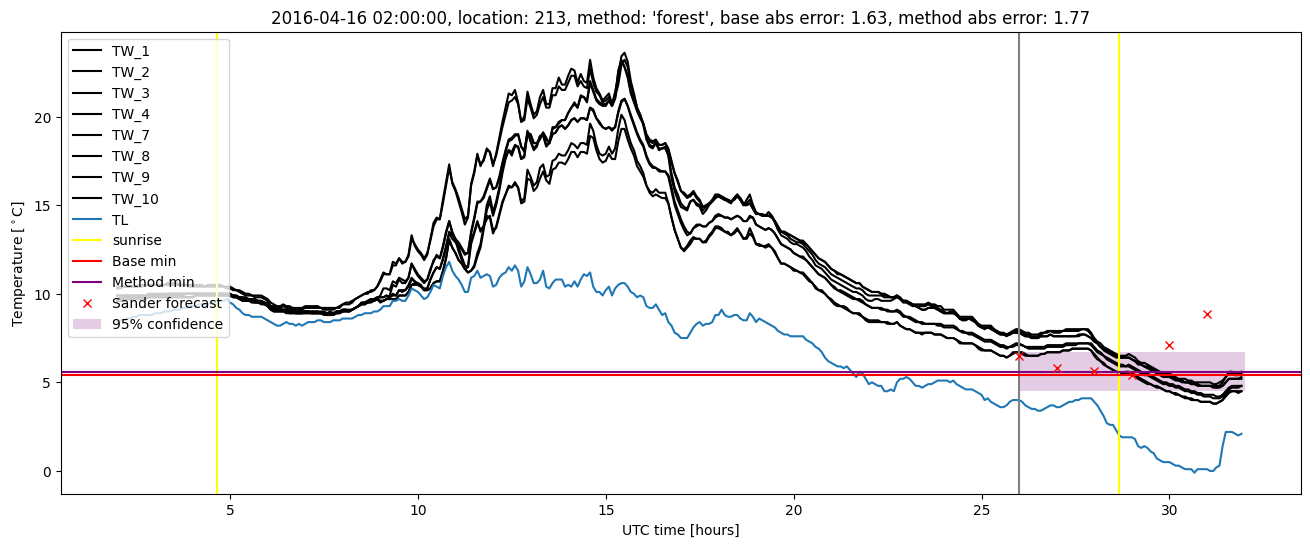
| forest |
winter 2016 |
0.994 |
0.167 |
0.257 |
0.377 |
1.770 |
0.509 |
3.687 |
| baseline |
winter 2017 |
0.963 |
0.048 |
0.438 |
0.494 |
2.171 |
NaN |
NaN |
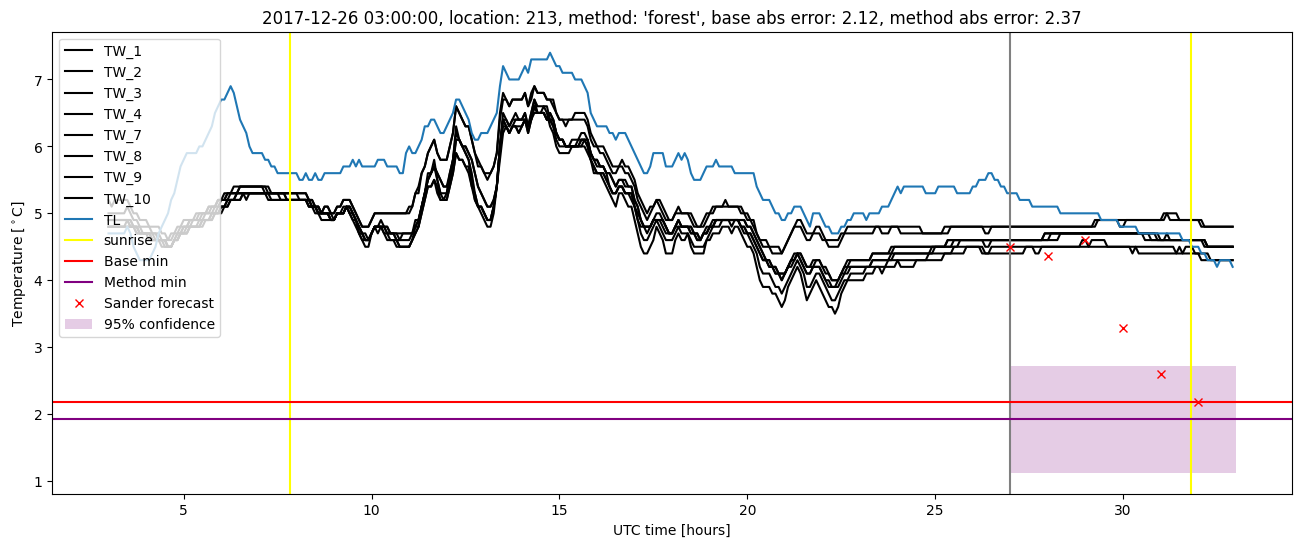
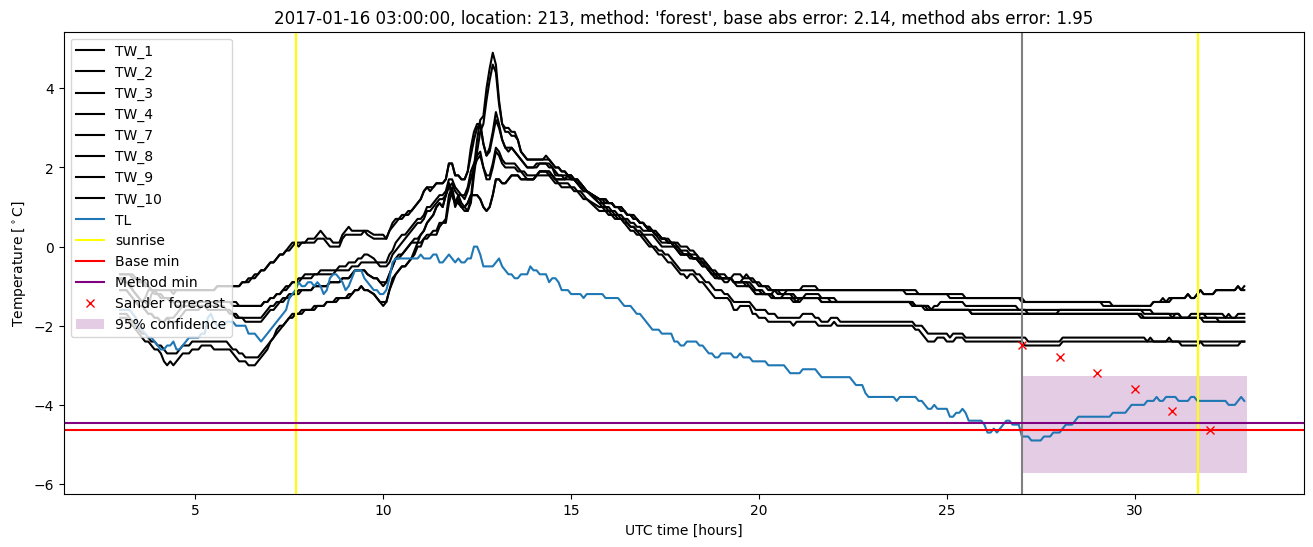
| forest |
winter 2017 |
0.963 |
0.024 |
0.370 |
0.452 |
1.953 |
0.516 |
3.809 |
| baseline |
winter 2018 |
0.993 |
0.111 |
0.407 |
0.479 |
2.121 |
NaN |
NaN |
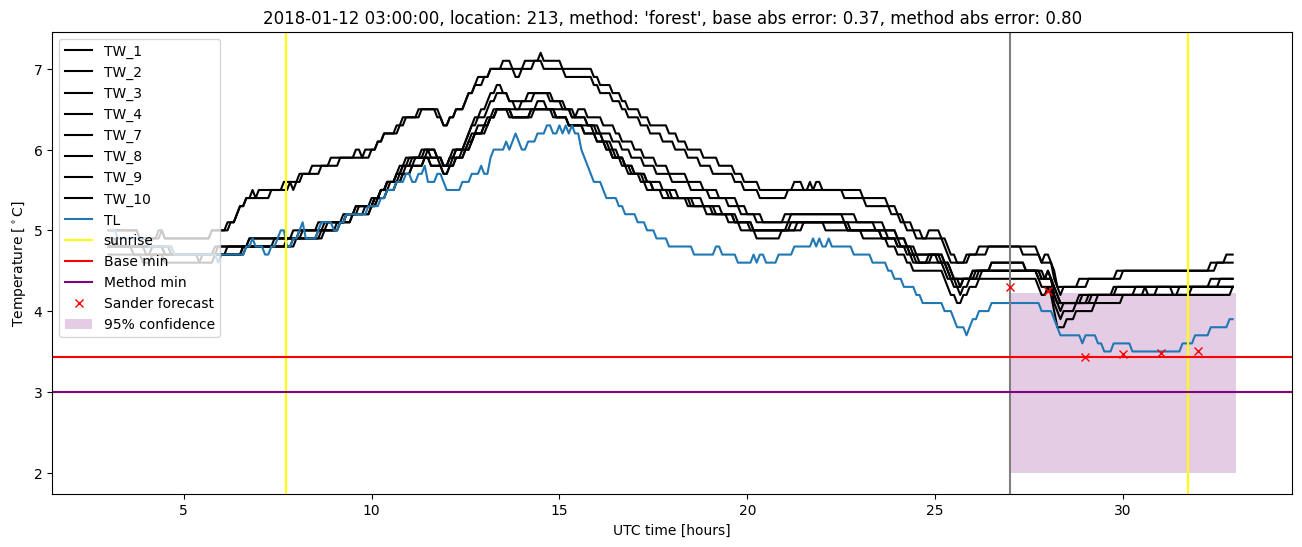
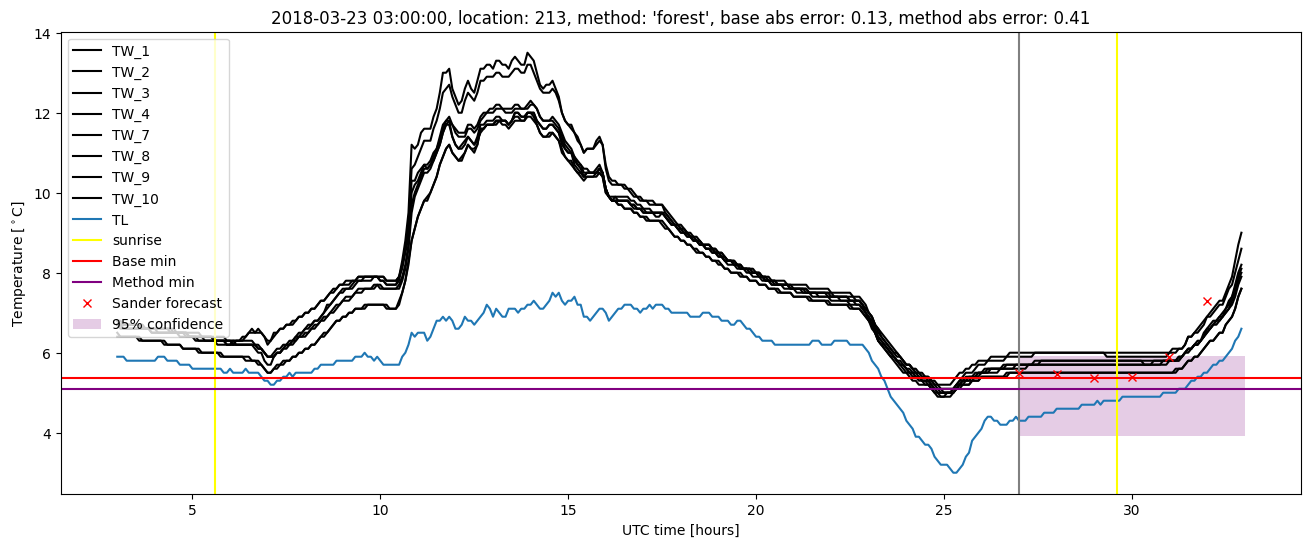
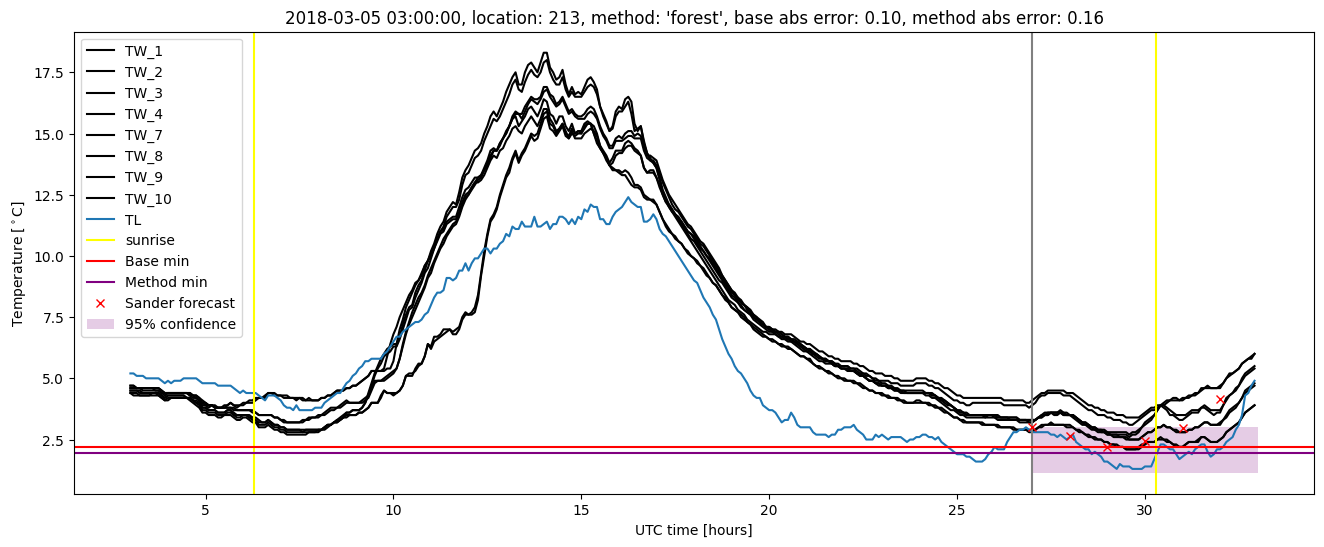
| forest |
winter 2018 |
0.986 |
0.056 |
0.368 |
0.454 |
2.370 |
0.547 |
3.820 |
| baseline |
winter 2019 |
0.984 |
0.000e+00 |
0.341 |
0.469 |
1.360 |
NaN |
NaN |
| forest |
winter 2019 |
1.000 |
0.000e+00 |
0.277 |
0.401 |
1.231 |
0.492 |
3.424 |
| baseline |
all |
0.984 |
0.093 |
0.370 |
0.454 |
2.171 |
NaN |
NaN |
| forest |
all |
0.986 |
0.068 |
0.320 |
0.421 |
2.370 |
0.520 |
3.724 |
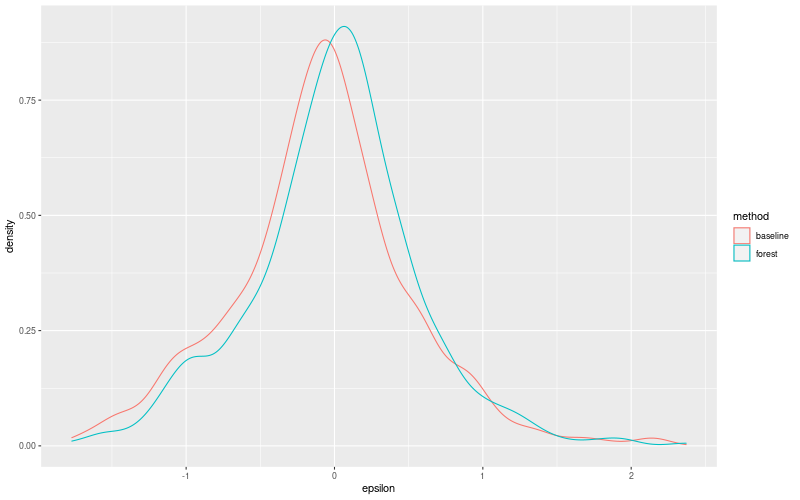
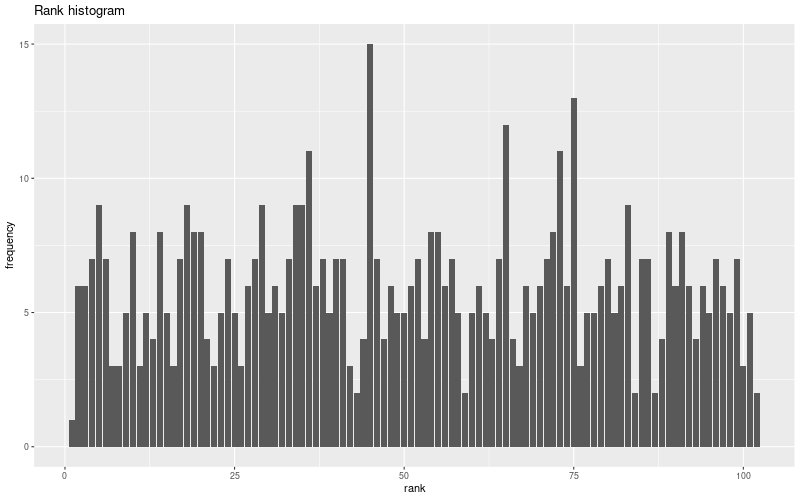
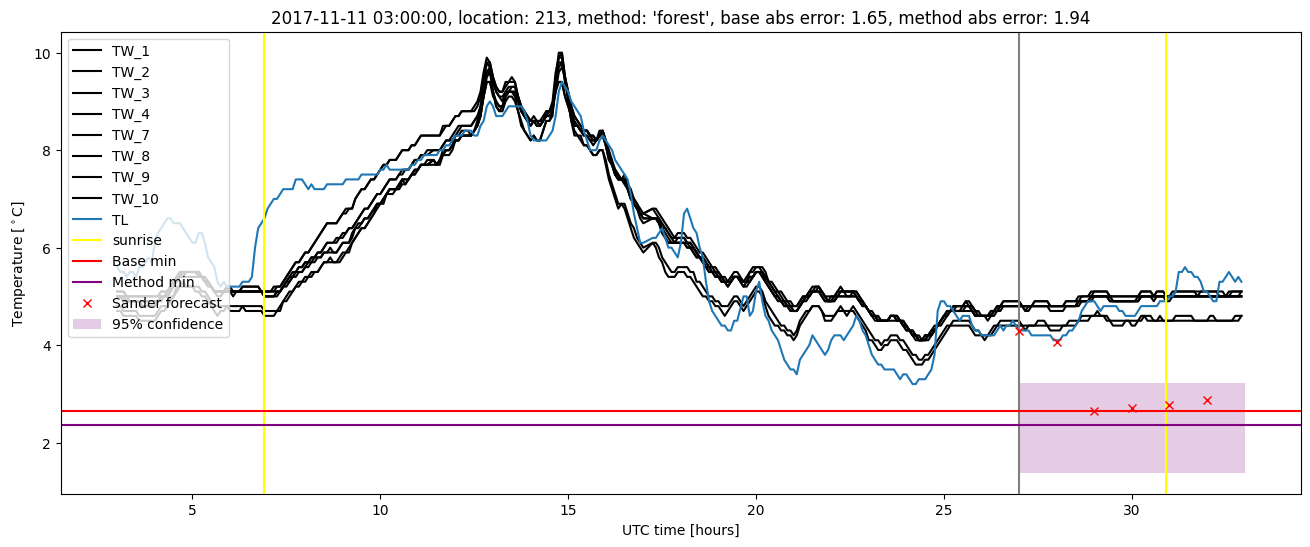
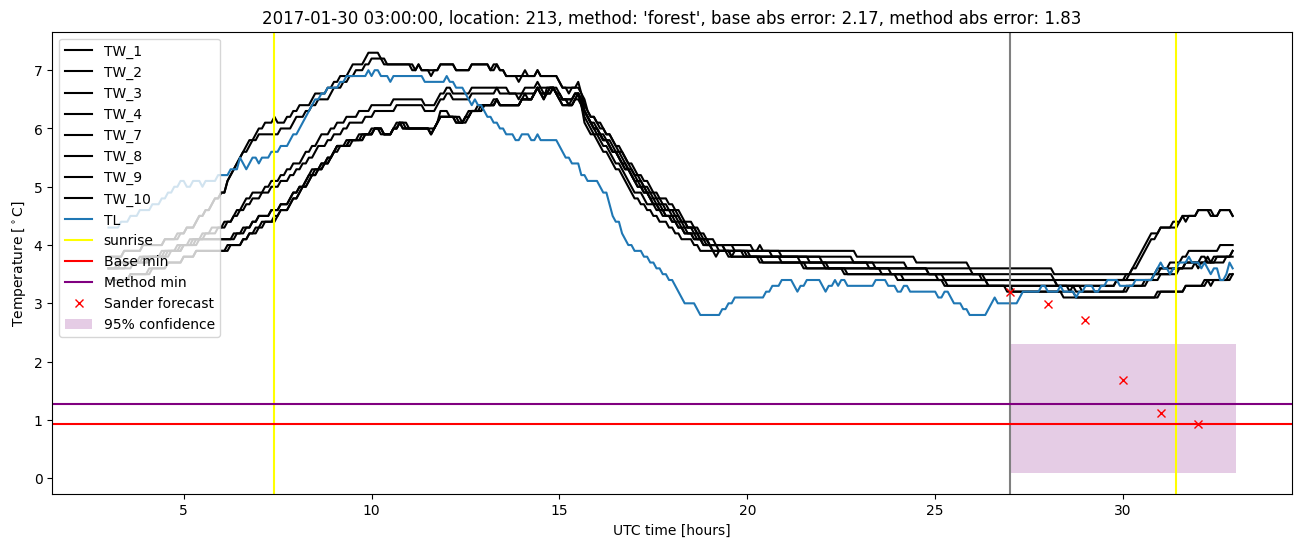
Random forest plots
Extended logistic regression results
| names |
period |
power |
significance |
meanSquareError |
absError |
maxError |
CRPS |
IGN |
| baseline |
winter 2016 |
0.989 |
0.167 |
0.299 |
0.397 |
1.737 |
NaN |
NaN |
| elr |
winter 2016 |
0.994 |
0.233 |
0.290 |
0.407 |
1.739 |
0.572 |
3.522 |
| baseline |
winter 2017 |
0.963 |
0.048 |
0.438 |
0.494 |
2.171 |
NaN |
NaN |
| elr |
winter 2017 |
0.963 |
0.048 |
0.388 |
0.473 |
2.168 |
0.575 |
4.629 |
| baseline |
winter 2018 |
0.993 |
0.111 |
0.407 |
0.479 |
2.121 |
NaN |
NaN |
| elr |
winter 2018 |
0.979 |
0.056 |
0.387 |
0.480 |
2.416 |
0.598 |
4.810 |
| baseline |
winter 2019 |
0.984 |
0.000e+00 |
0.341 |
0.469 |
1.360 |
NaN |
NaN |
| elr |
winter 2019 |
0.984 |
0.000e+00 |
0.287 |
0.414 |
1.367 |
0.530 |
3.389 |
| baseline |
all |
0.984 |
0.093 |
0.370 |
0.454 |
2.171 |
NaN |
NaN |
| elr |
all |
0.982 |
0.093 |
0.342 |
0.445 |
2.416 |
0.575 |
4.154 |
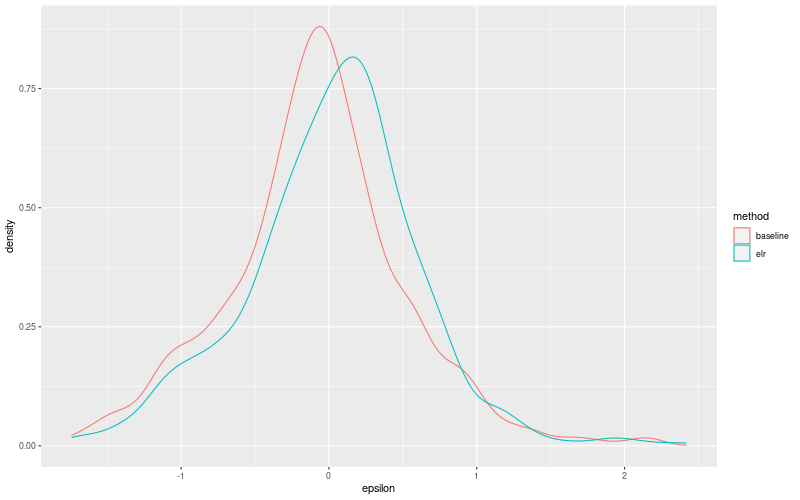
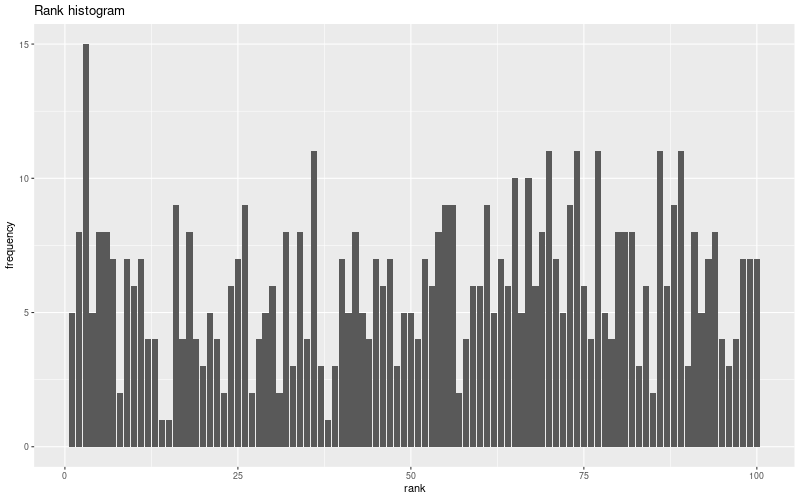
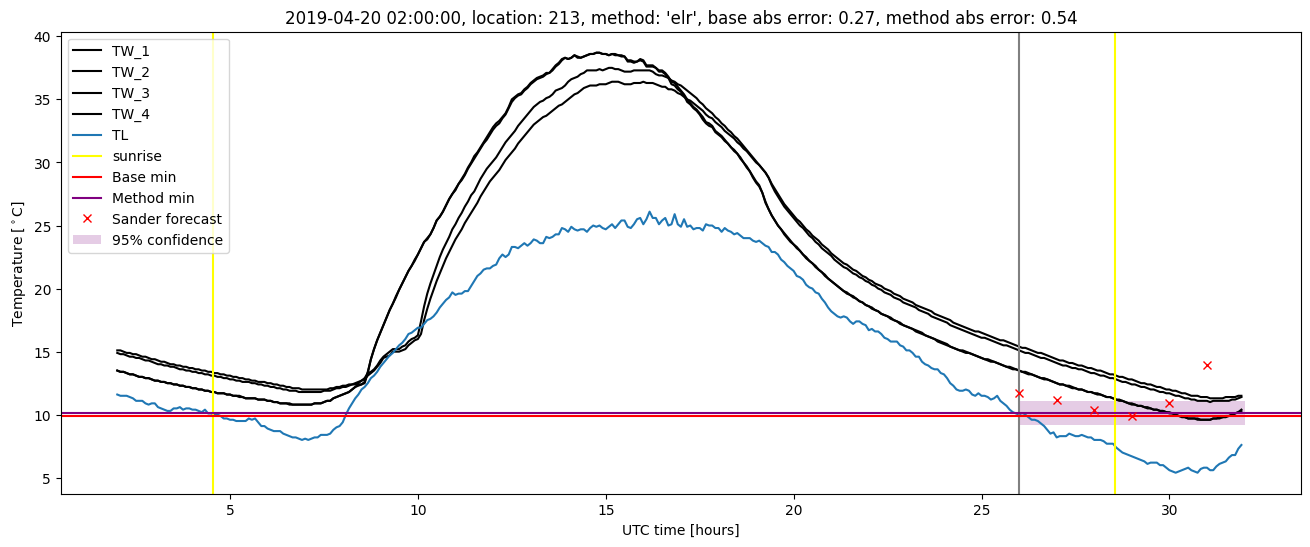
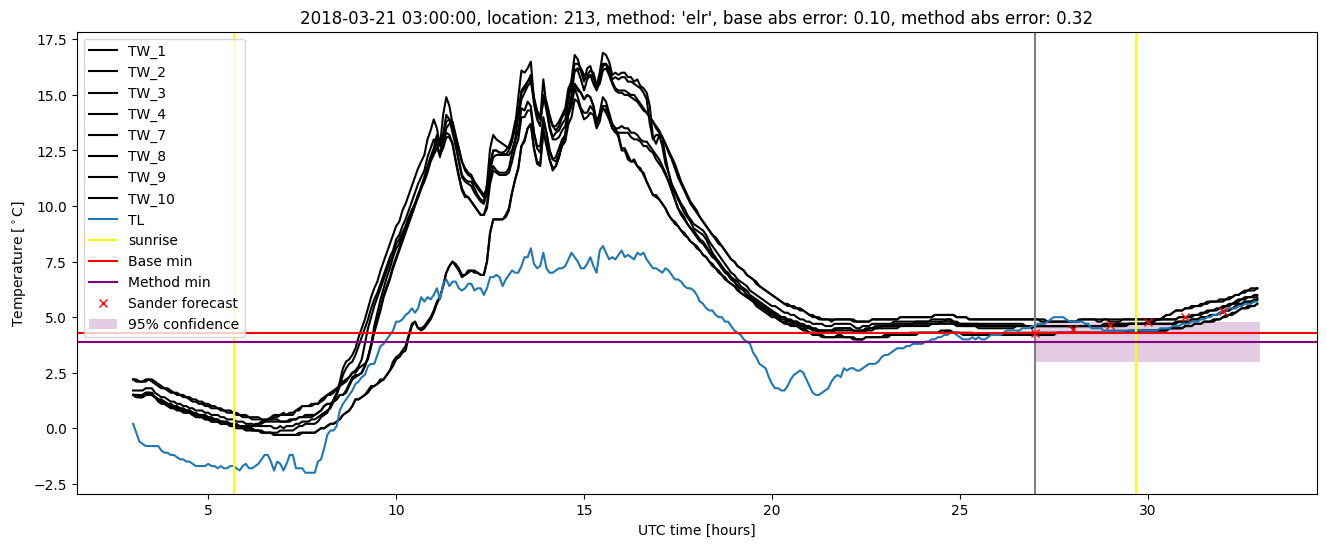
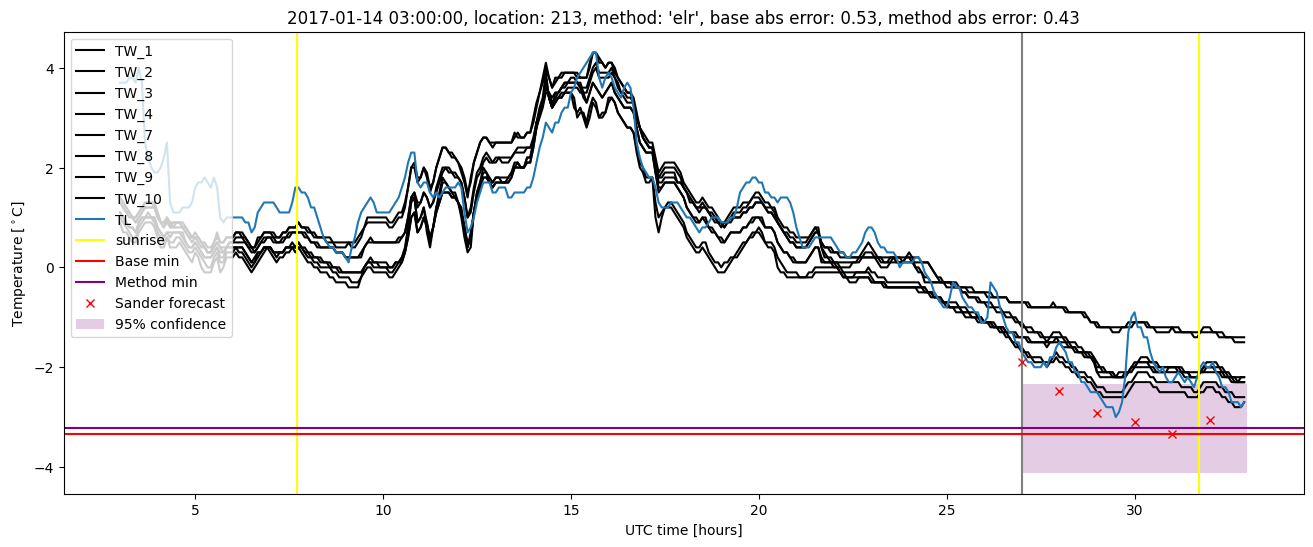
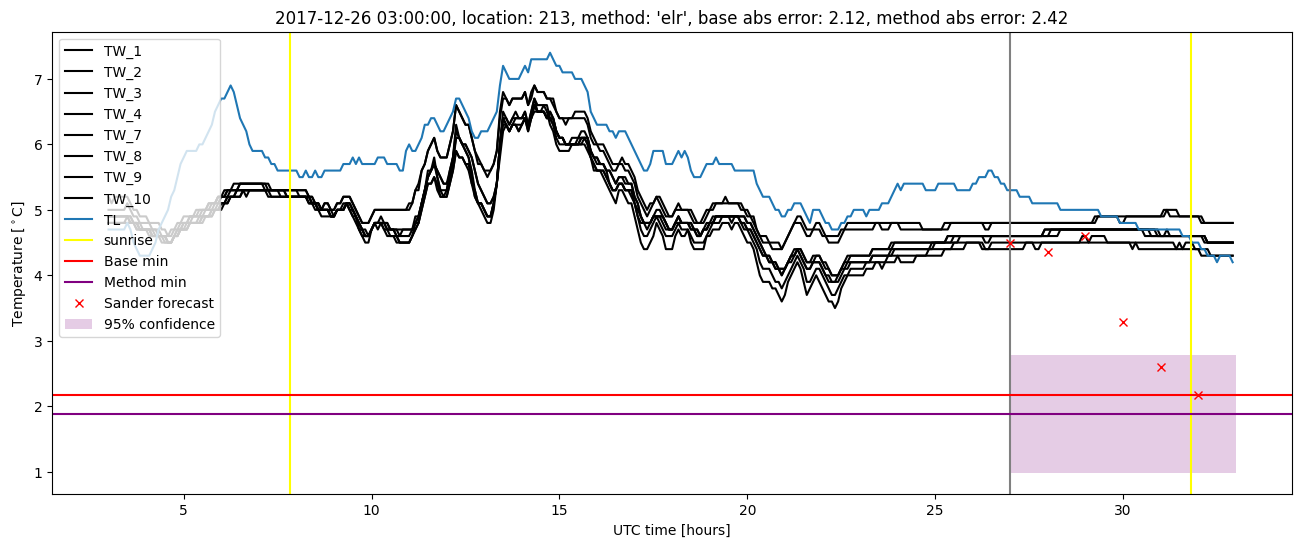
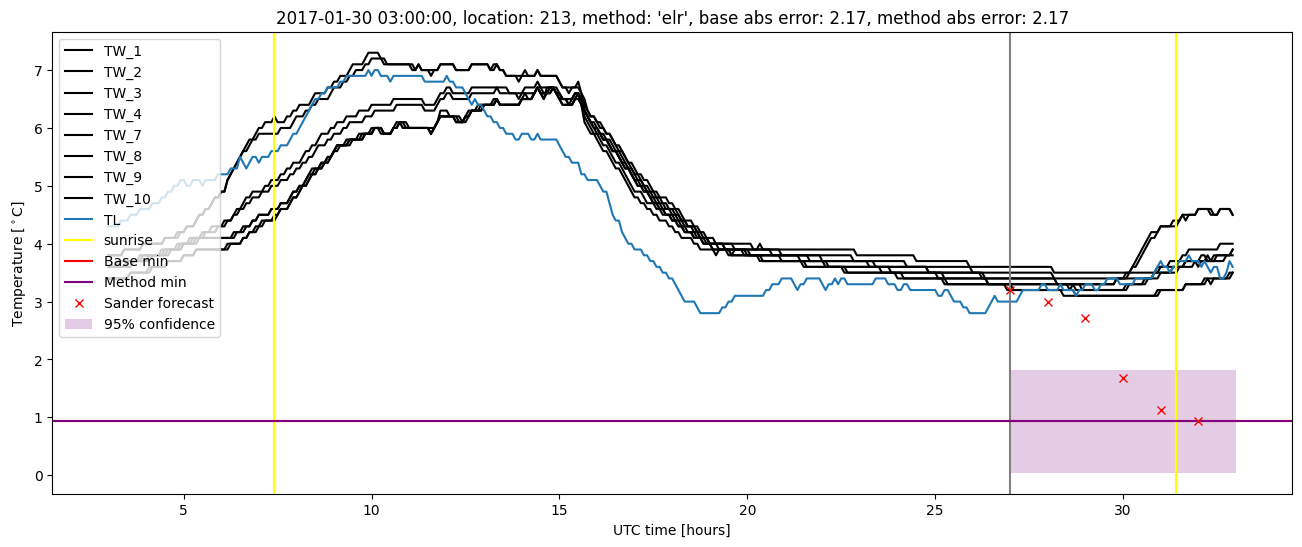
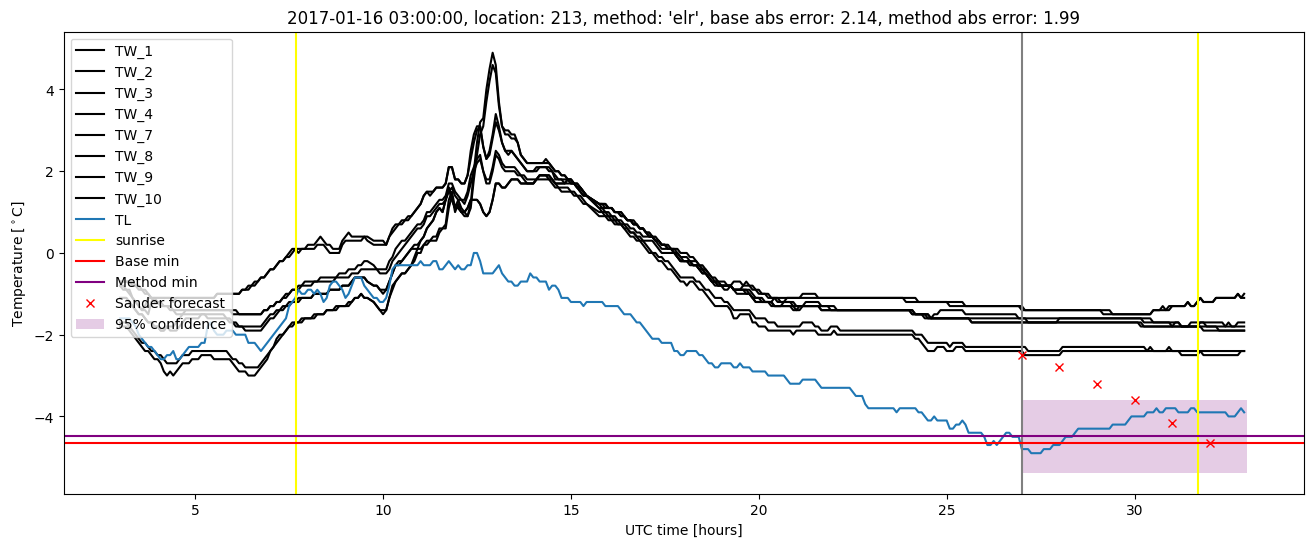
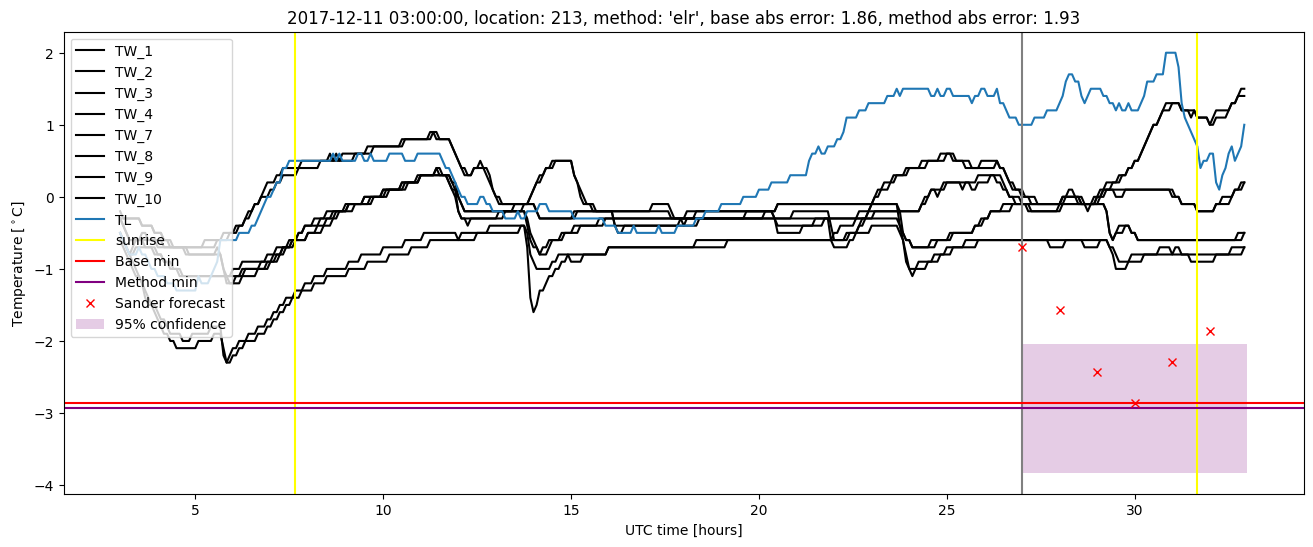
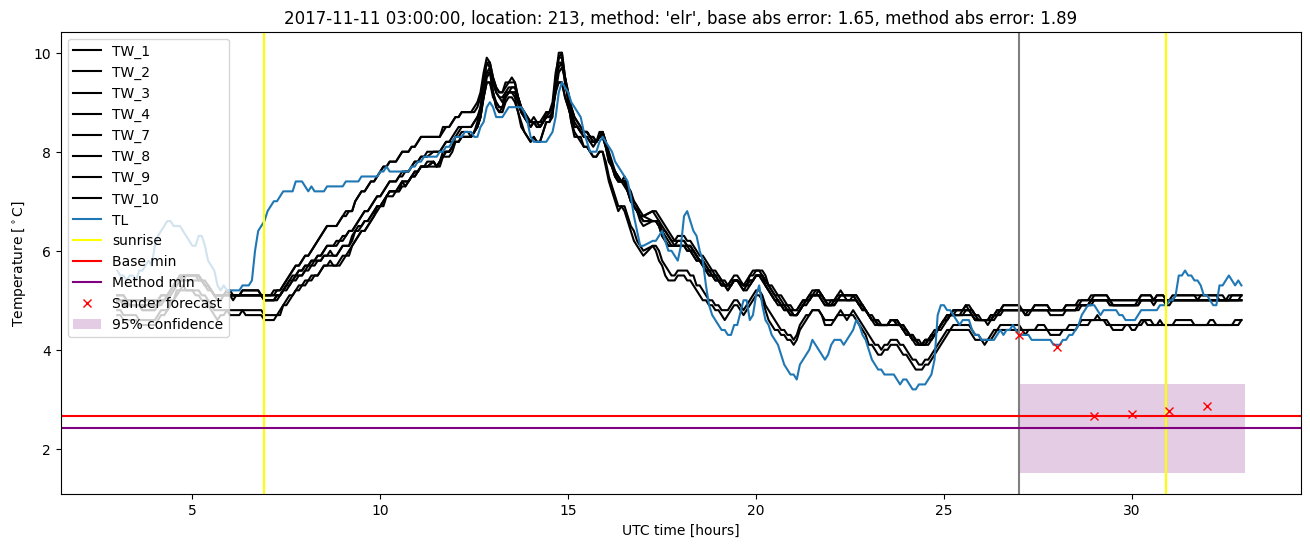
Extended logistic regression plots