GMS location: 212
Random forest results
| names |
period |
power |
significance |
meanSquareError |
absError |
maxError |
CRPS |
IGN |
| baseline |
winter 2016 |
0.977 |
0.107 |
0.832 |
0.598 |
4.828 |
NaN |
NaN |
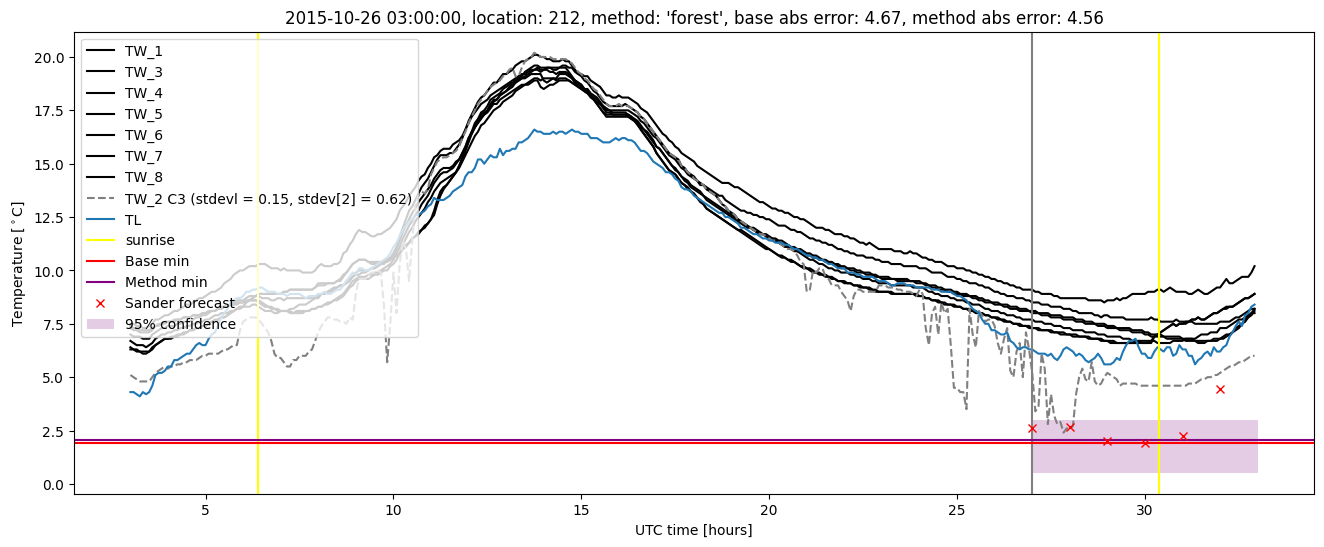
| forest |
winter 2016 |
0.966 |
0.036 |
0.819 |
0.600 |
4.698 |
0.503 |
1.369 |
| baseline |
winter 2017 |
0.990 |
0.106 |
0.828 |
0.616 |
4.296 |
NaN |
NaN |
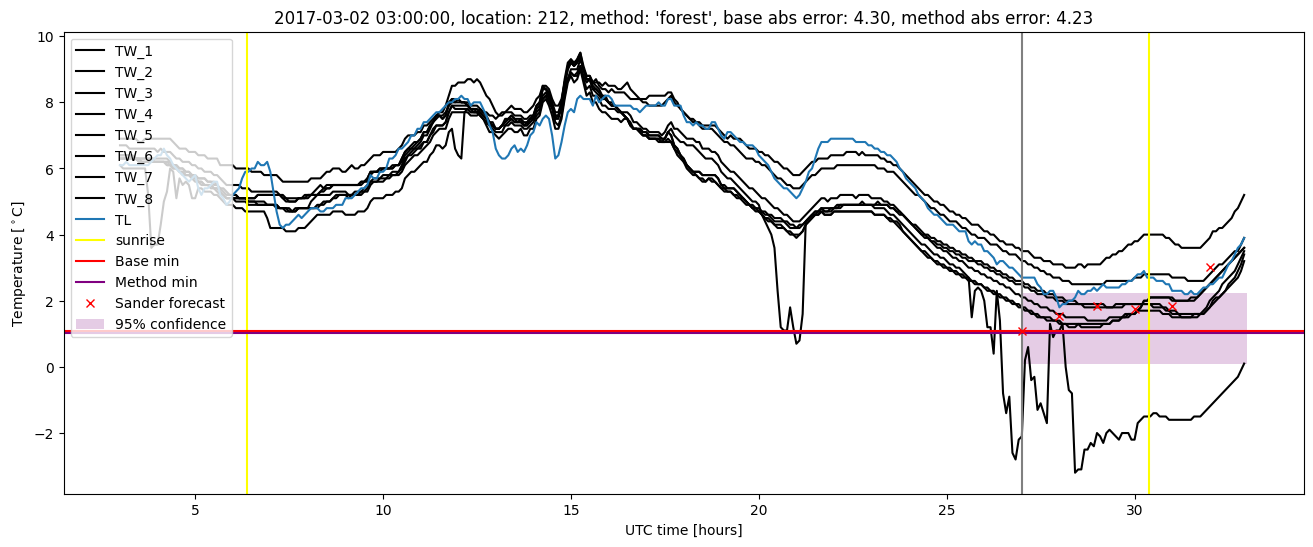
| forest |
winter 2017 |
0.980 |
0.085 |
0.814 |
0.606 |
4.228 |
0.480 |
1.331 |
| baseline |
winter 2018 |
0.993 |
0.100 |
1.377 |
0.790 |
4.600 |
NaN |
NaN |
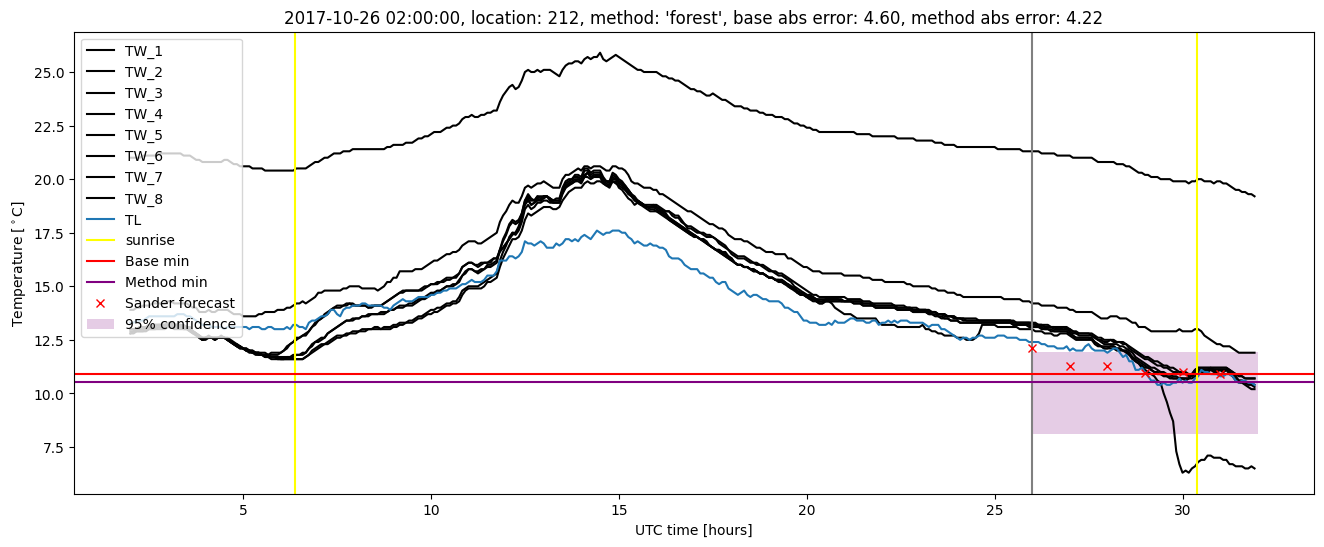
| forest |
winter 2018 |
0.978 |
0.150 |
1.321 |
0.751 |
4.222 |
0.497 |
1.400 |
| baseline |
winter 2019 |
0.972 |
0.000e+00 |
0.271 |
0.382 |
1.856 |
NaN |
NaN |
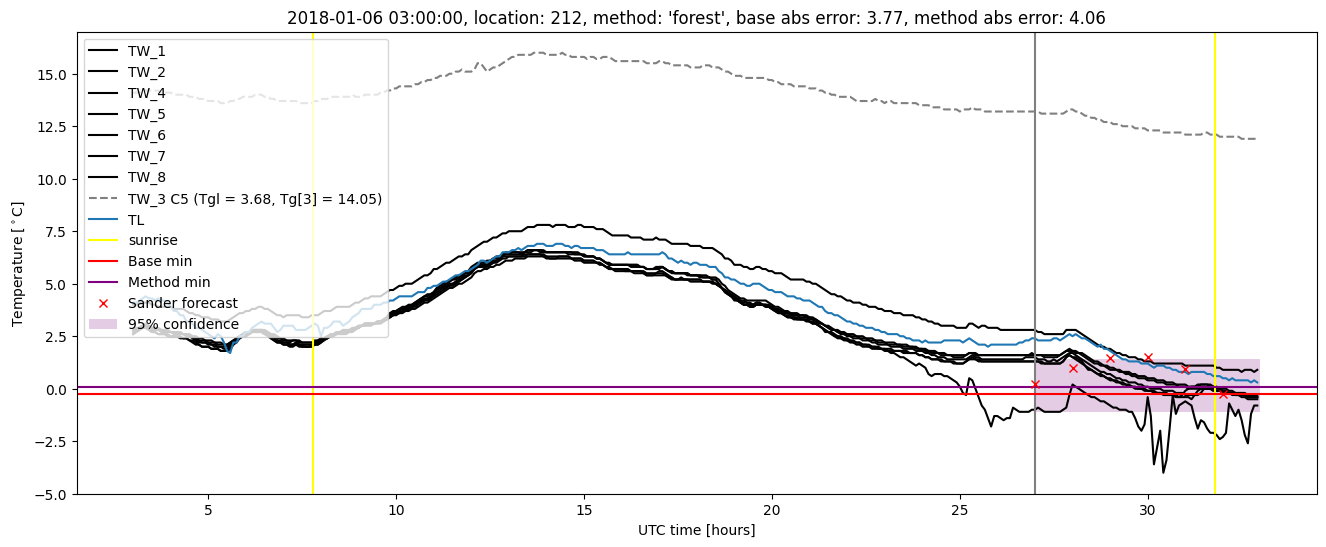
| forest |
winter 2019 |
0.972 |
0.000e+00 |
0.310 |
0.402 |
2.135 |
0.540 |
1.409 |
| baseline |
all |
0.982 |
0.094 |
0.843 |
0.601 |
4.828 |
NaN |
NaN |
| forest |
all |
0.973 |
0.086 |
0.830 |
0.595 |
4.698 |
0.505 |
1.378 |
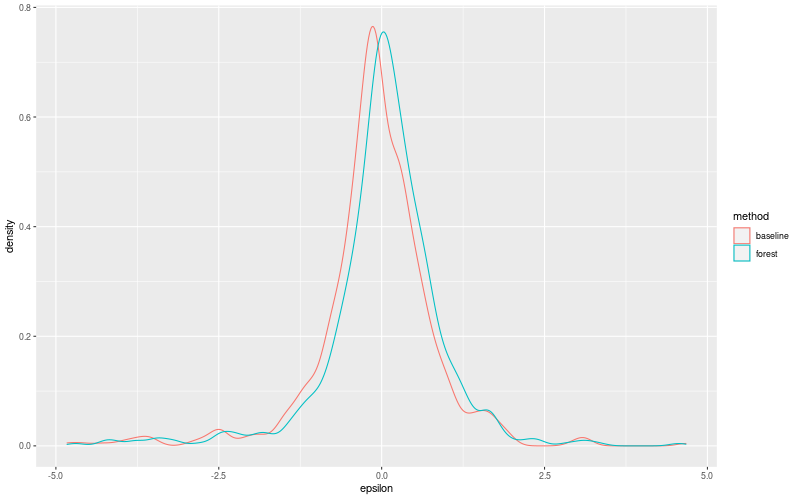
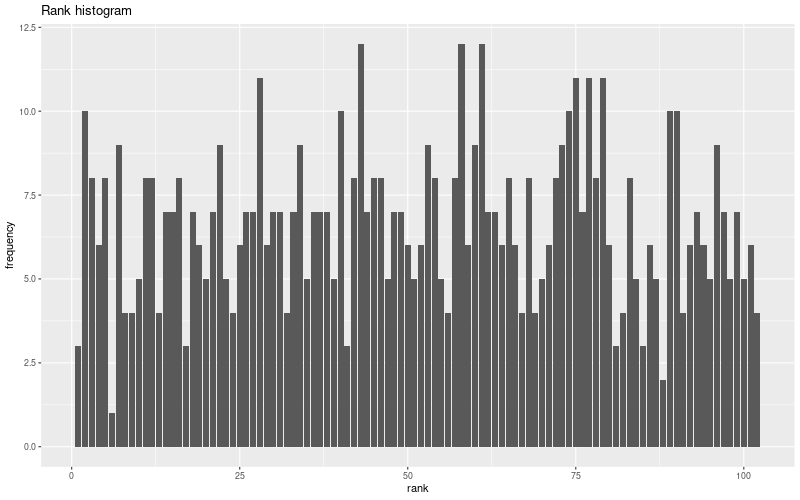
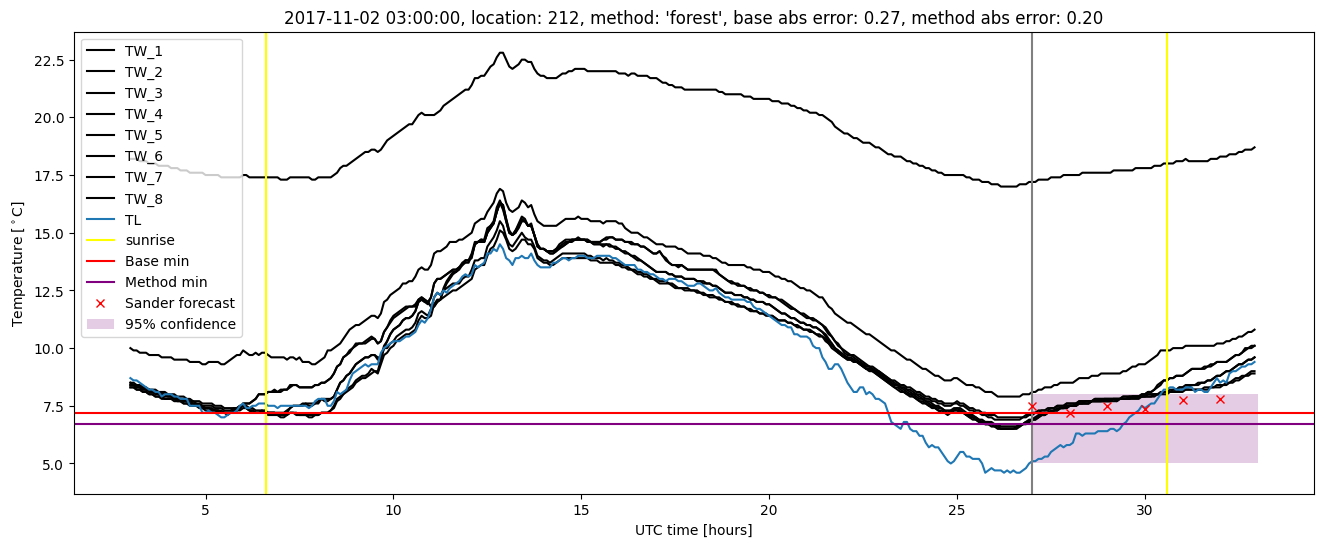
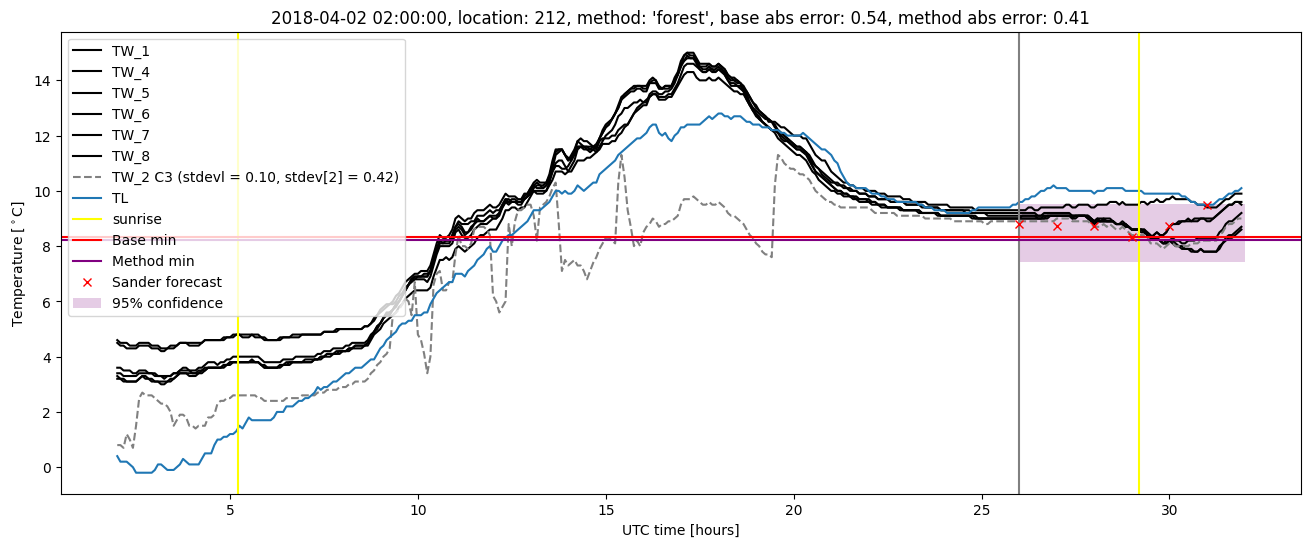
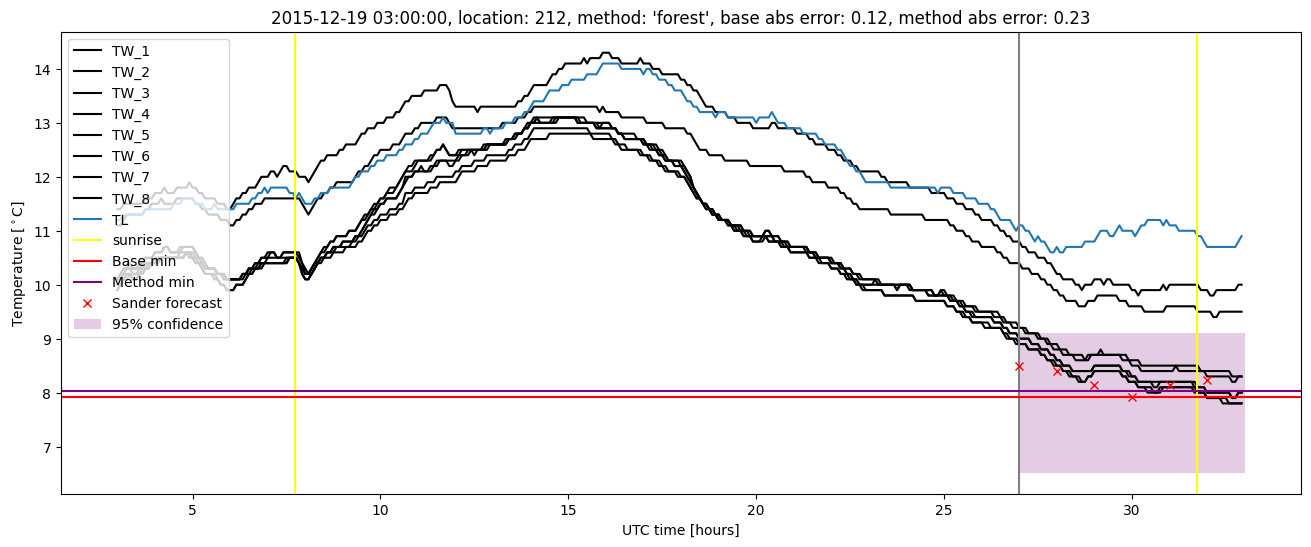
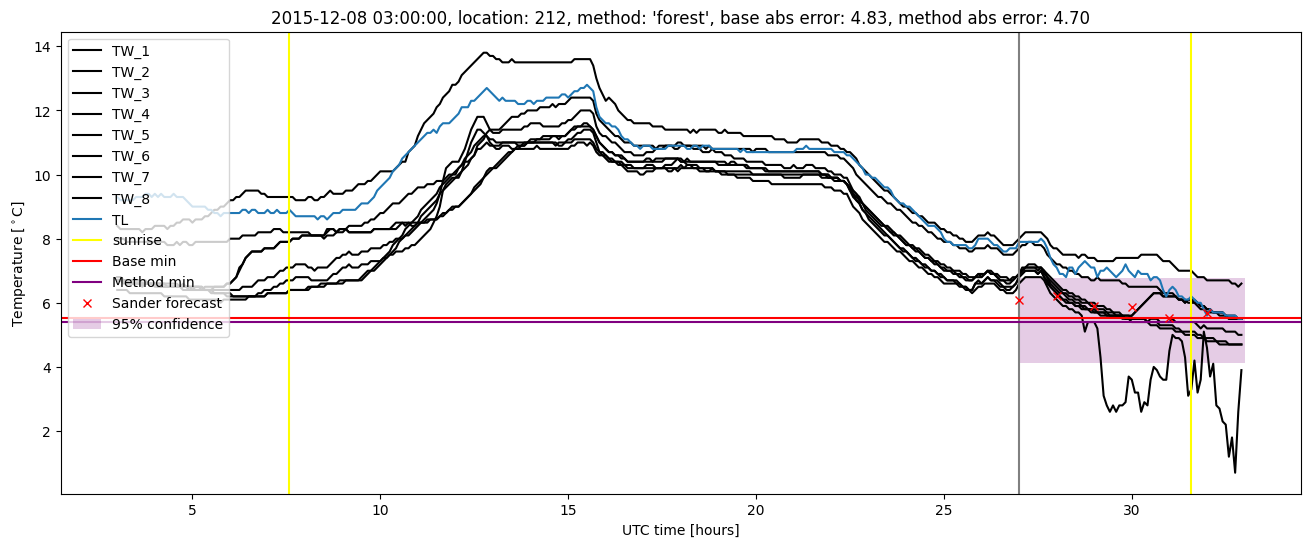
Random forest plots
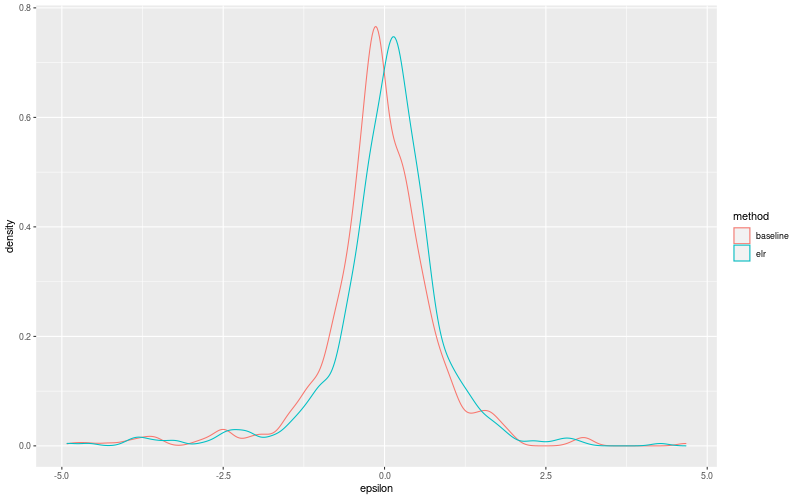
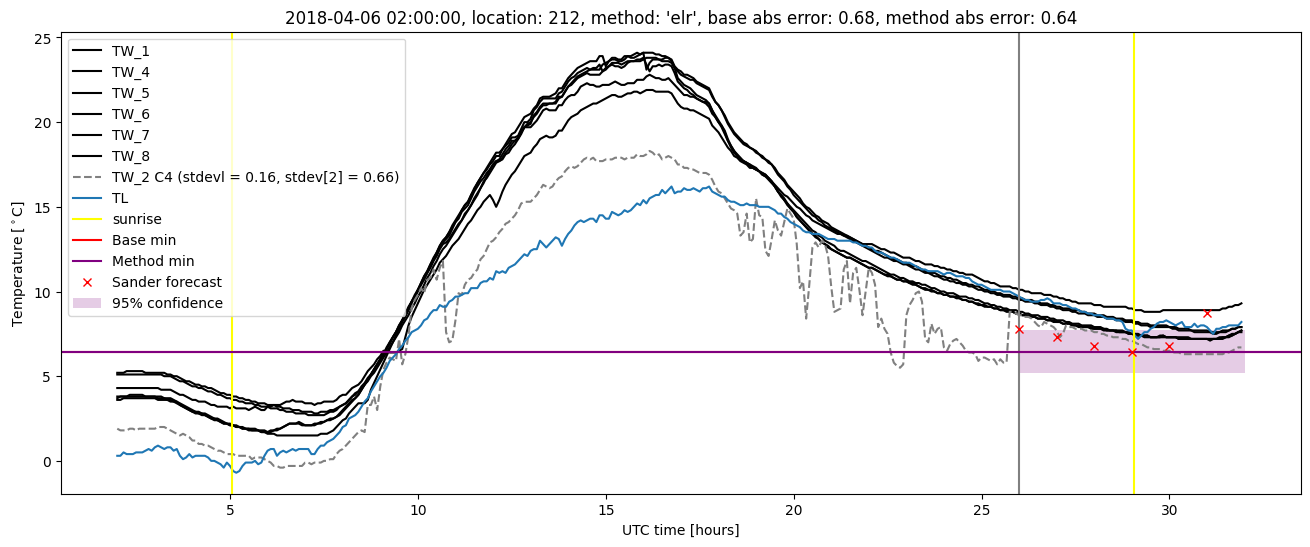
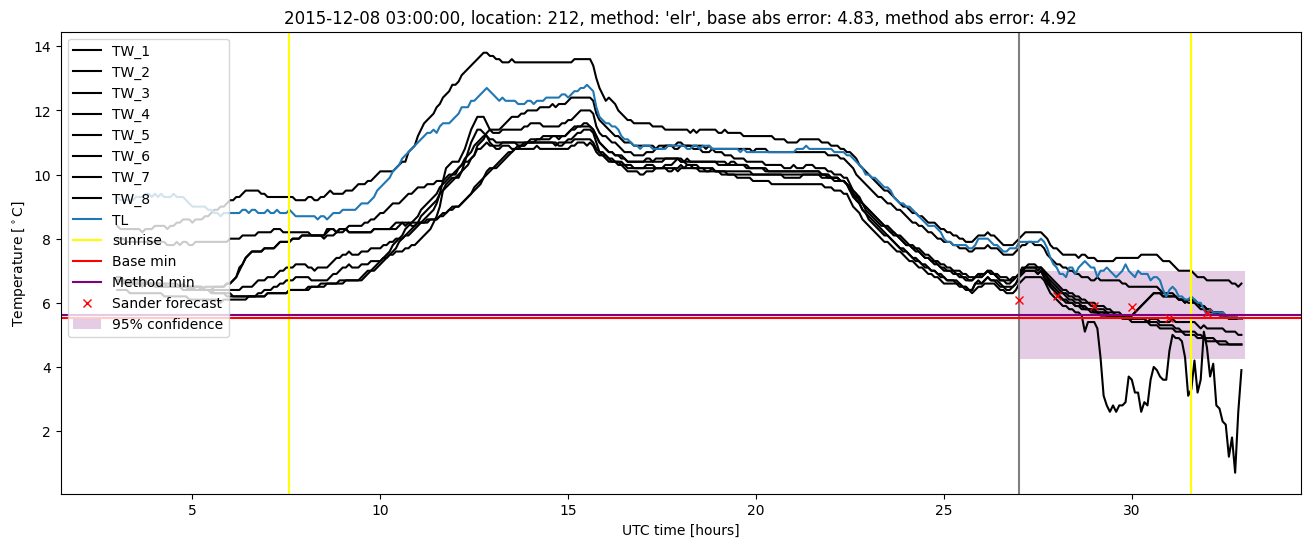
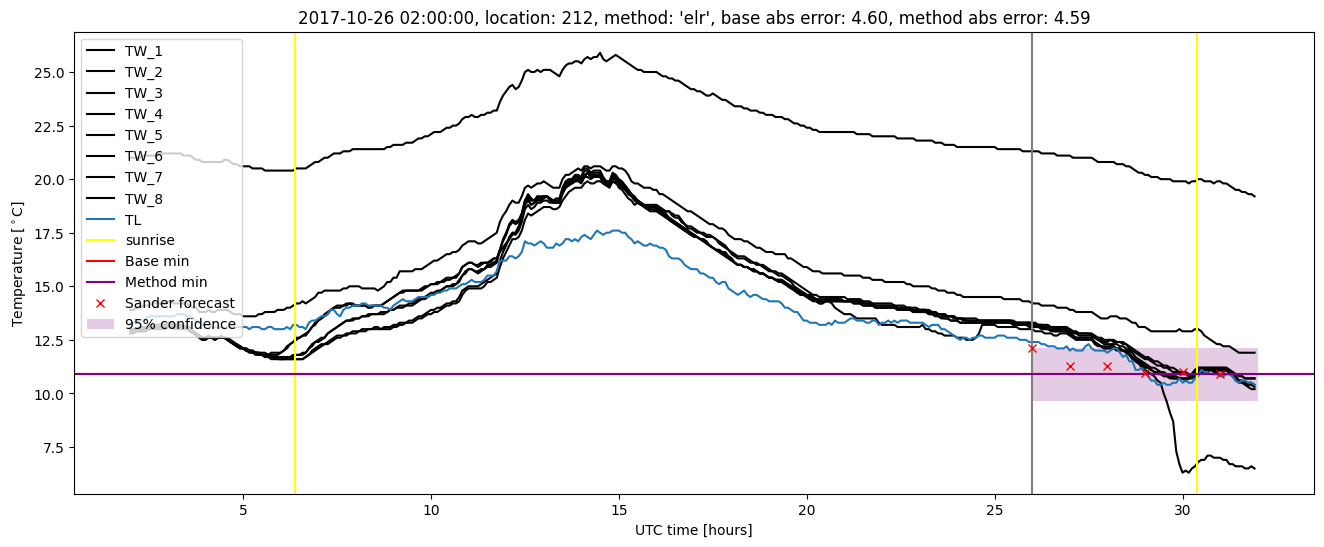
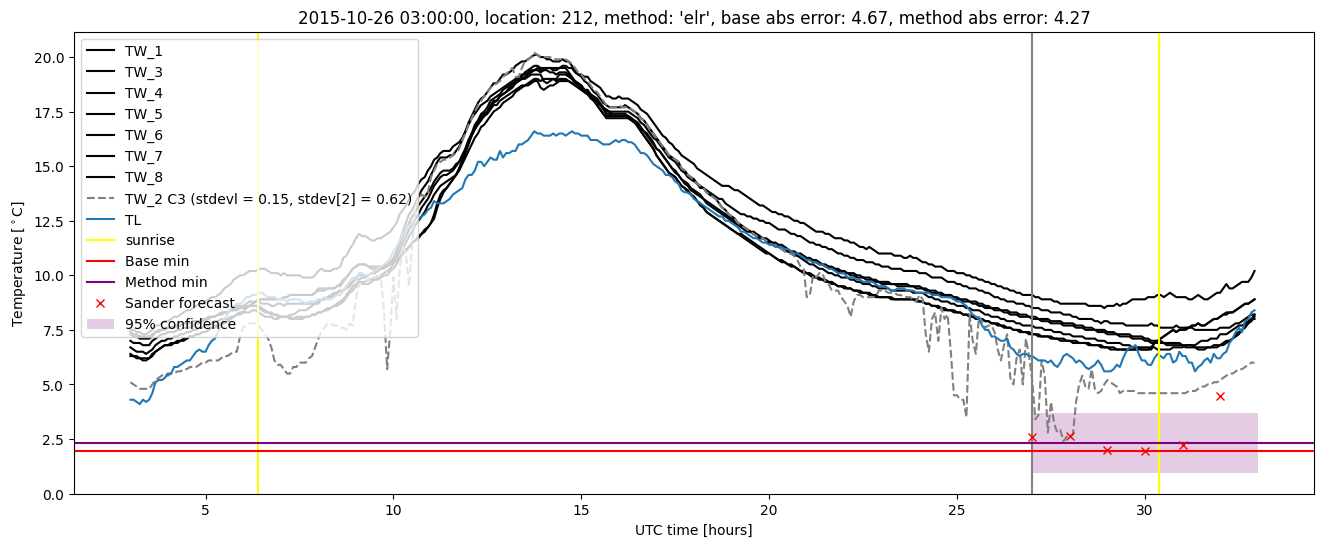
Extended logistic regression results
| names |
period |
power |
significance |
meanSquareError |
absError |
maxError |
CRPS |
IGN |
| baseline |
winter 2016 |
0.977 |
0.107 |
0.832 |
0.598 |
4.828 |
NaN |
NaN |
| elr |
winter 2016 |
0.966 |
0.036 |
0.833 |
0.591 |
4.919 |
0.548 |
1.499 |
| baseline |
winter 2017 |
0.990 |
0.106 |
0.828 |
0.616 |
4.296 |
NaN |
NaN |
| elr |
winter 2017 |
0.990 |
0.128 |
0.764 |
0.581 |
3.886 |
0.462 |
1.225 |
| baseline |
winter 2018 |
0.993 |
0.100 |
1.377 |
0.790 |
4.600 |
NaN |
NaN |
| elr |
winter 2018 |
0.978 |
0.125 |
1.235 |
0.740 |
4.585 |
0.531 |
1.635 |
| baseline |
winter 2019 |
0.972 |
0.000e+00 |
0.271 |
0.382 |
1.856 |
NaN |
NaN |
| elr |
winter 2019 |
0.972 |
0.000e+00 |
0.329 |
0.435 |
1.879 |
0.539 |
1.364 |
| baseline |
all |
0.982 |
0.094 |
0.843 |
0.601 |
4.828 |
NaN |
NaN |
| elr |
all |
0.975 |
0.094 |
0.806 |
0.591 |
4.919 |
0.523 |
1.444 |
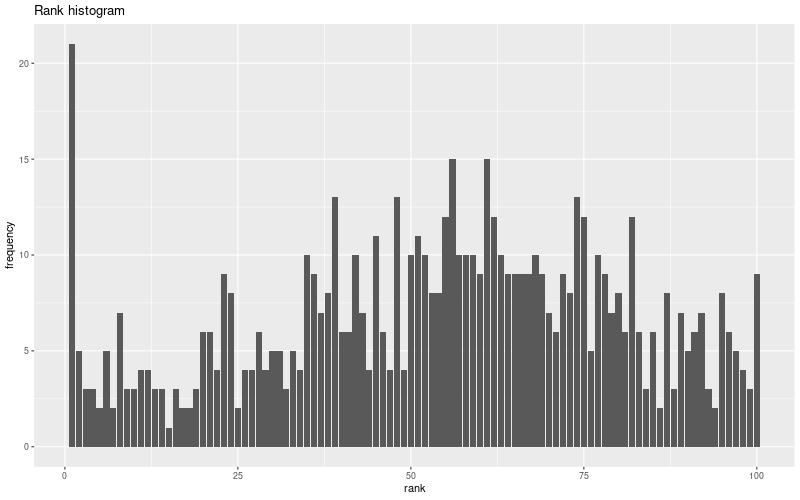
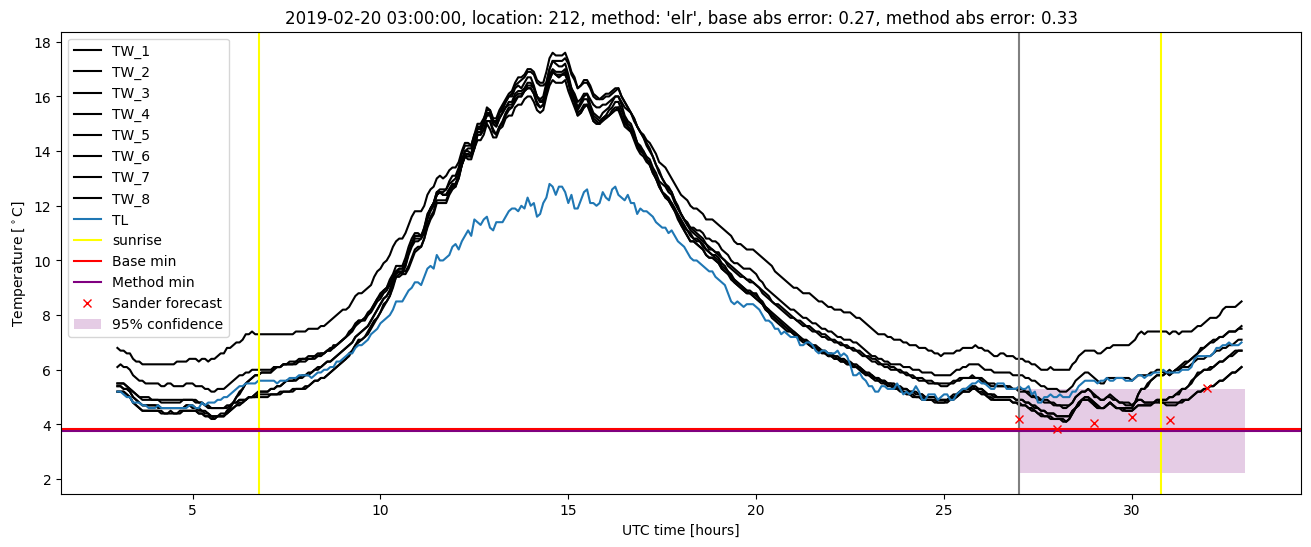
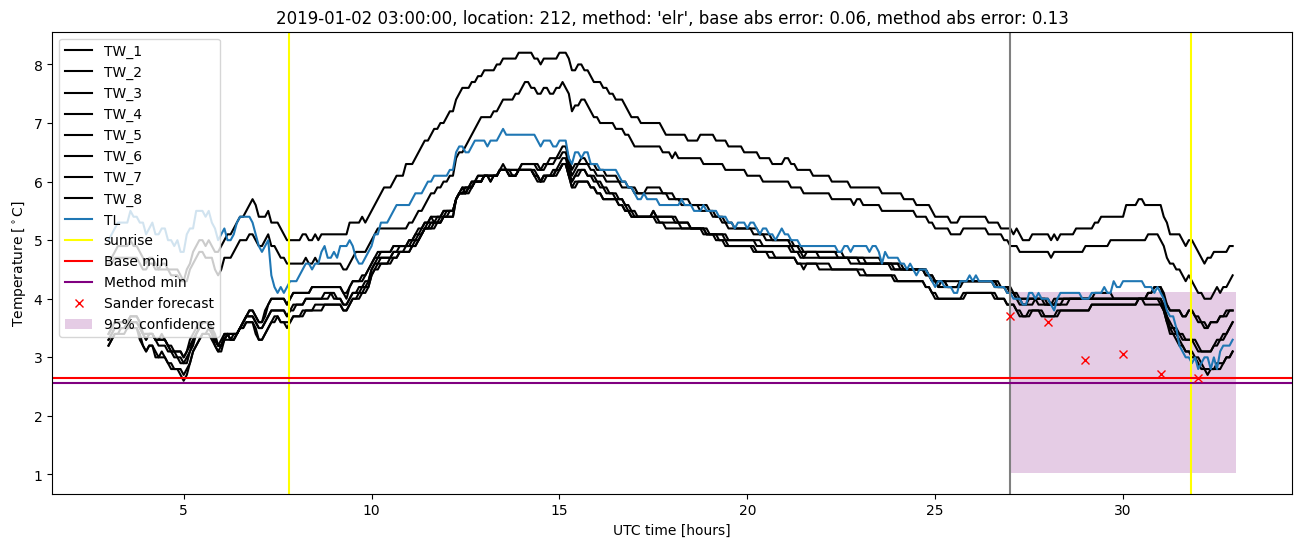
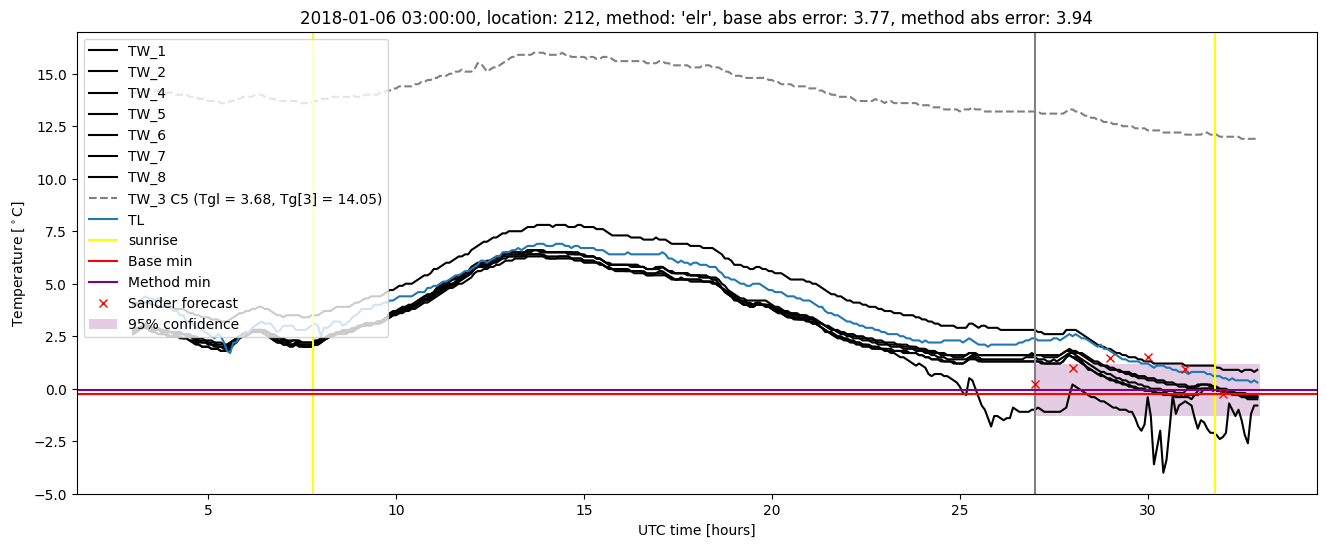
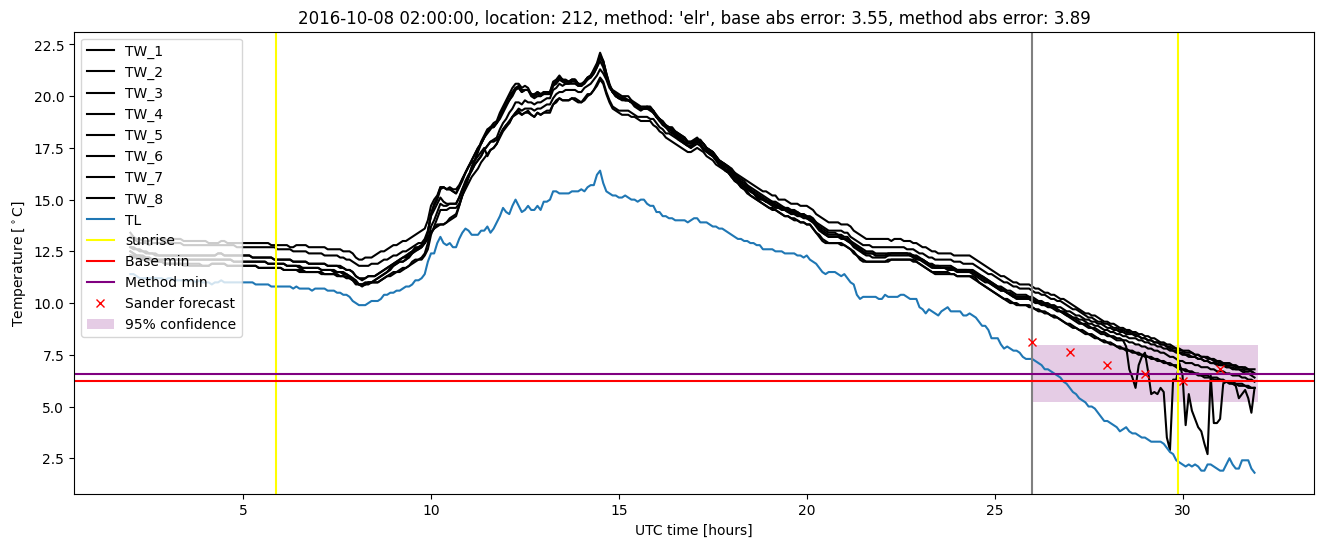
Extended logistic regression plots