GMS location: 211
Random forest results
| names |
period |
power |
significance |
meanSquareError |
absError |
maxError |
CRPS |
IGN |
| baseline |
winter 2016 |
0.977 |
0.185 |
0.329 |
0.426 |
1.988 |
NaN |
NaN |
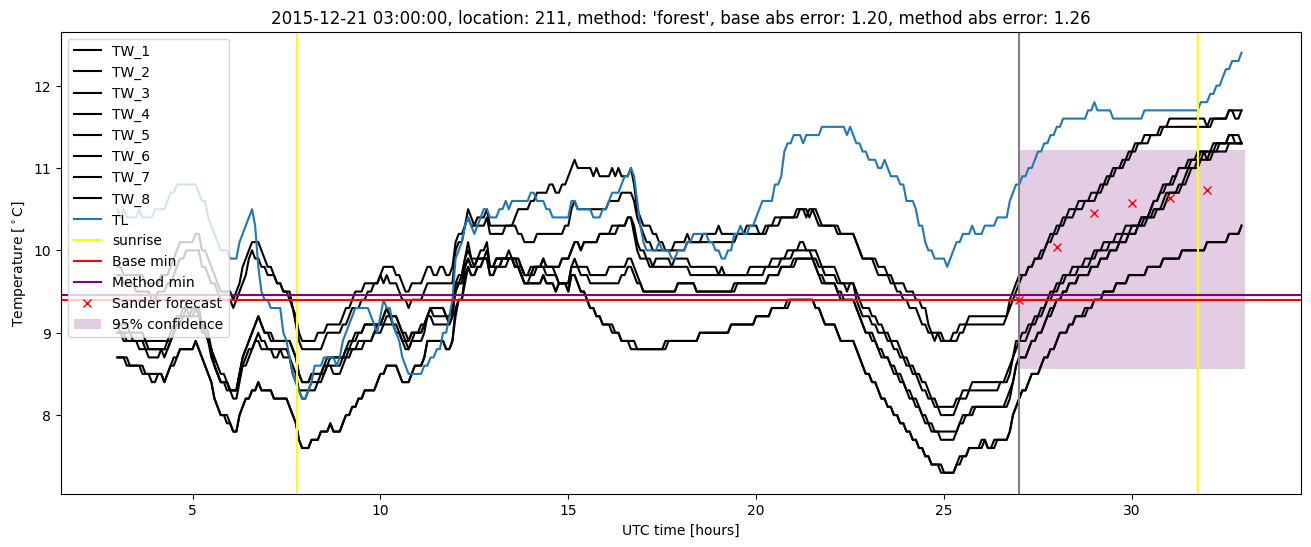
| forest |
winter 2016 |
0.977 |
0.074 |
0.360 |
0.438 |
3.033 |
0.520 |
1.490 |
| baseline |
winter 2017 |
0.964 |
0.024 |
0.443 |
0.481 |
2.366 |
NaN |
NaN |
| forest |
winter 2017 |
0.964 |
0.024 |
0.396 |
0.462 |
1.907 |
0.477 |
1.392 |
| baseline |
winter 2018 |
0.986 |
0.098 |
1.186 |
0.745 |
5.898 |
NaN |
NaN |
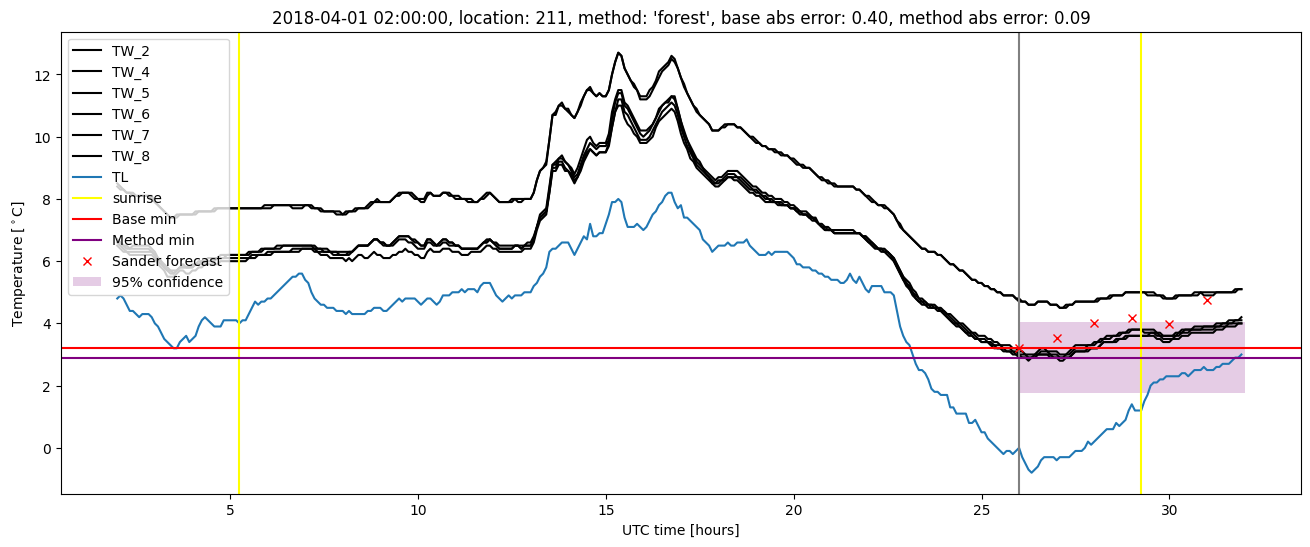
| forest |
winter 2018 |
0.971 |
0.098 |
1.151 |
0.721 |
5.717 |
0.528 |
1.984 |
| baseline |
winter 2019 |
0.973 |
0.200 |
1.492 |
0.671 |
6.787 |
NaN |
NaN |
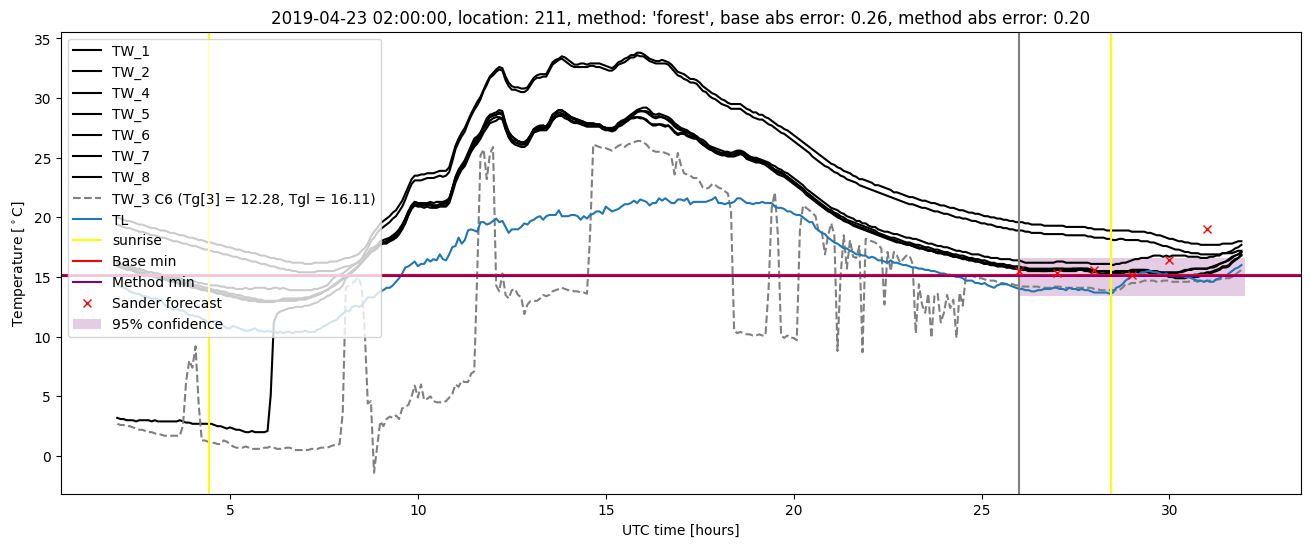
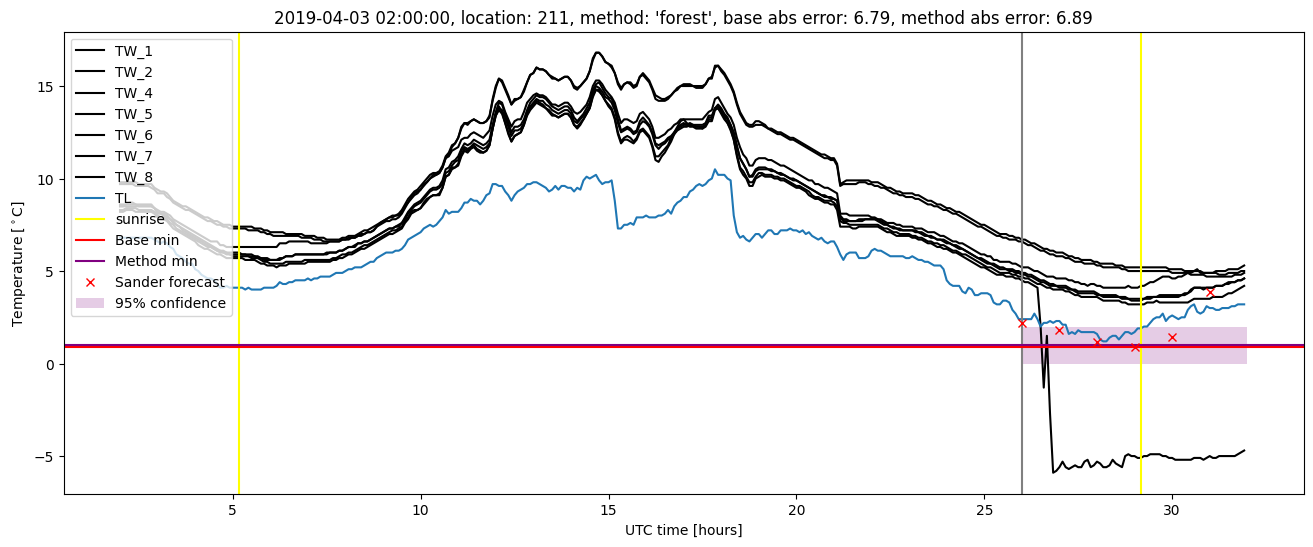
| forest |
winter 2019 |
0.980 |
0.200 |
1.410 |
0.645 |
6.893 |
0.453 |
1.392 |
| baseline |
all |
0.976 |
0.108 |
0.851 |
0.578 |
6.787 |
NaN |
NaN |
| forest |
all |
0.974 |
0.085 |
0.821 |
0.565 |
6.893 |
0.497 |
1.571 |
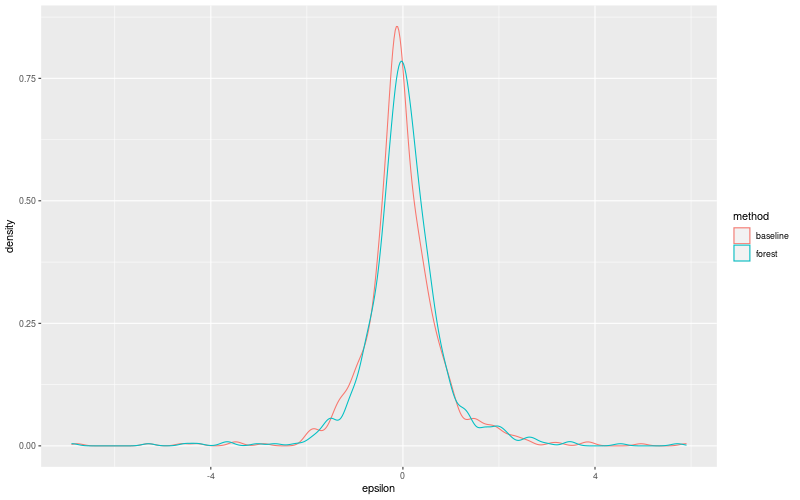
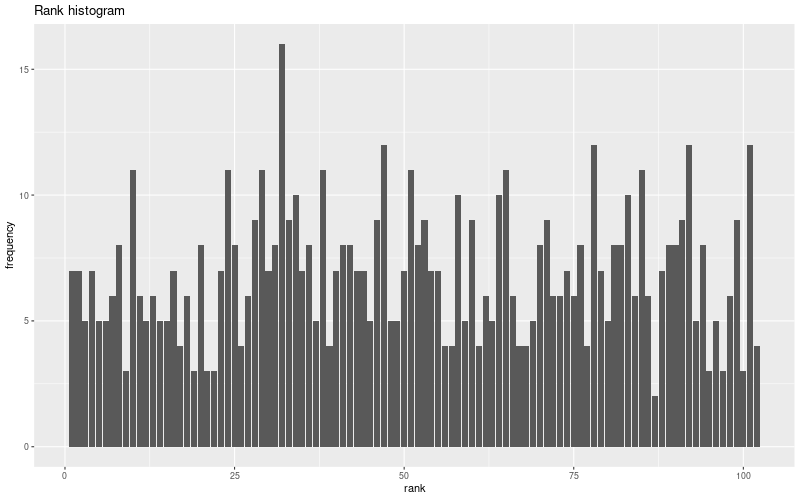
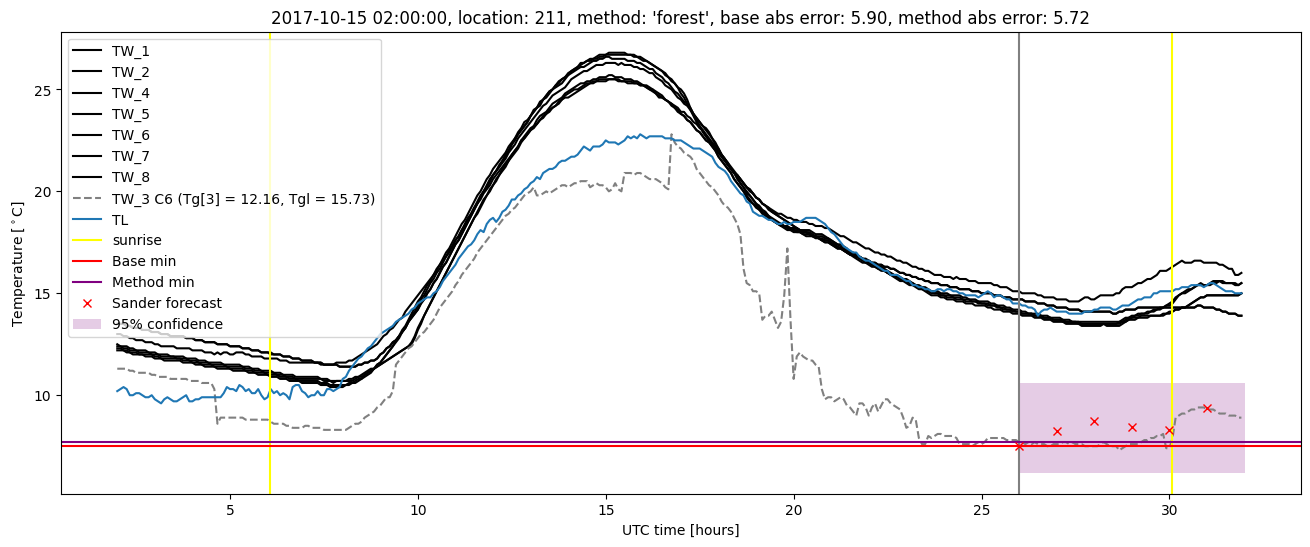
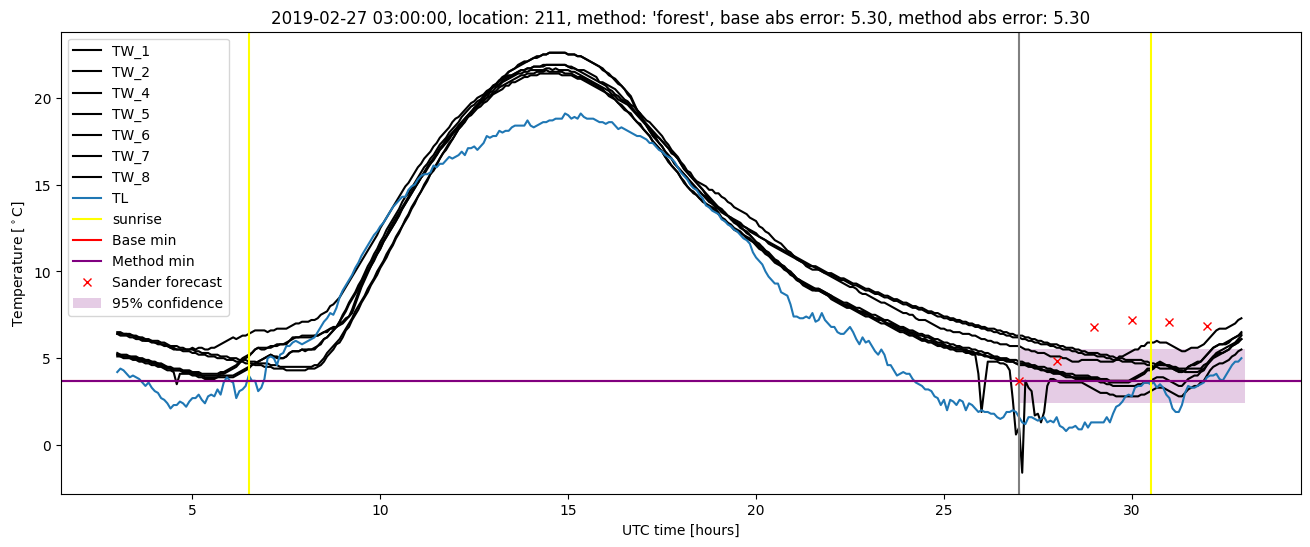
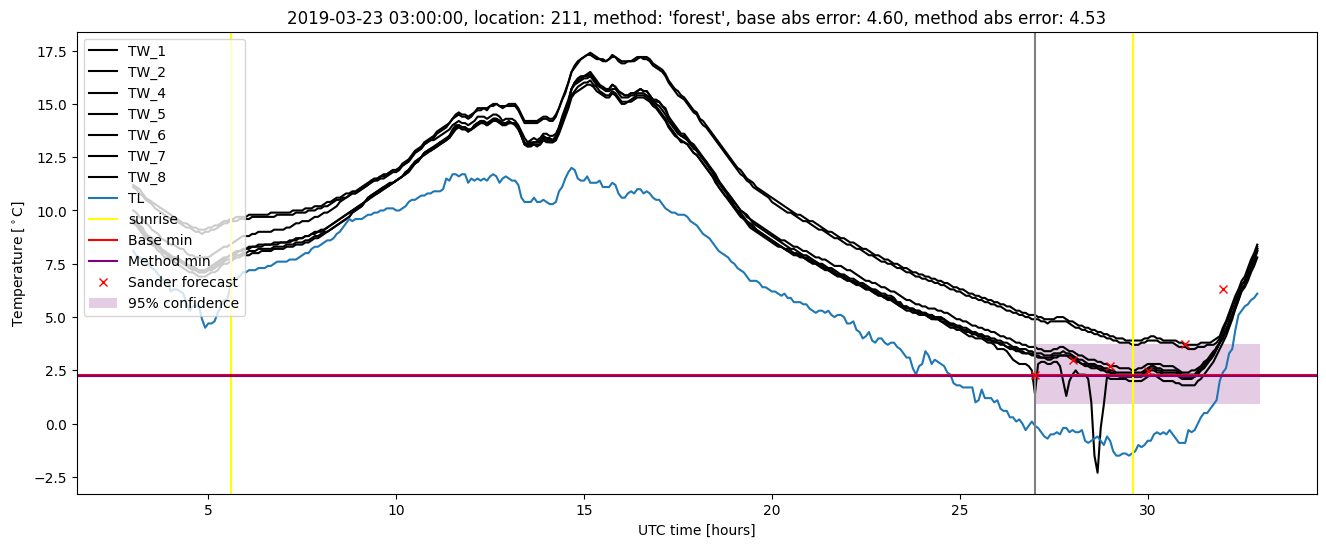
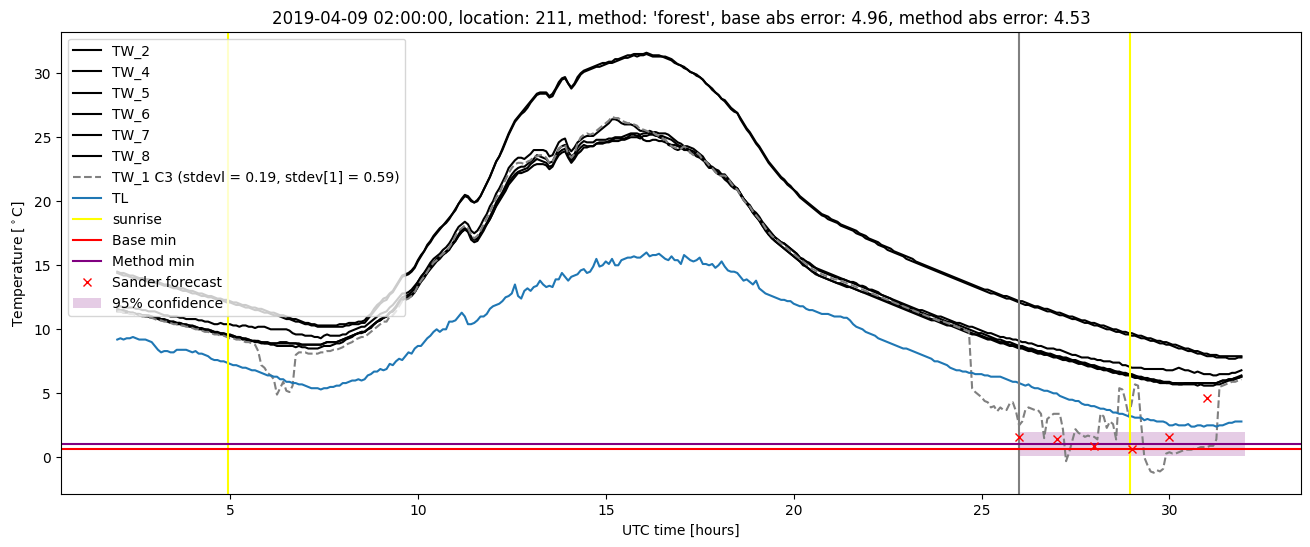
Random forest plots
Extended logistic regression results
| names |
period |
power |
significance |
meanSquareError |
absError |
maxError |
CRPS |
IGN |
| baseline |
winter 2016 |
0.977 |
0.185 |
0.329 |
0.426 |
1.988 |
NaN |
NaN |
| elr |
winter 2016 |
0.977 |
0.111 |
0.454 |
0.505 |
3.305 |
0.501 |
1.285 |
| baseline |
winter 2017 |
0.964 |
0.024 |
0.443 |
0.481 |
2.366 |
NaN |
NaN |
| elr |
winter 2017 |
0.973 |
0.122 |
0.423 |
0.491 |
1.958 |
0.455 |
1.189 |
| baseline |
winter 2018 |
0.986 |
0.098 |
1.186 |
0.745 |
5.898 |
NaN |
NaN |
| elr |
winter 2018 |
0.957 |
0.073 |
1.311 |
0.763 |
5.732 |
0.528 |
1.544 |
| baseline |
winter 2019 |
0.973 |
0.200 |
1.492 |
0.671 |
6.787 |
NaN |
NaN |
| elr |
winter 2019 |
0.973 |
0.200 |
1.594 |
0.686 |
7.245 |
0.467 |
1.464 |
| baseline |
all |
0.976 |
0.108 |
0.851 |
0.578 |
6.787 |
NaN |
NaN |
| elr |
all |
0.971 |
0.116 |
0.939 |
0.611 |
7.245 |
0.490 |
1.373 |
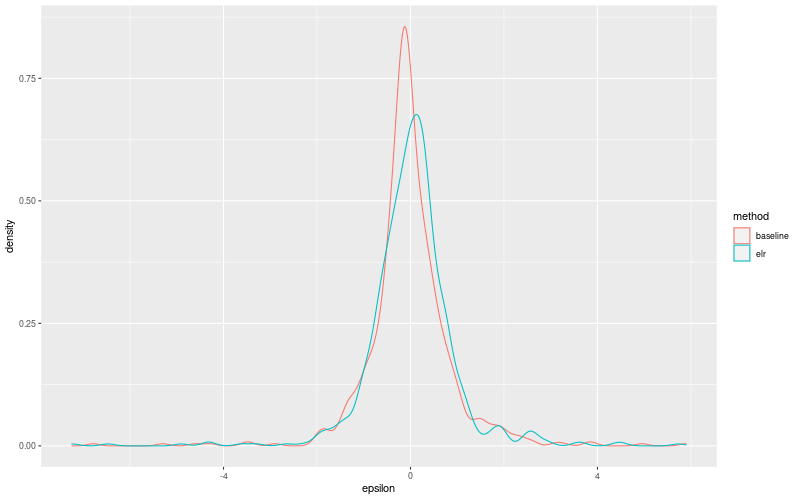
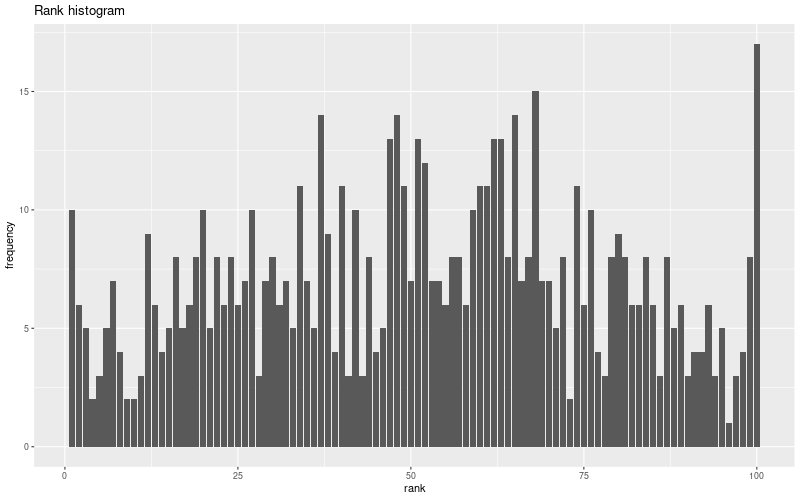
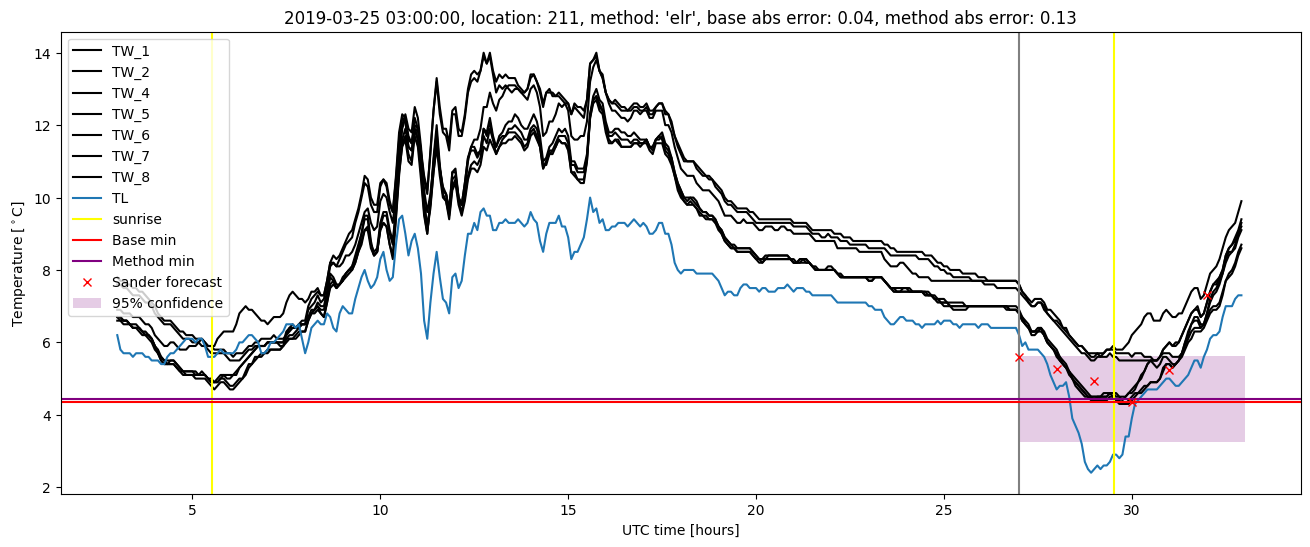
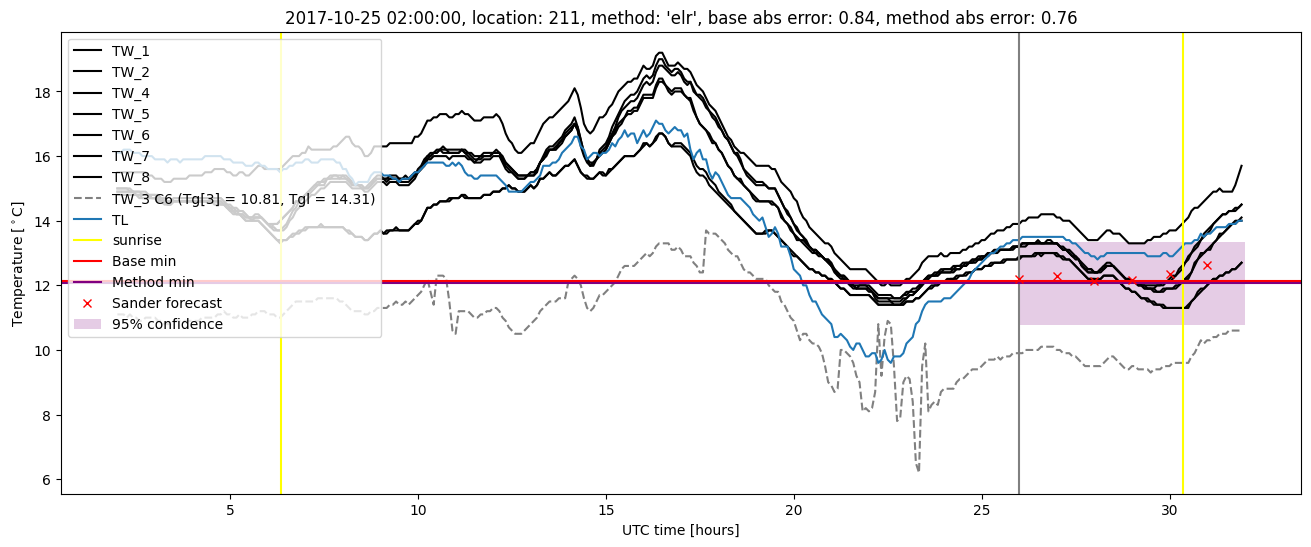
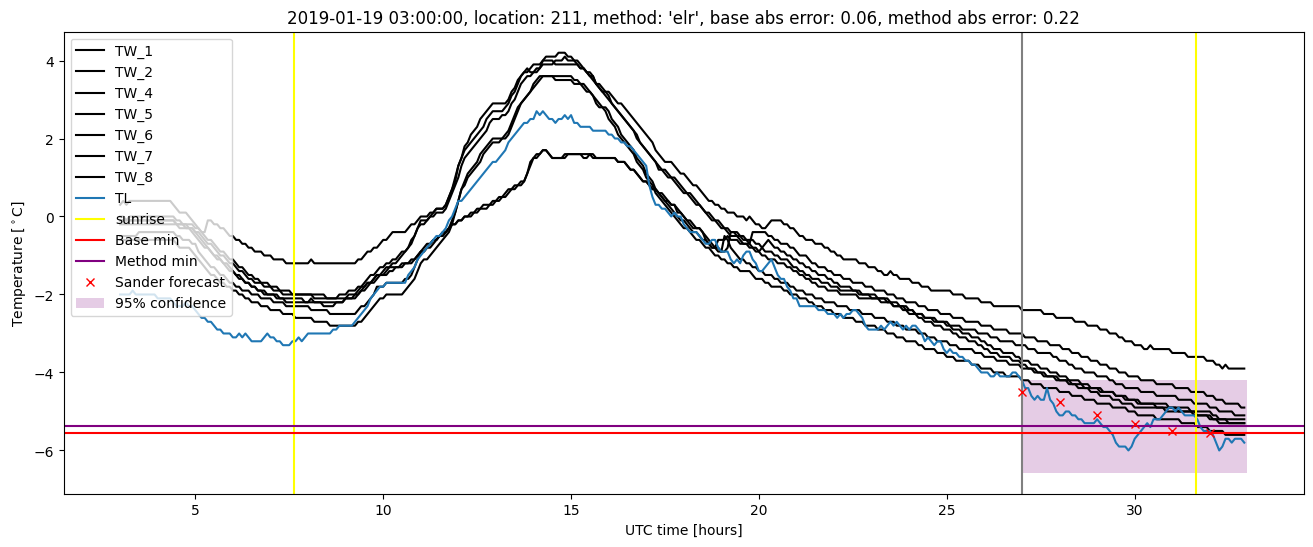
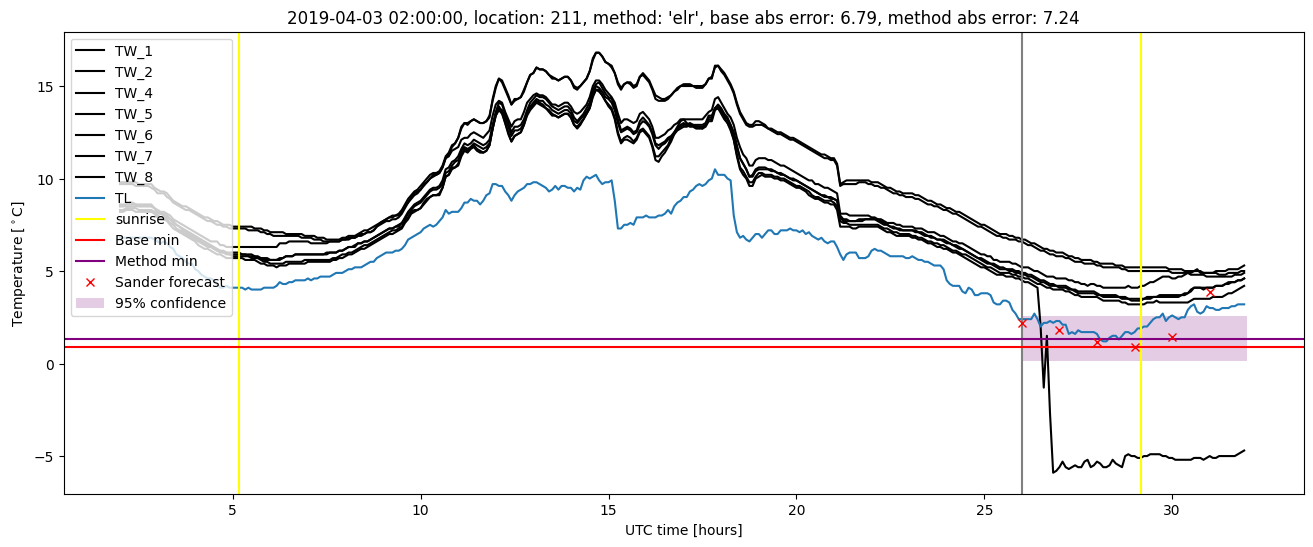
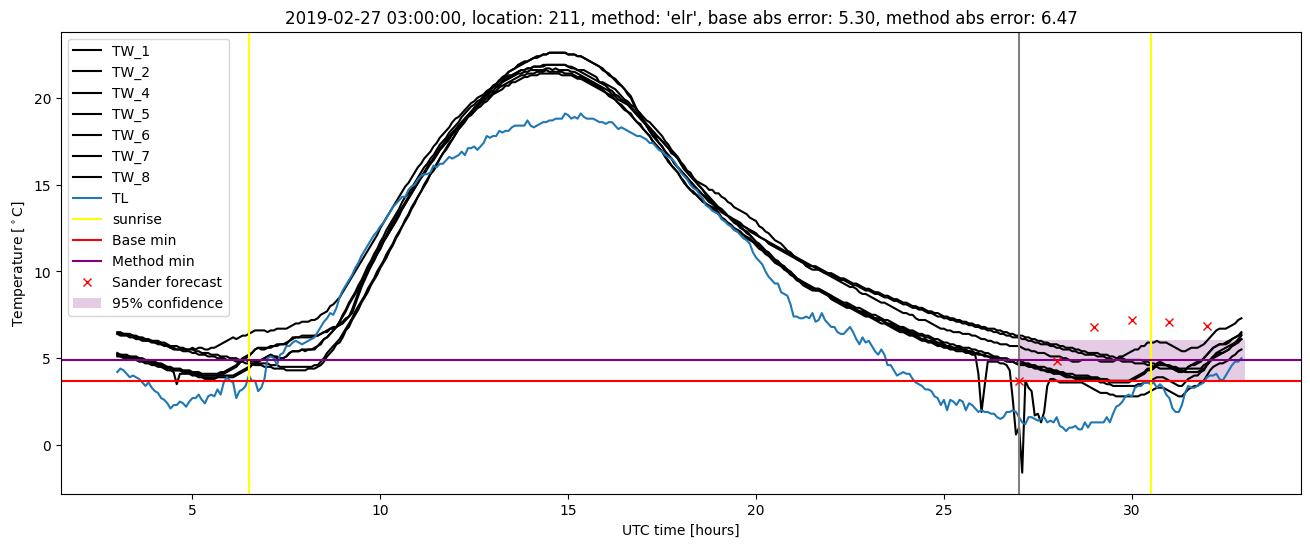
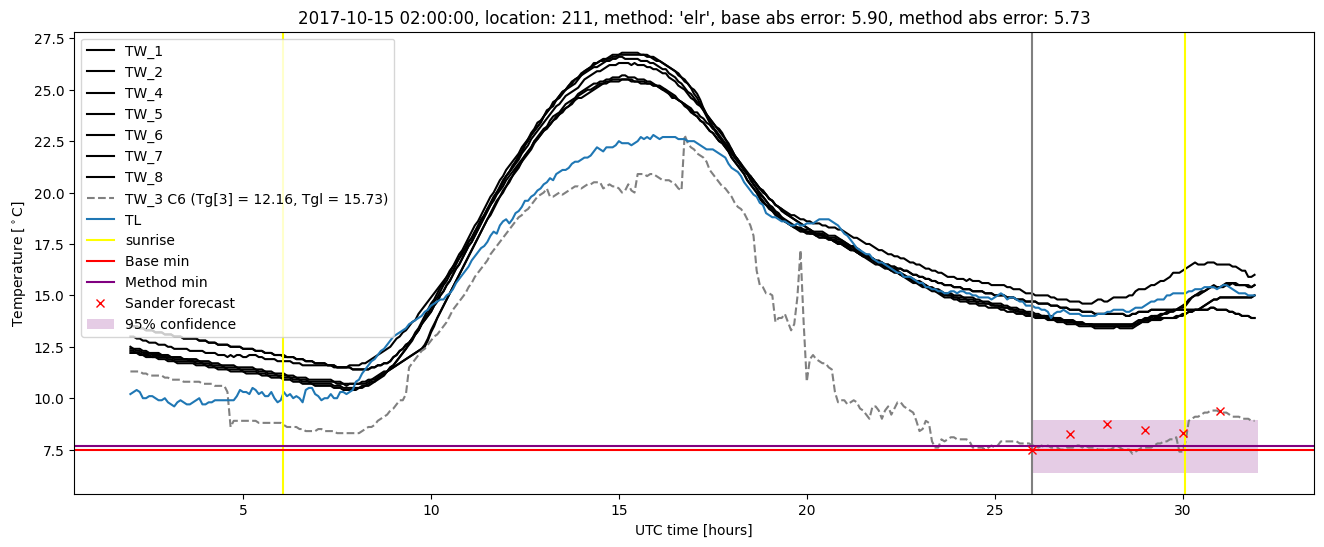
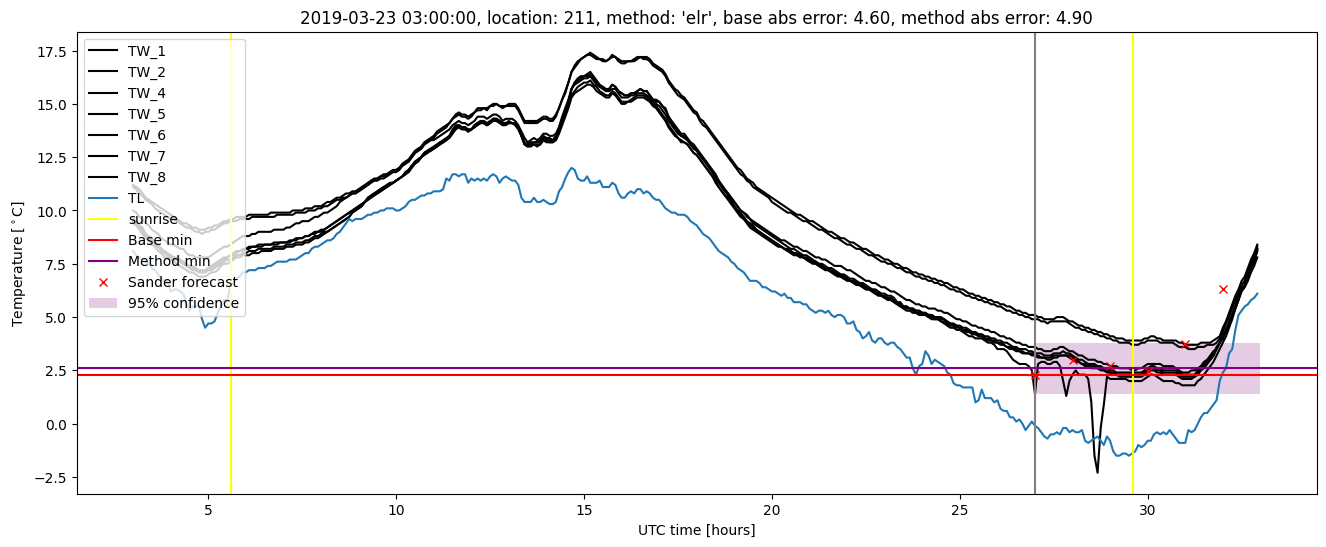
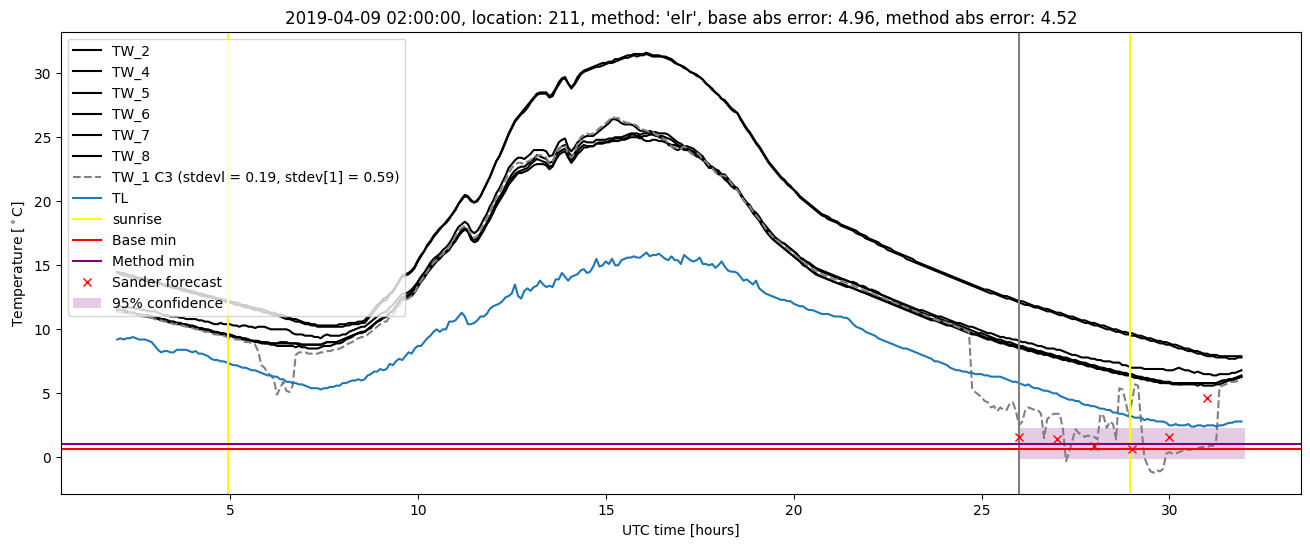
Extended logistic regression plots