GMS location: 210
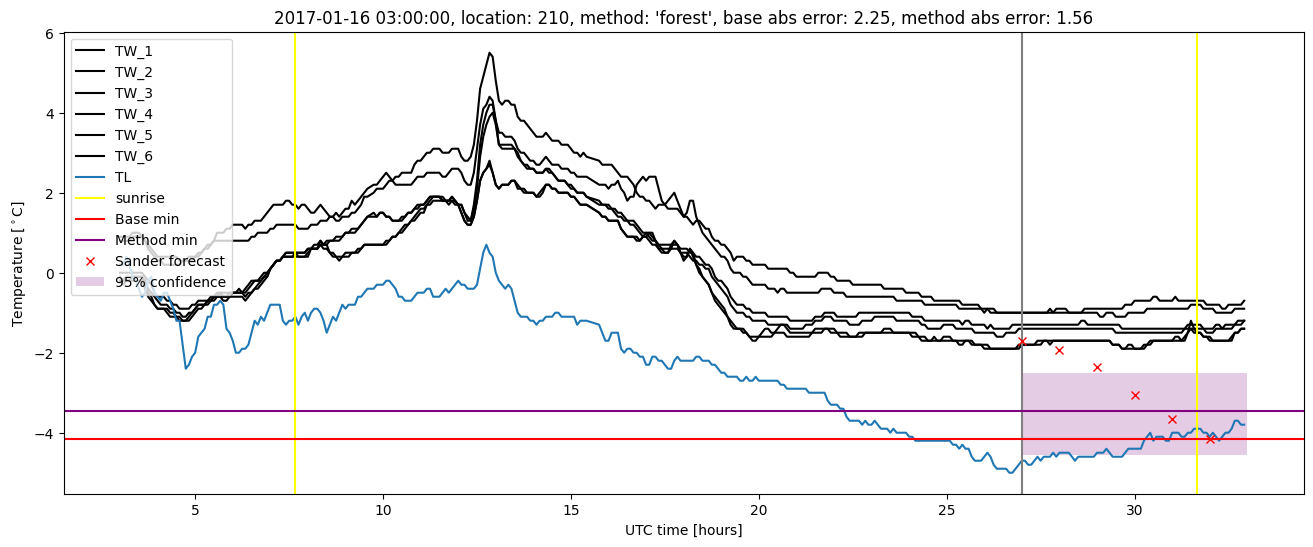
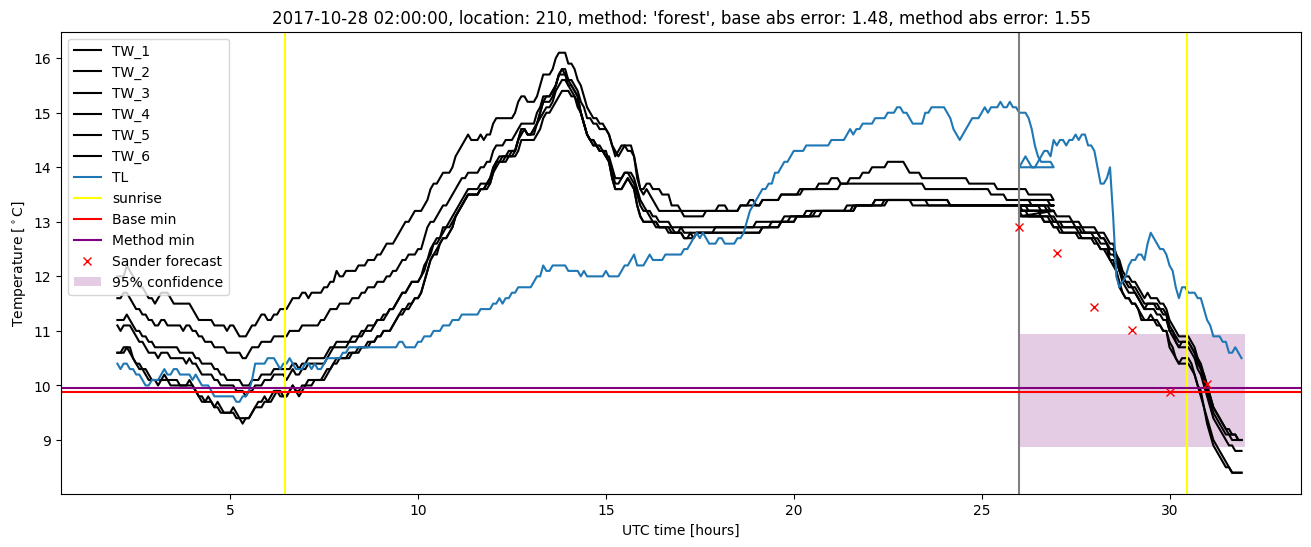
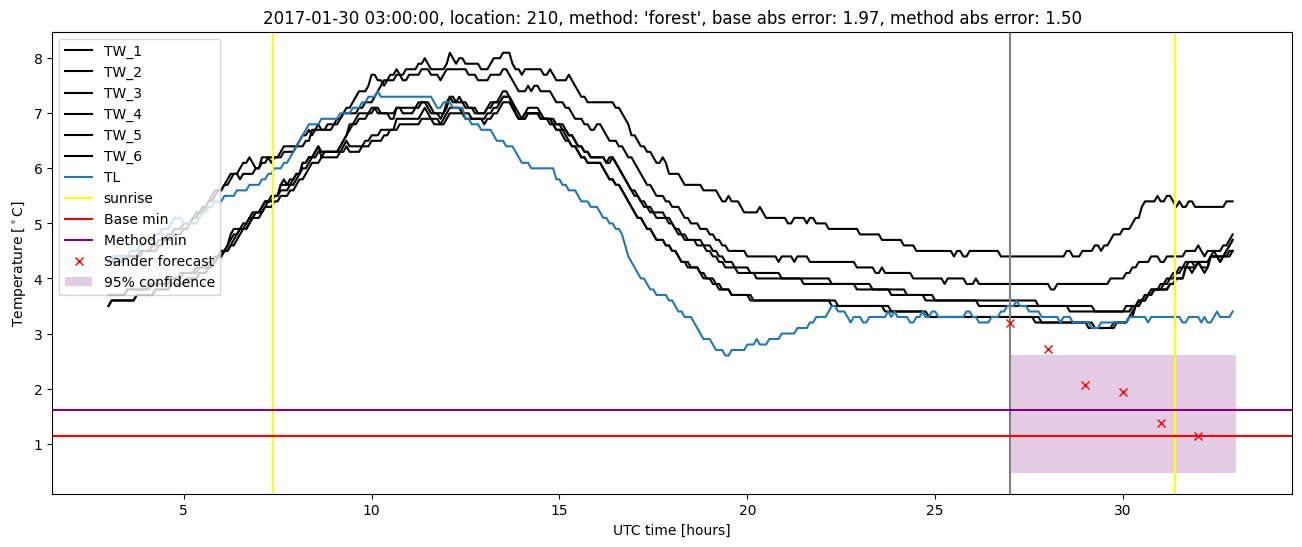
Random forest results
| names |
period |
power |
significance |
meanSquareError |
absError |
maxError |
CRPS |
IGN |
| baseline |
winter 2016 |
0.989 |
0.000e+00 |
0.313 |
0.427 |
1.740 |
NaN |
NaN |
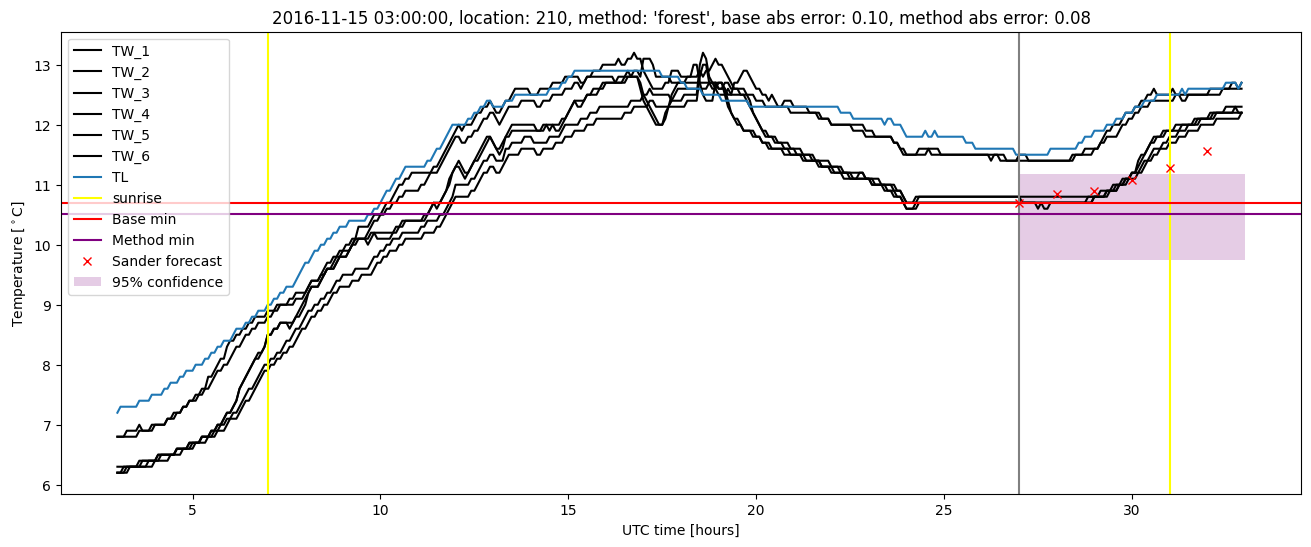
| forest |
winter 2016 |
0.989 |
0.000e+00 |
0.264 |
0.390 |
1.414 |
0.496 |
5.173 |
| baseline |
winter 2017 |
0.941 |
0.057 |
0.439 |
0.491 |
2.250 |
NaN |
NaN |
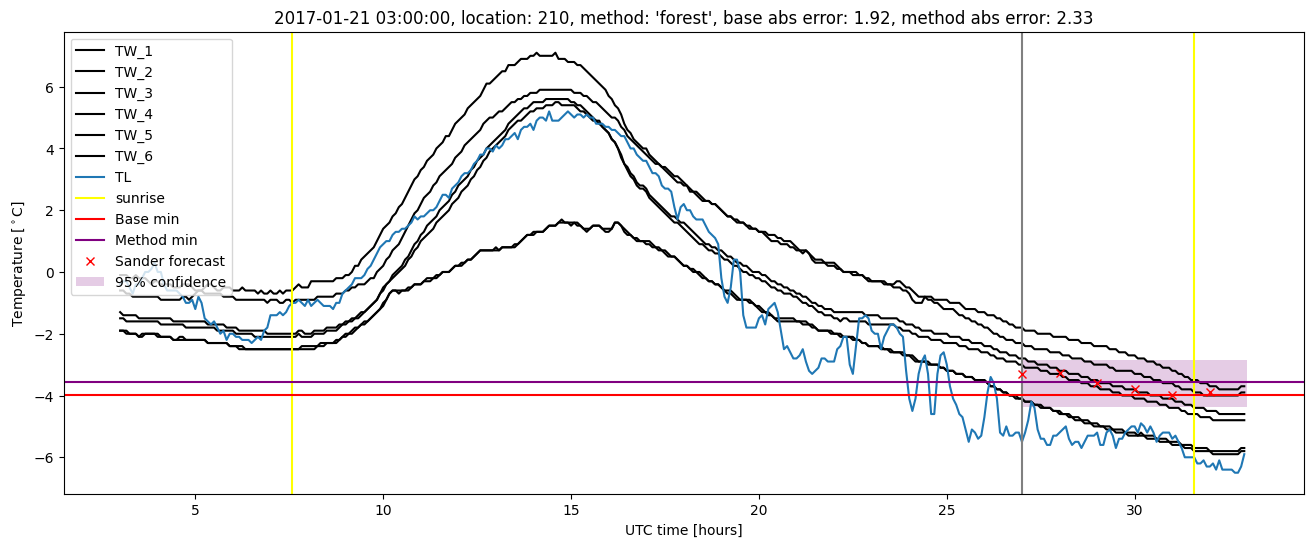
| forest |
winter 2017 |
0.949 |
0.086 |
0.376 |
0.453 |
2.330 |
0.484 |
5.206 |
| baseline |
winter 2018 |
0.993 |
0.138 |
0.305 |
0.420 |
1.638 |
NaN |
NaN |
| forest |
winter 2018 |
0.987 |
0.138 |
0.253 |
0.384 |
1.550 |
0.500 |
3.417 |
| baseline |
winter 2019 |
0.983 |
0.000e+00 |
0.286 |
0.401 |
1.767 |
NaN |
NaN |
| forest |
winter 2019 |
0.983 |
0.000e+00 |
0.206 |
0.335 |
1.360 |
0.481 |
3.415 |
| baseline |
all |
0.979 |
0.062 |
0.335 |
0.435 |
2.250 |
NaN |
NaN |
| forest |
all |
0.979 |
0.073 |
0.276 |
0.392 |
2.330 |
0.491 |
4.358 |
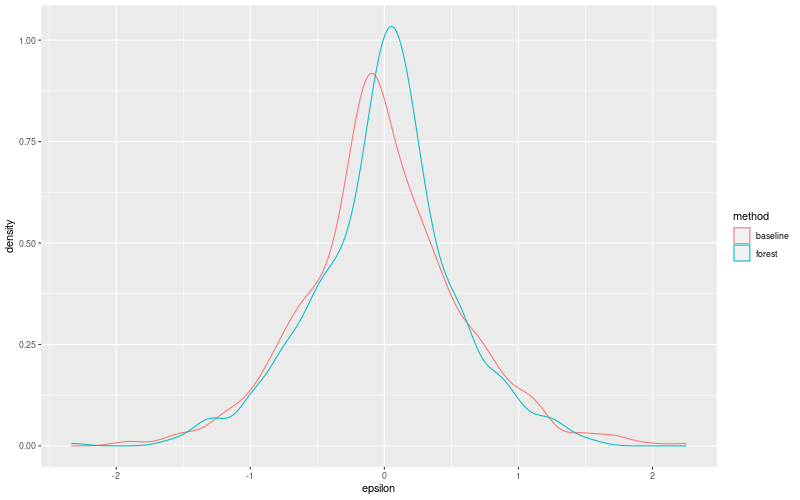
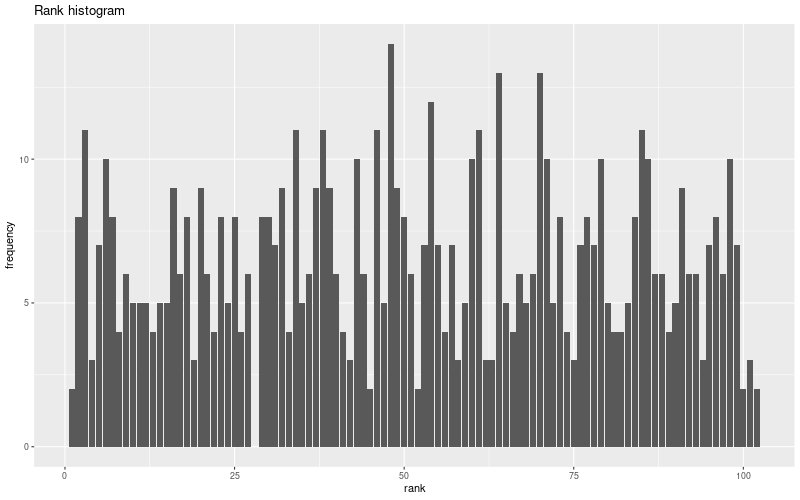
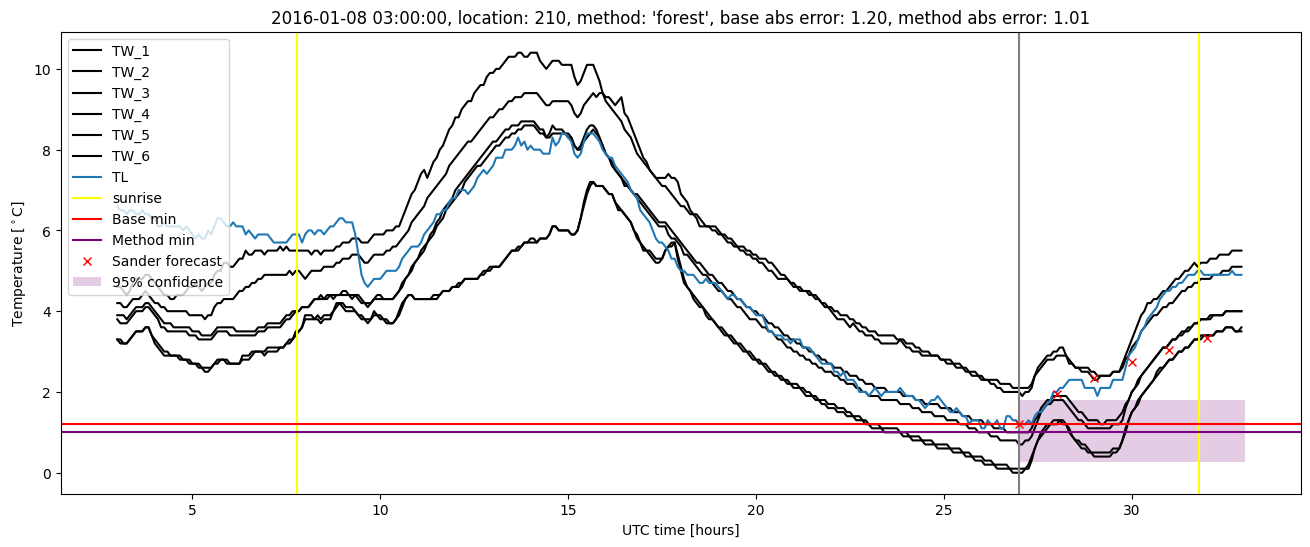
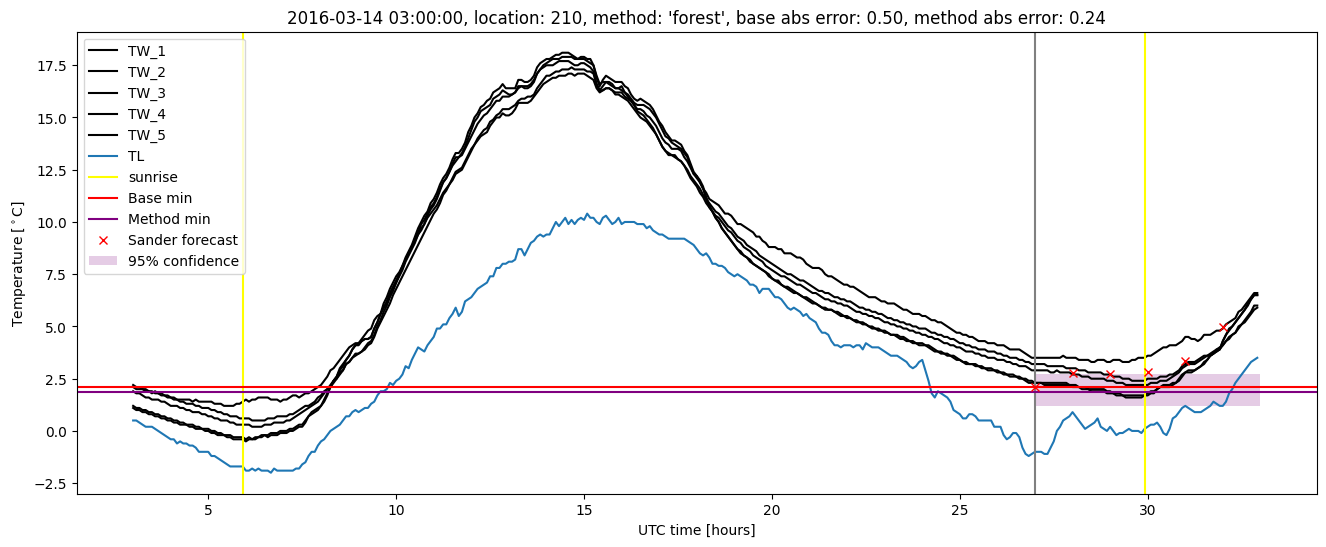
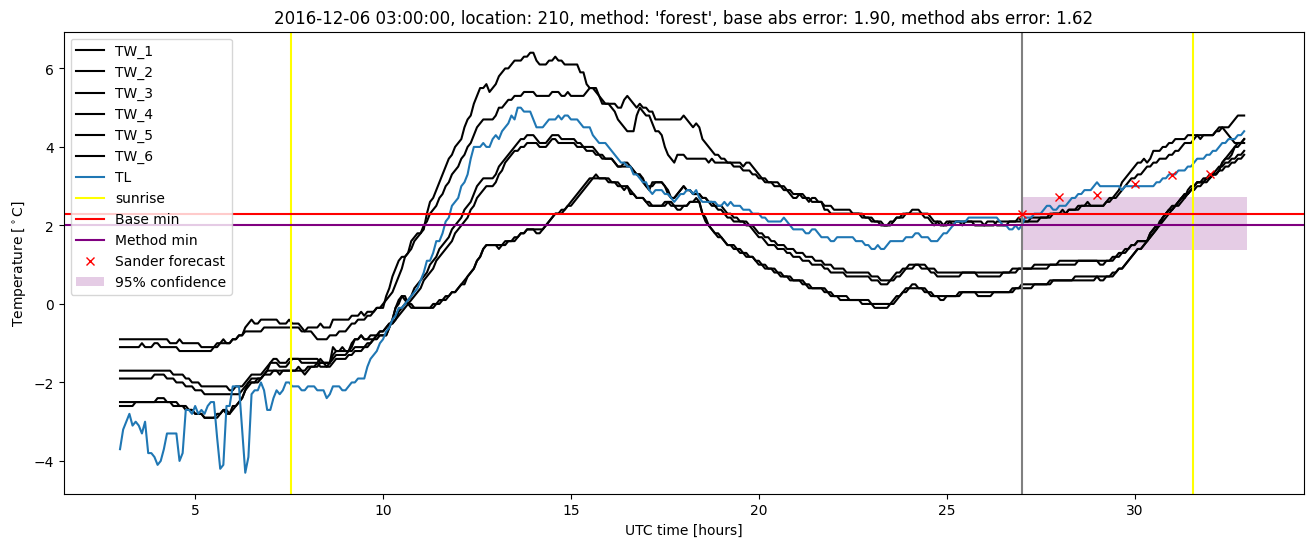
Random forest plots
Extended logistic regression results
| names |
period |
power |
significance |
meanSquareError |
absError |
maxError |
CRPS |
IGN |
| baseline |
winter 2016 |
0.989 |
0.000e+00 |
0.313 |
0.427 |
1.740 |
NaN |
NaN |
| elr |
winter 2016 |
0.989 |
0.000e+00 |
0.283 |
0.415 |
1.434 |
0.563 |
6.002 |
| baseline |
winter 2017 |
0.941 |
0.057 |
0.439 |
0.491 |
2.250 |
NaN |
NaN |
| elr |
winter 2017 |
0.983 |
0.057 |
0.360 |
0.454 |
2.147 |
0.536 |
6.265 |
| baseline |
winter 2018 |
0.993 |
0.138 |
0.305 |
0.420 |
1.638 |
NaN |
NaN |
| elr |
winter 2018 |
0.980 |
0.103 |
0.269 |
0.400 |
1.986 |
0.567 |
5.491 |
| baseline |
winter 2019 |
0.983 |
0.000e+00 |
0.286 |
0.401 |
1.767 |
NaN |
NaN |
| elr |
winter 2019 |
0.983 |
0.000e+00 |
0.194 |
0.332 |
1.732 |
0.542 |
4.671 |
| baseline |
all |
0.979 |
0.062 |
0.335 |
0.435 |
2.250 |
NaN |
NaN |
| elr |
all |
0.984 |
0.052 |
0.280 |
0.403 |
2.147 |
0.554 |
5.661 |
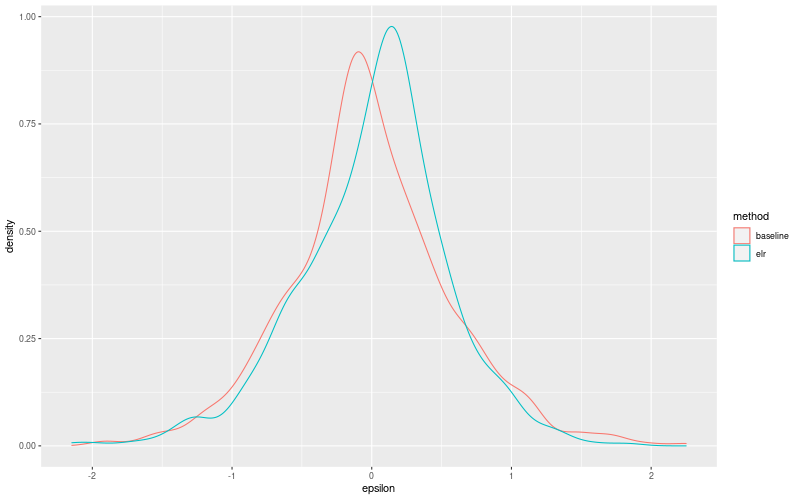
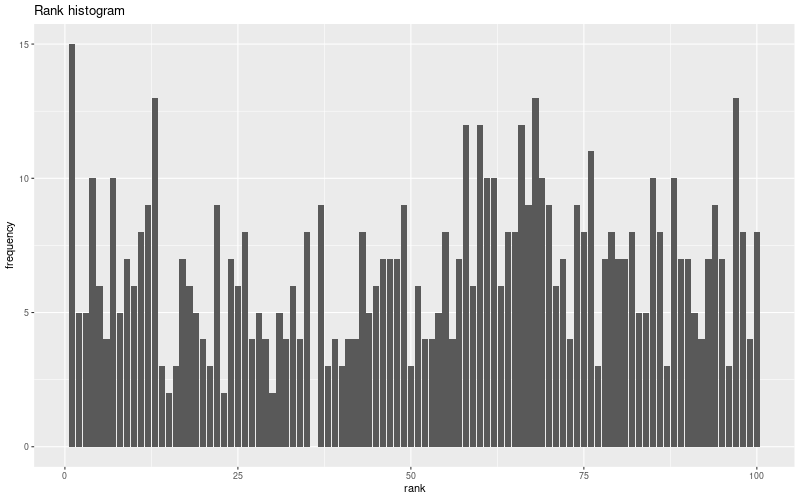
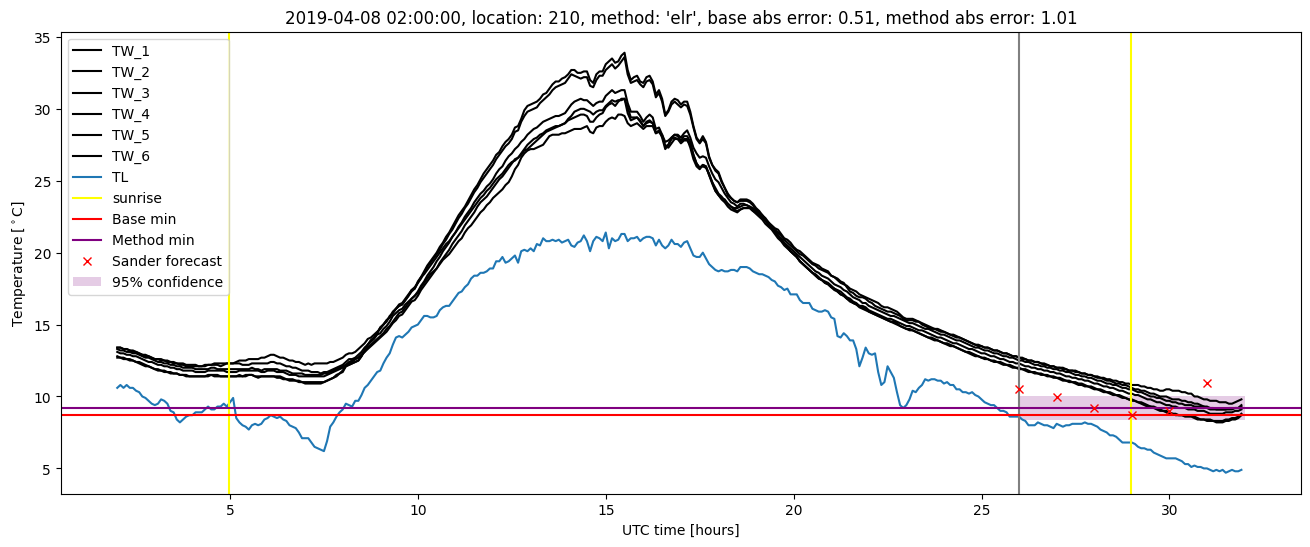
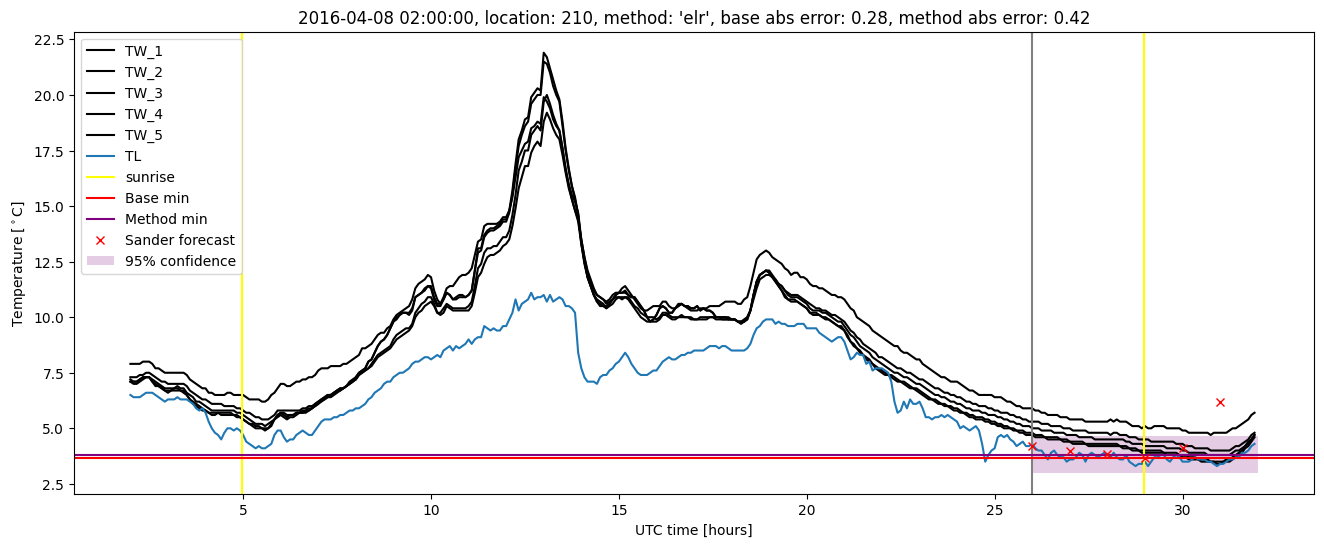
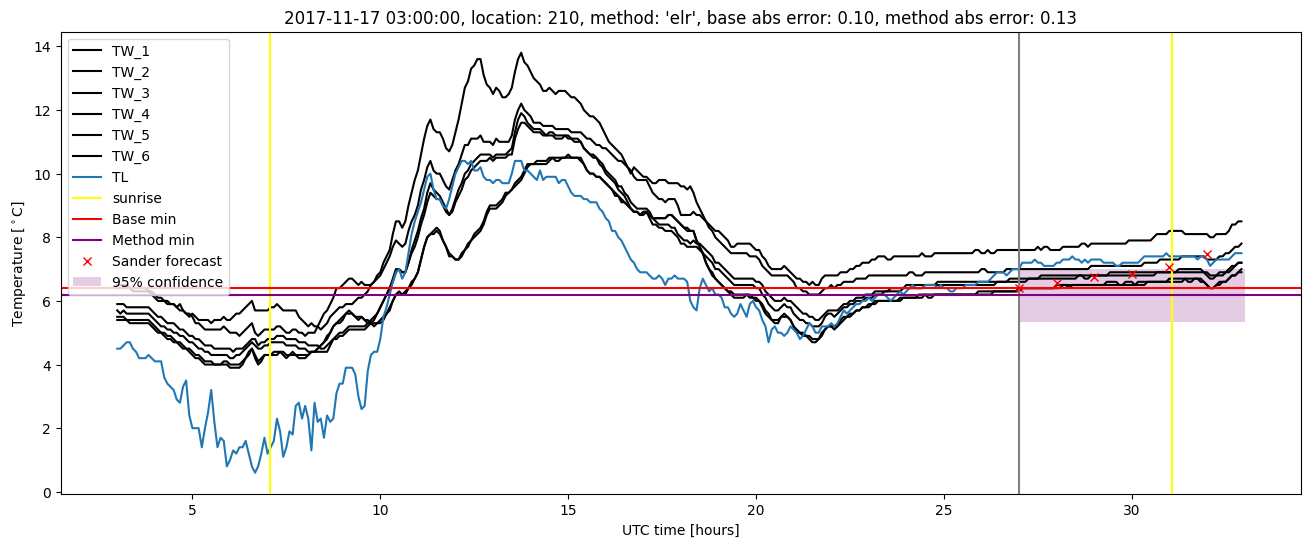
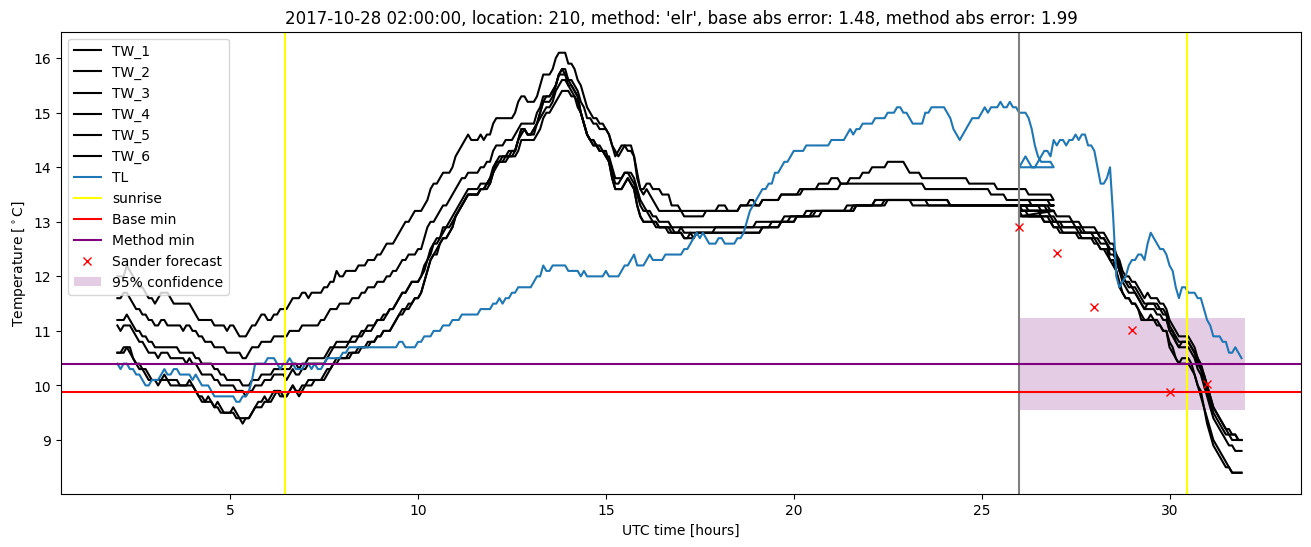
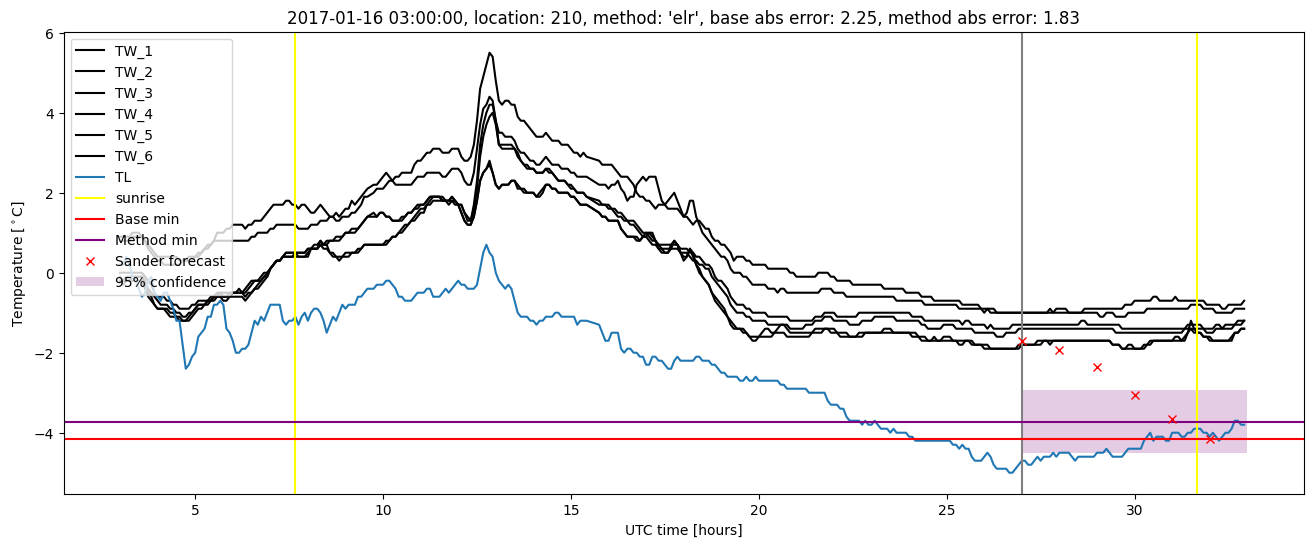
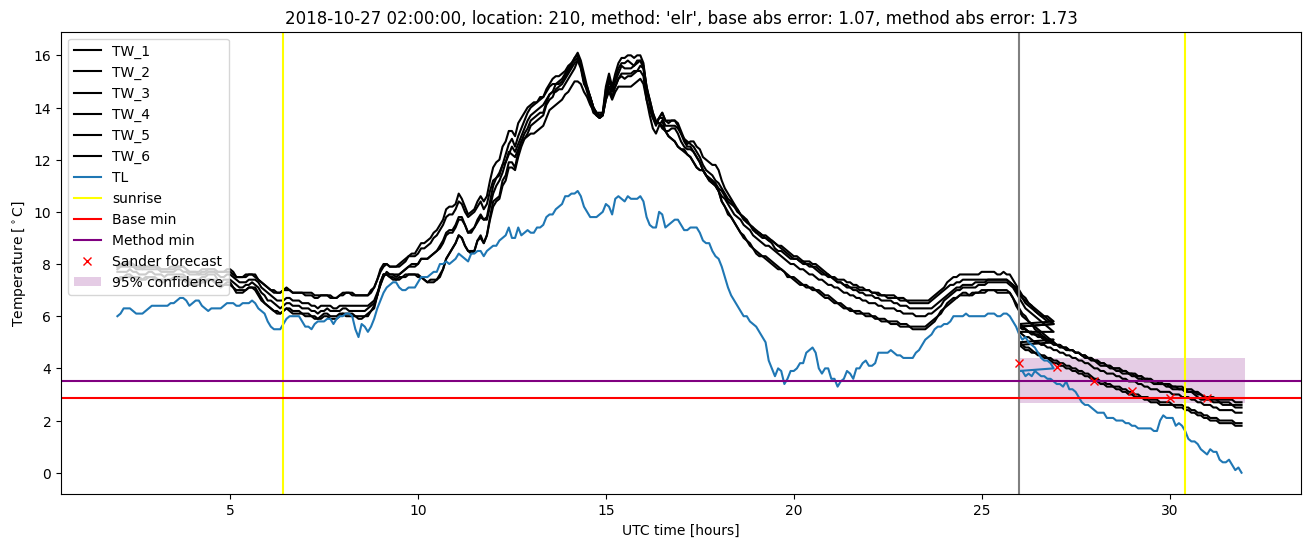
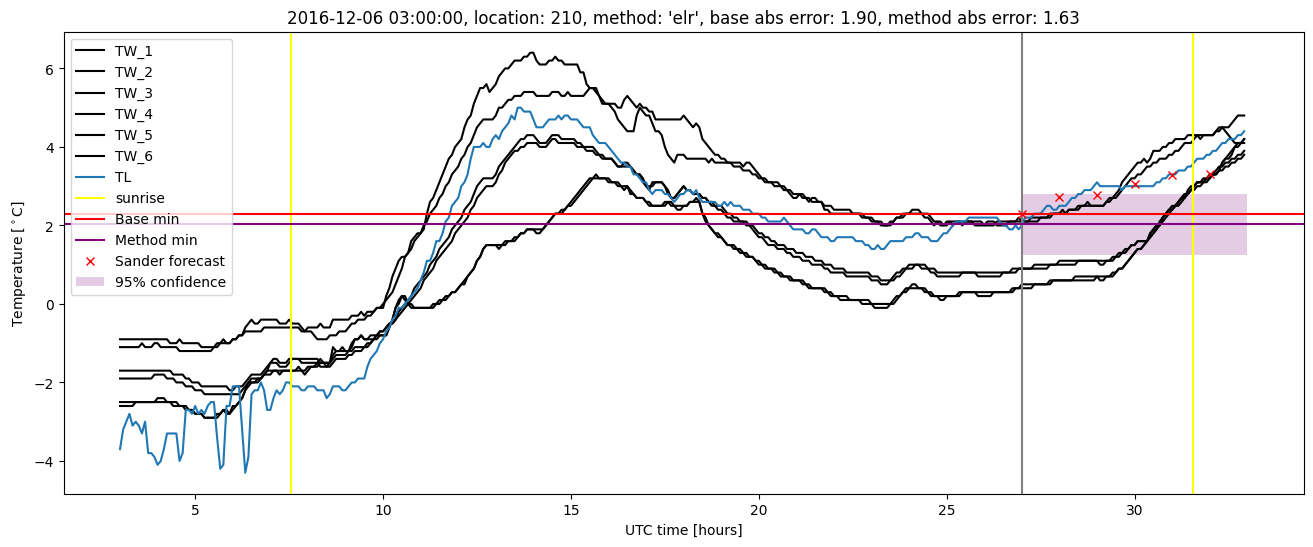
Extended logistic regression plots