GMS location: 209
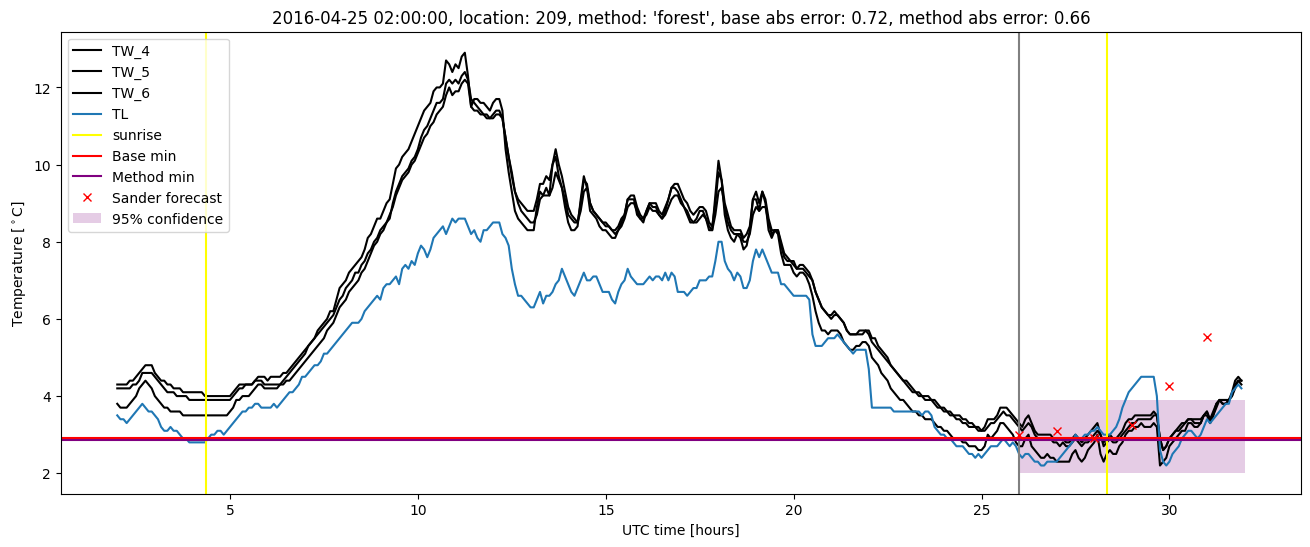
Random forest results
| names |
period |
power |
significance |
meanSquareError |
absError |
maxError |
CRPS |
IGN |
| baseline |
winter 2016 |
0.984 |
0.000e+00 |
0.331 |
0.440 |
2.072 |
NaN |
NaN |
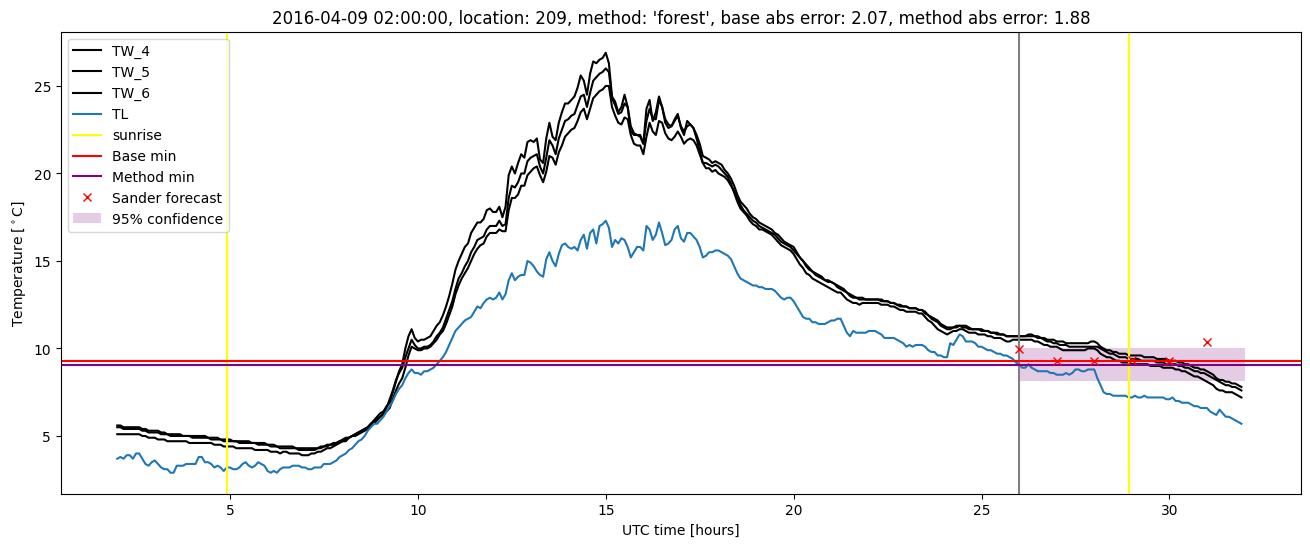
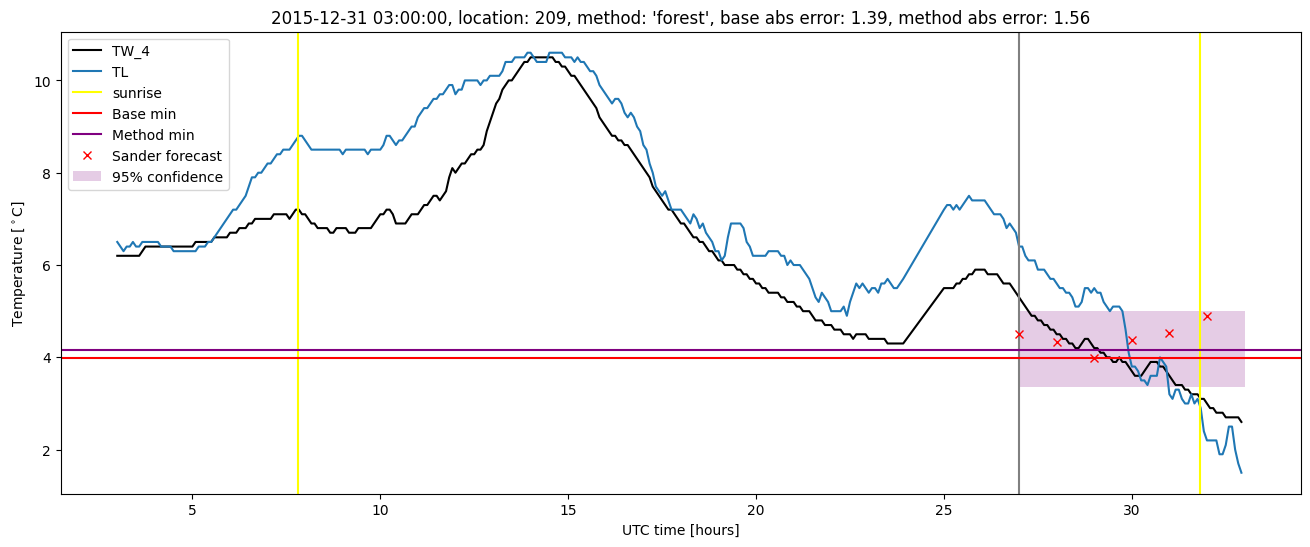
| forest |
winter 2016 |
1.000 |
0.000e+00 |
0.243 |
0.364 |
1.877 |
0.452 |
4.978 |
| baseline |
winter 2017 |
0.968 |
0.000e+00 |
0.395 |
0.481 |
2.128 |
NaN |
NaN |
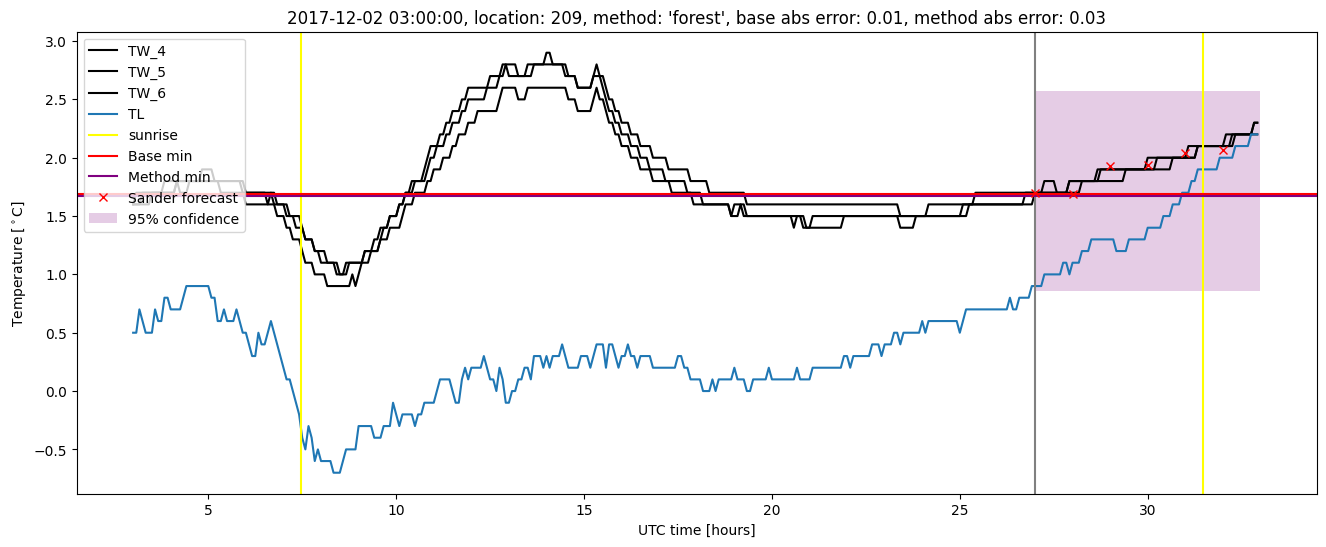
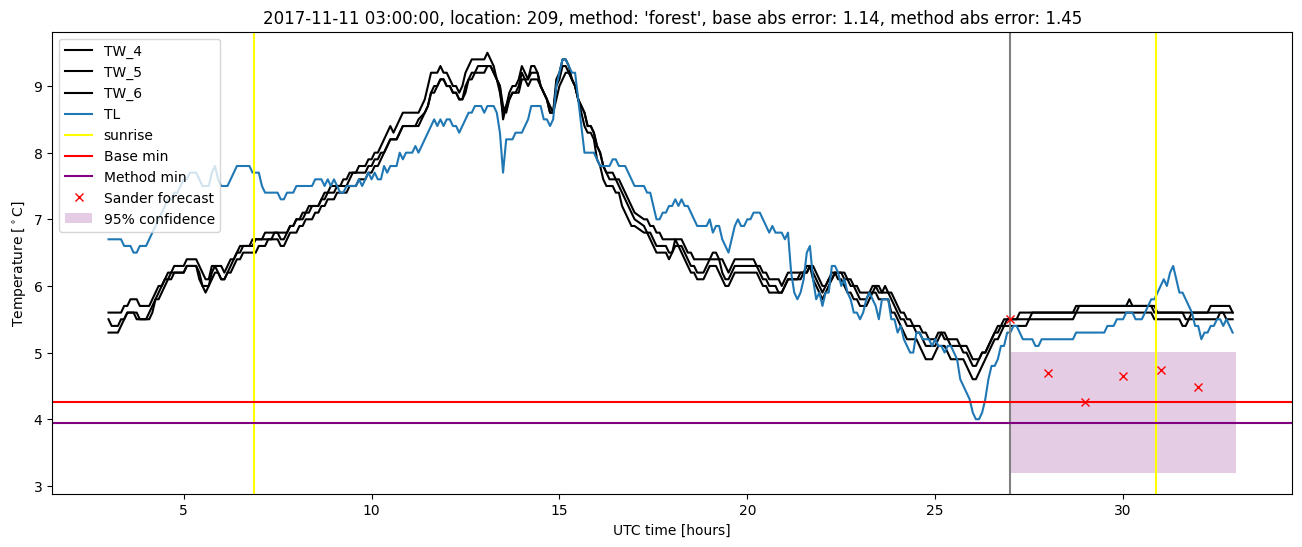
| forest |
winter 2017 |
0.992 |
0.000e+00 |
0.260 |
0.392 |
1.402 |
0.462 |
5.283 |
| baseline |
winter 2018 |
0.981 |
0.043 |
0.324 |
0.431 |
1.590 |
NaN |
NaN |
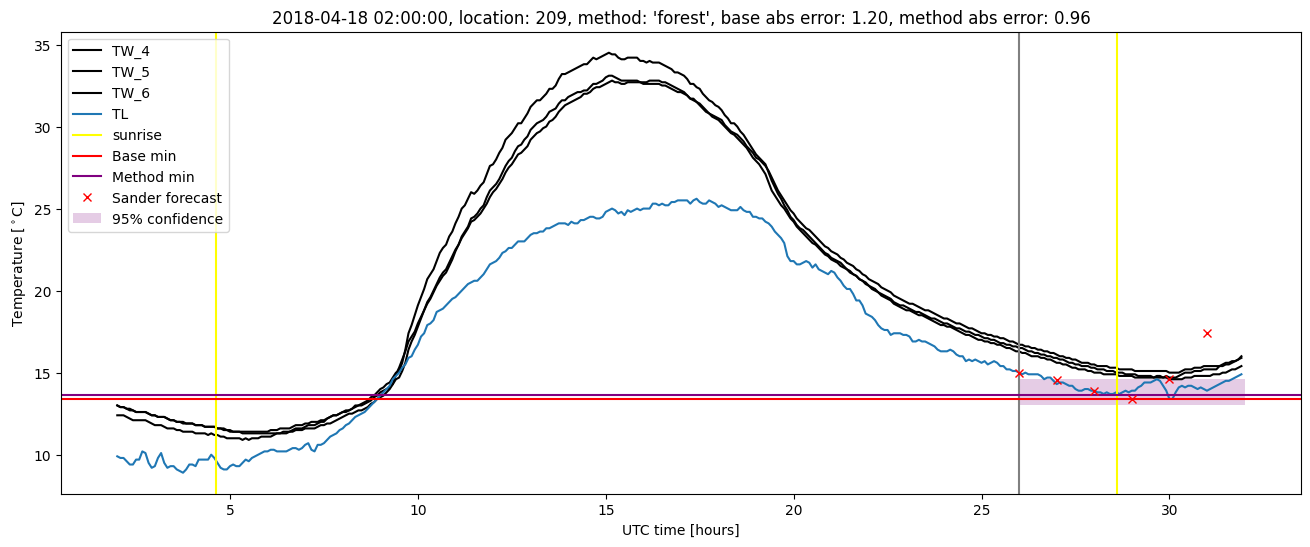
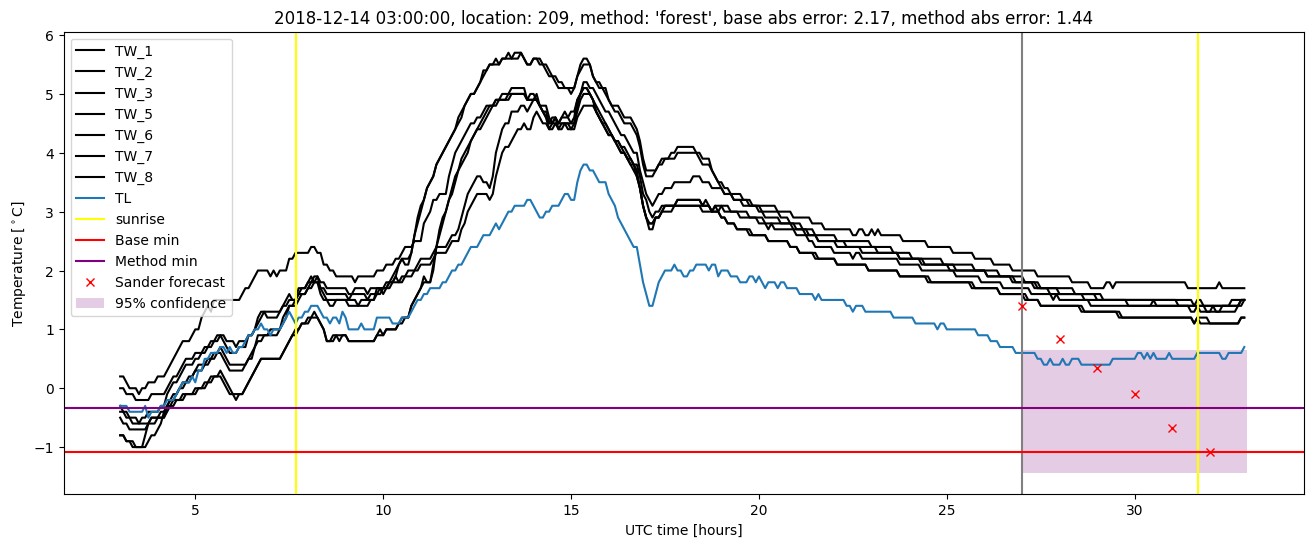
| forest |
winter 2018 |
0.994 |
0.043 |
0.224 |
0.360 |
1.452 |
0.465 |
3.639 |
| baseline |
winter 2019 |
0.992 |
0.077 |
0.328 |
0.434 |
2.175 |
NaN |
NaN |
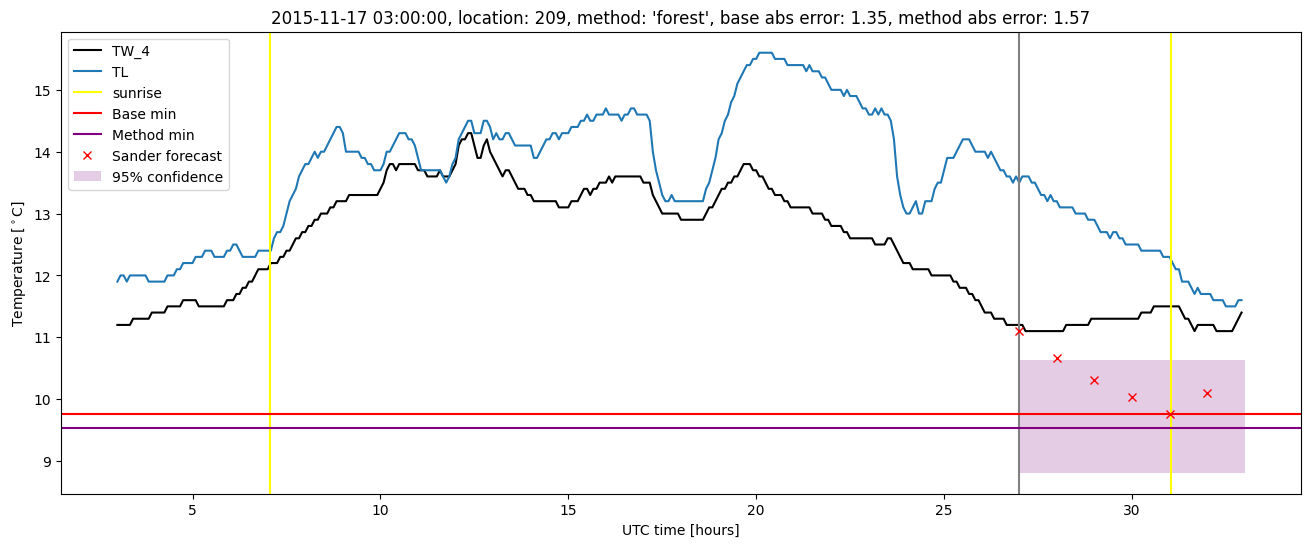
| forest |
winter 2019 |
0.992 |
0.077 |
0.222 |
0.347 |
1.437 |
0.453 |
4.321 |
| baseline |
all |
0.981 |
0.025 |
0.343 |
0.446 |
2.175 |
NaN |
NaN |
| forest |
all |
0.995 |
0.025 |
0.238 |
0.366 |
1.877 |
0.458 |
4.563 |
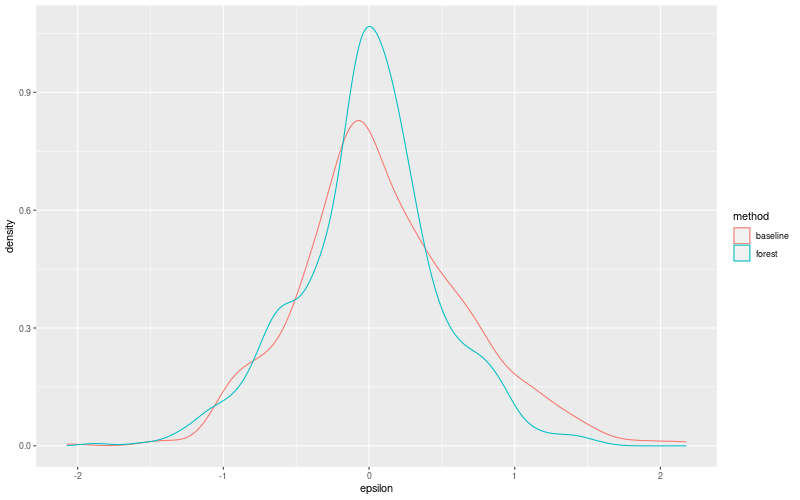
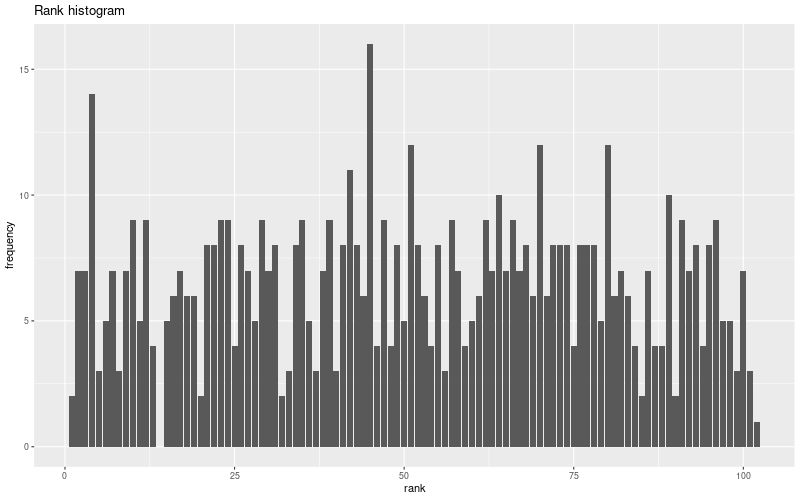
Random forest plots
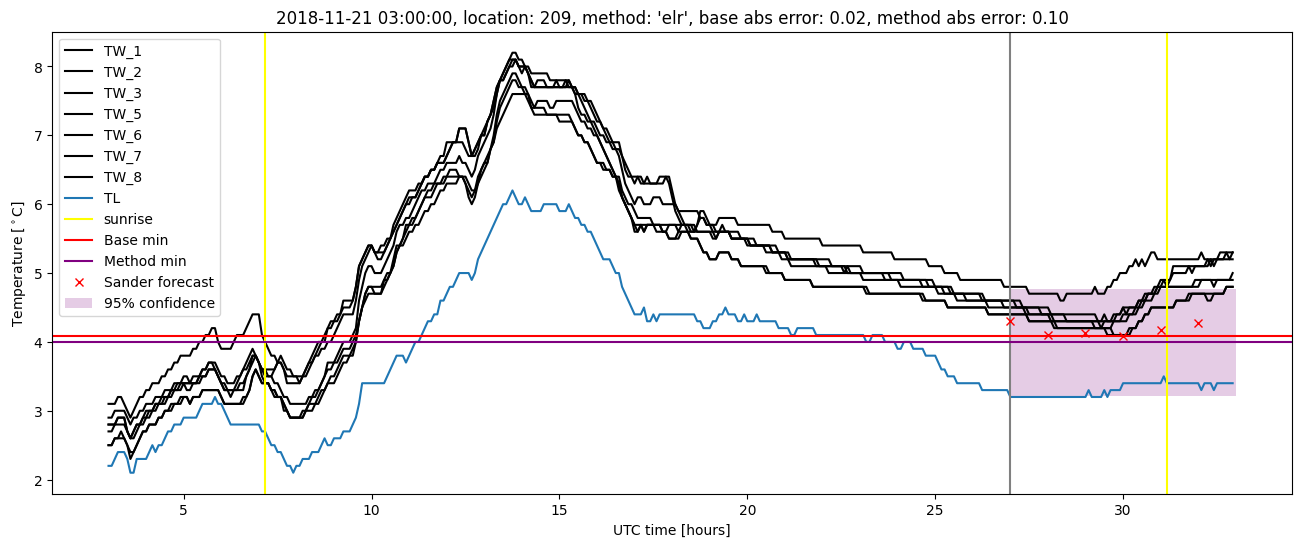
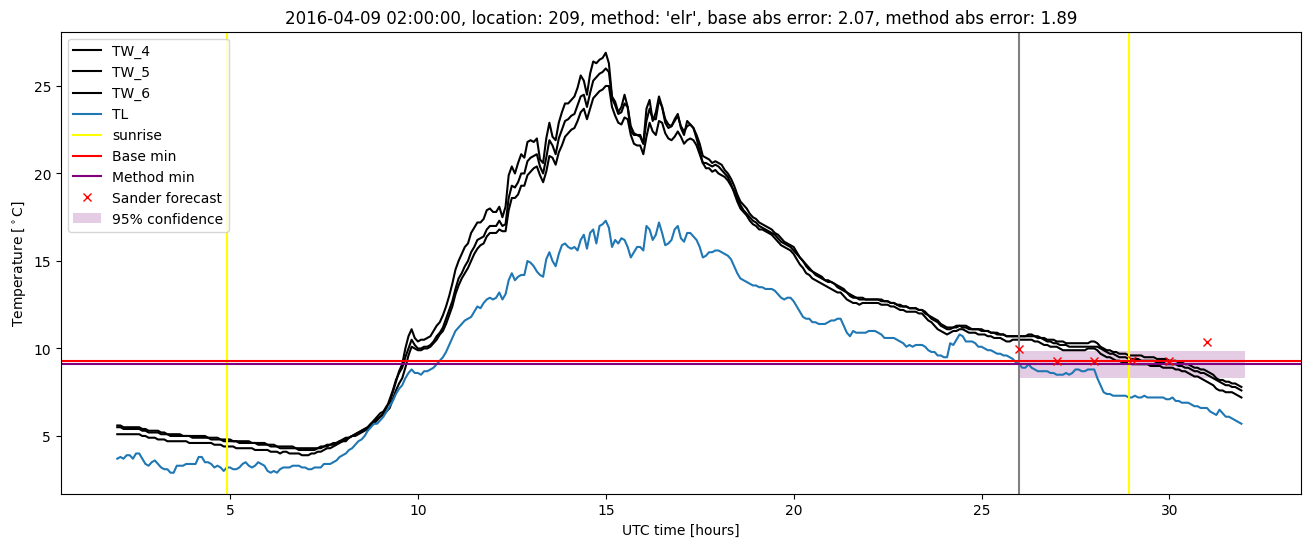
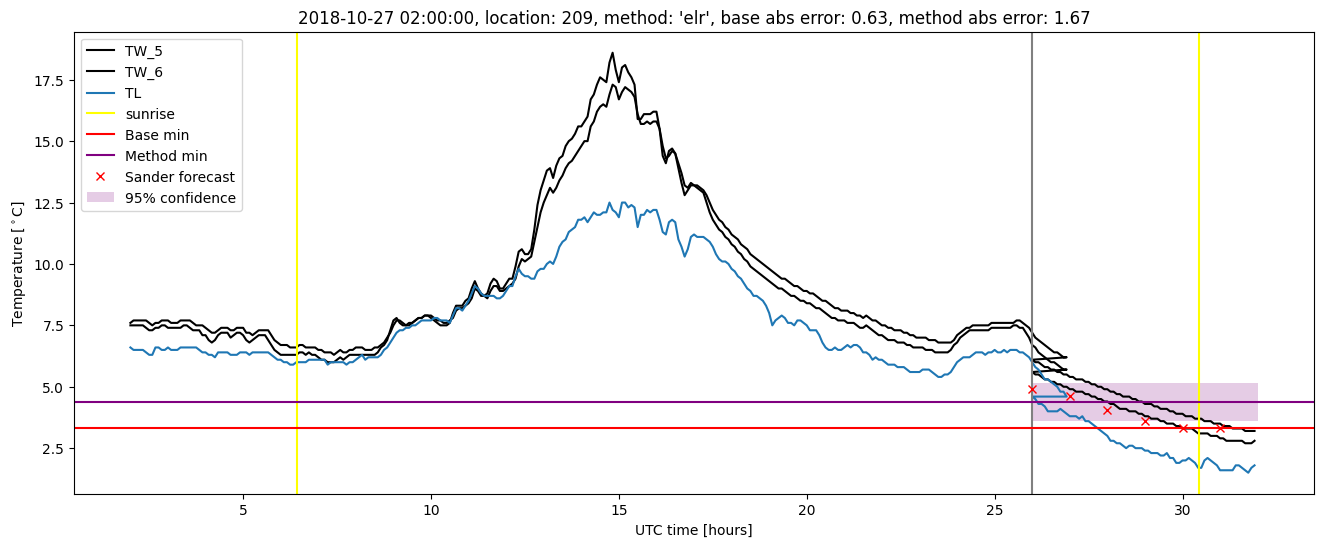
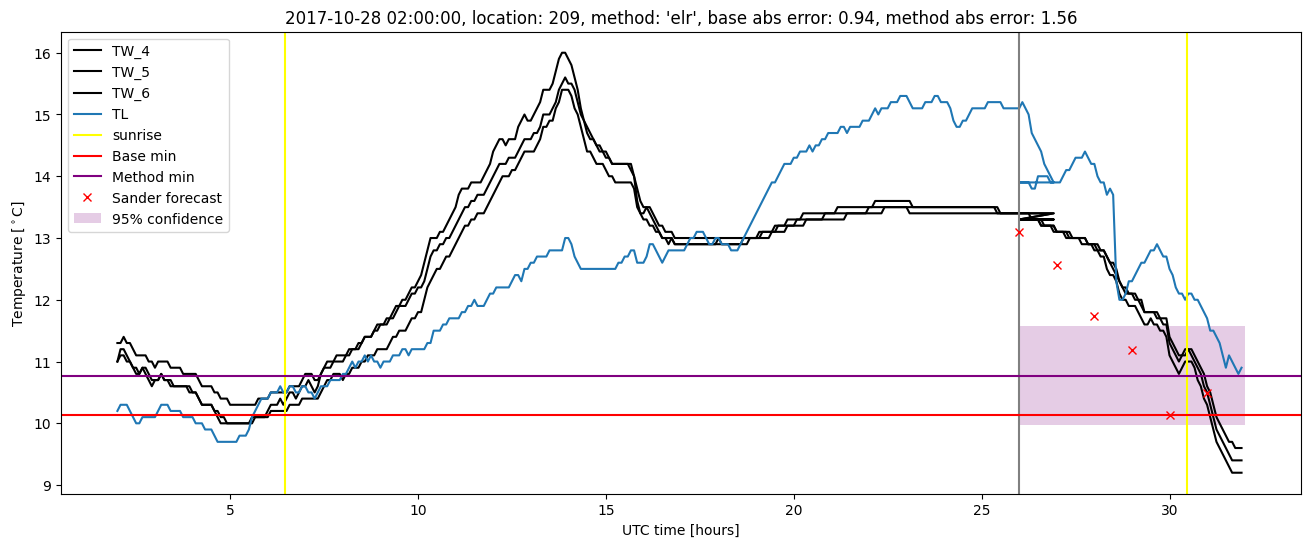
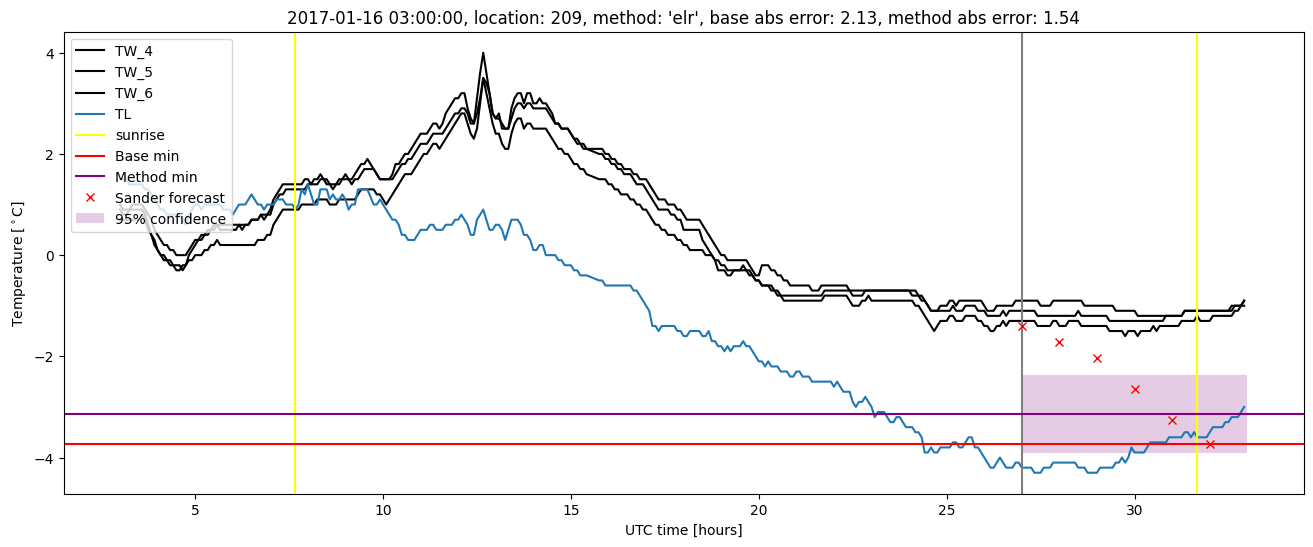
Extended logistic regression results
| names |
period |
power |
significance |
meanSquareError |
absError |
maxError |
CRPS |
IGN |
| baseline |
winter 2016 |
0.984 |
0.000e+00 |
0.331 |
0.440 |
2.072 |
NaN |
NaN |
| elr |
winter 2016 |
1.000 |
0.000e+00 |
0.257 |
0.379 |
1.890 |
0.542 |
7.326 |
| baseline |
winter 2017 |
0.968 |
0.000e+00 |
0.395 |
0.481 |
2.128 |
NaN |
NaN |
| elr |
winter 2017 |
1.000 |
0.036 |
0.241 |
0.374 |
1.542 |
0.506 |
6.083 |
| baseline |
winter 2018 |
0.981 |
0.043 |
0.324 |
0.431 |
1.590 |
NaN |
NaN |
| elr |
winter 2018 |
0.981 |
0.043 |
0.265 |
0.404 |
1.564 |
0.526 |
5.645 |
| baseline |
winter 2019 |
0.992 |
0.077 |
0.328 |
0.434 |
2.175 |
NaN |
NaN |
| elr |
winter 2019 |
1.000 |
0.077 |
0.205 |
0.335 |
1.671 |
0.519 |
5.984 |
| baseline |
all |
0.981 |
0.025 |
0.343 |
0.446 |
2.175 |
NaN |
NaN |
| elr |
all |
0.995 |
0.038 |
0.245 |
0.376 |
1.890 |
0.525 |
6.329 |
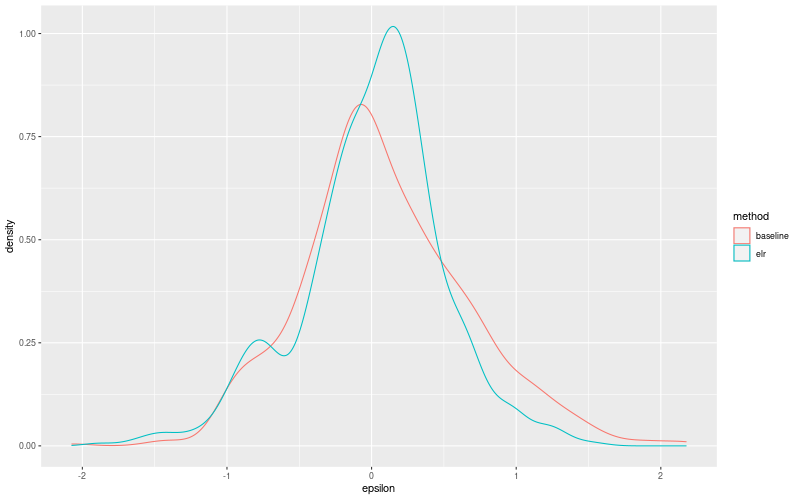
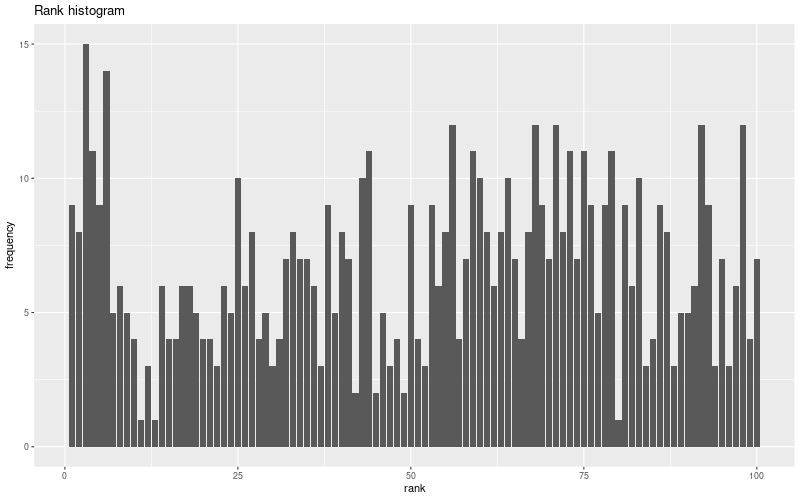
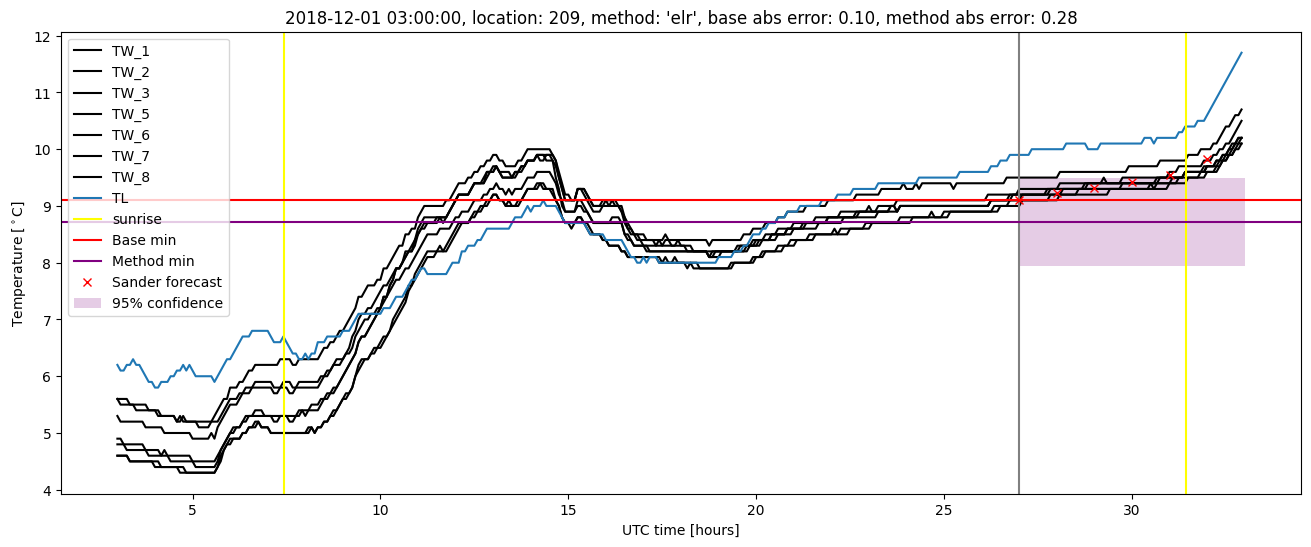
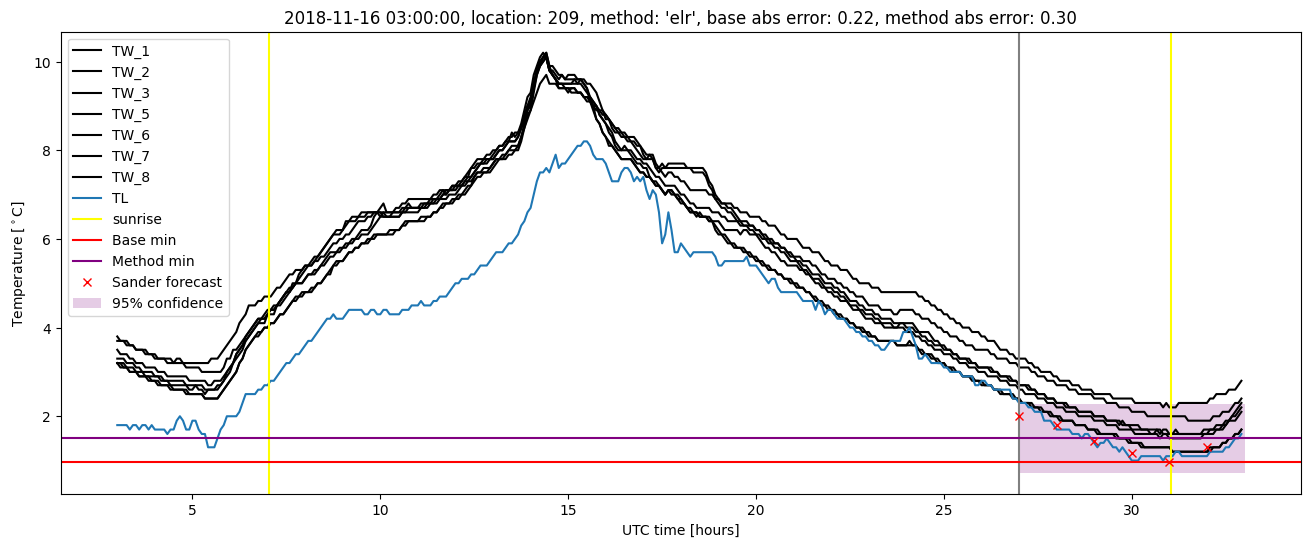
Extended logistic regression plots