GMS location: 208
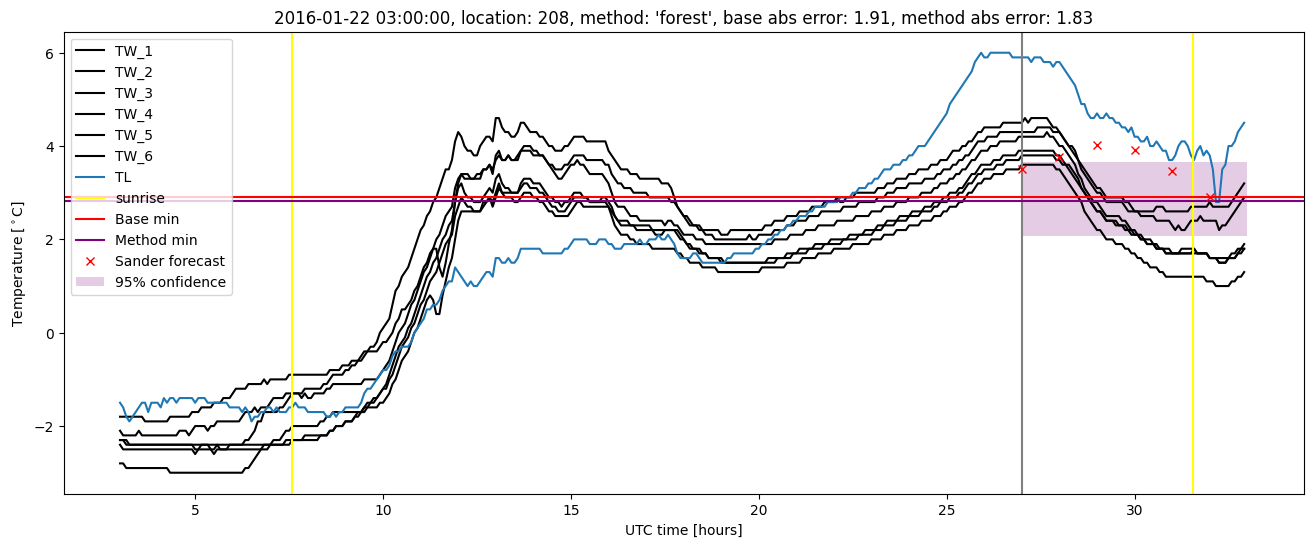
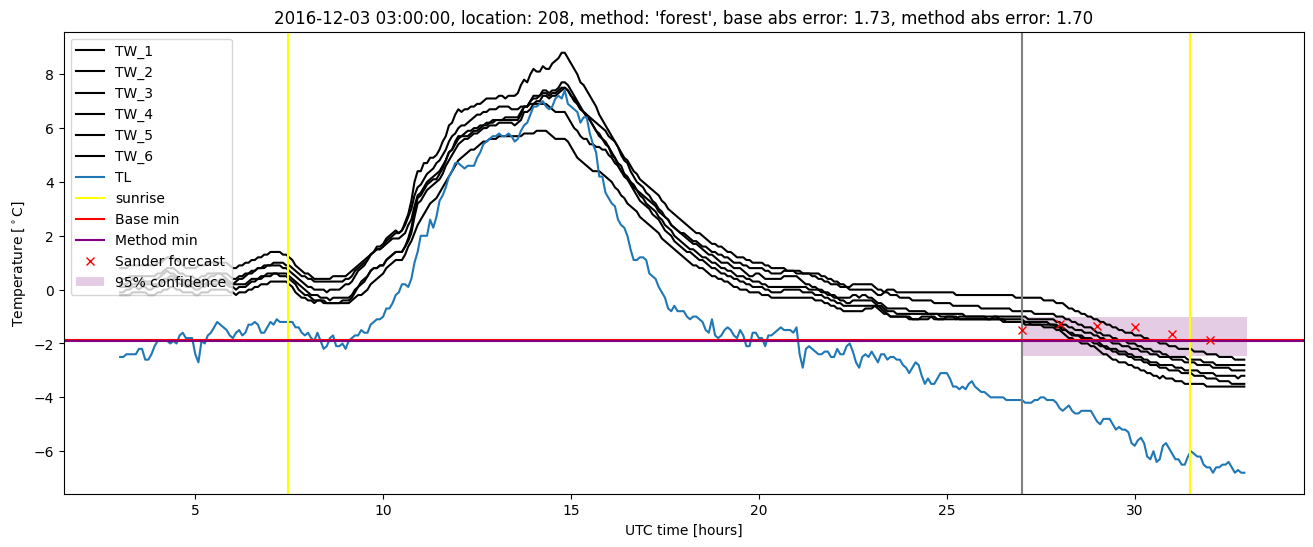
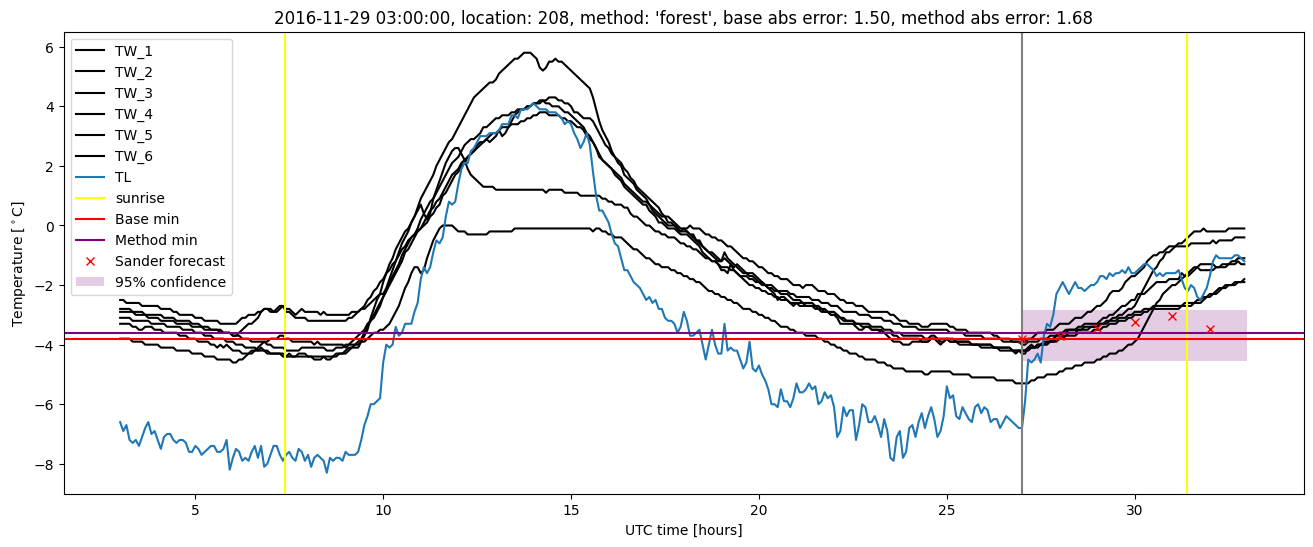
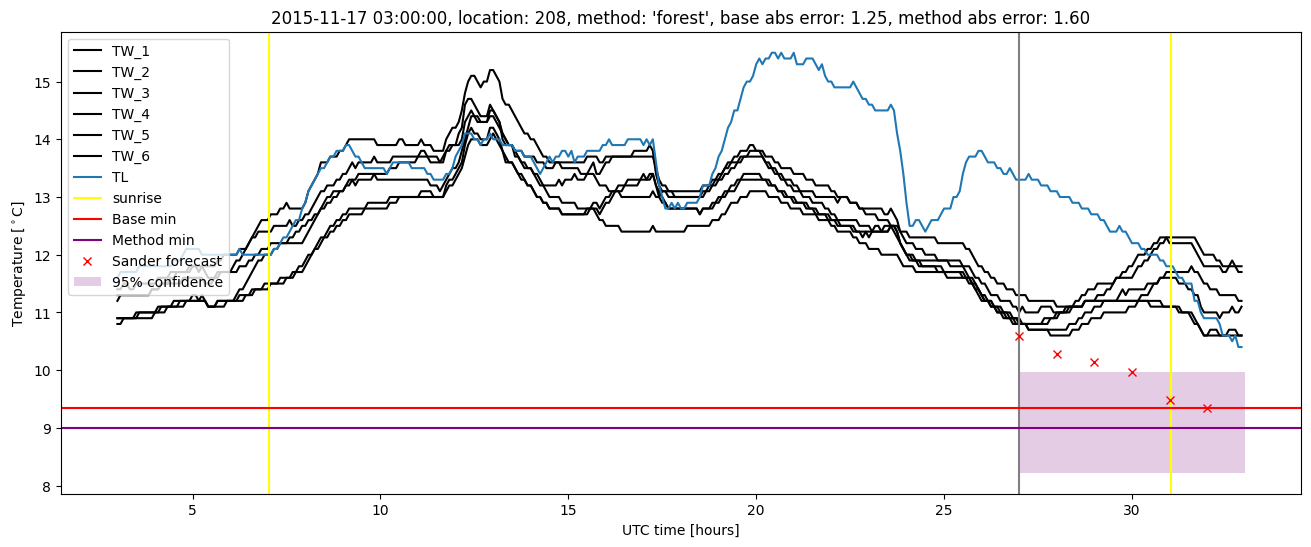
Random forest results
| names |
period |
power |
significance |
meanSquareError |
absError |
maxError |
CRPS |
IGN |
| baseline |
winter 2016 |
0.994 |
0.038 |
0.355 |
0.462 |
1.914 |
NaN |
NaN |
| forest |
winter 2016 |
0.988 |
0.000e+00 |
0.303 |
0.412 |
1.833 |
0.528 |
8.557 |
| baseline |
winter 2017 |
0.965 |
0.075 |
0.386 |
0.463 |
2.446 |
NaN |
NaN |
| forest |
winter 2017 |
0.956 |
0.100 |
0.333 |
0.419 |
1.840 |
0.502 |
5.455 |
| baseline |
winter 2018 |
0.993 |
0.129 |
0.347 |
0.443 |
1.816 |
NaN |
NaN |
| forest |
winter 2018 |
0.986 |
0.065 |
0.273 |
0.401 |
1.514 |
0.522 |
4.986 |
| baseline |
winter 2019 |
0.986 |
0.062 |
0.284 |
0.393 |
2.050 |
NaN |
NaN |
| forest |
winter 2019 |
0.986 |
0.062 |
0.213 |
0.340 |
1.471 |
0.523 |
4.431 |
| baseline |
all |
0.986 |
0.080 |
0.344 |
0.441 |
2.446 |
NaN |
NaN |
| forest |
all |
0.981 |
0.062 |
0.281 |
0.394 |
1.840 |
0.519 |
5.977 |
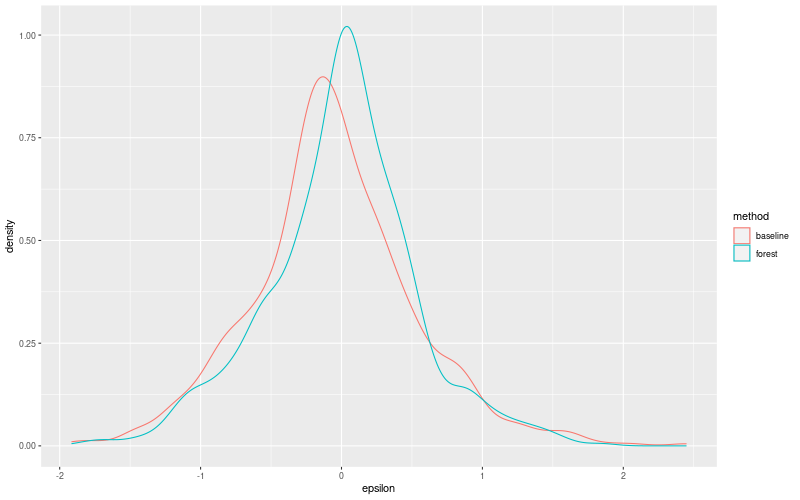
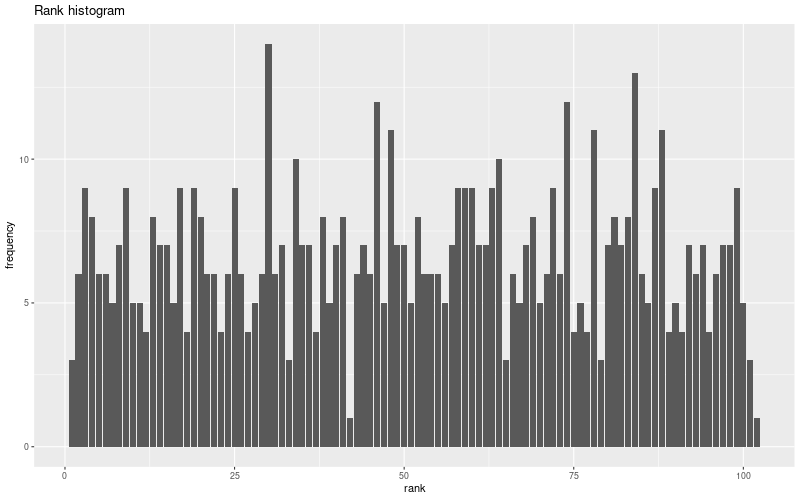
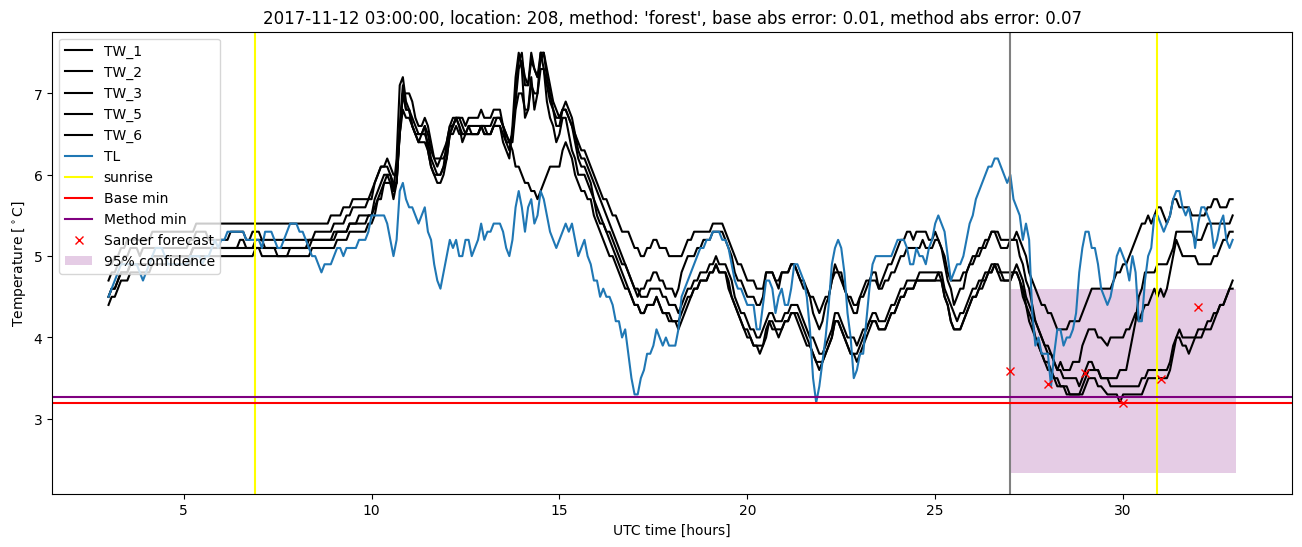
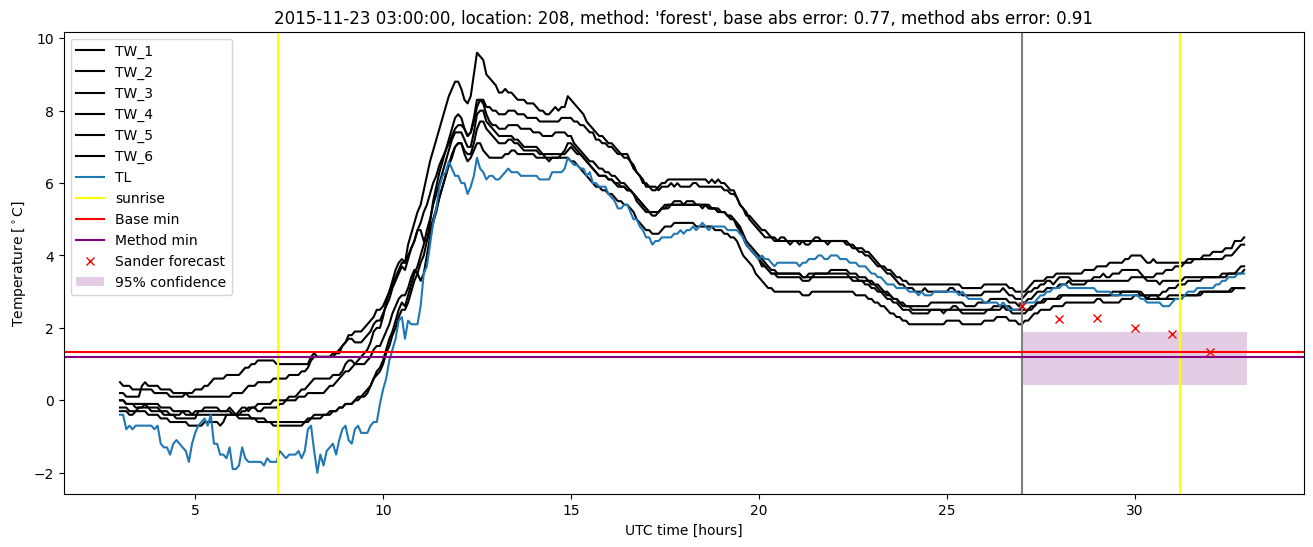
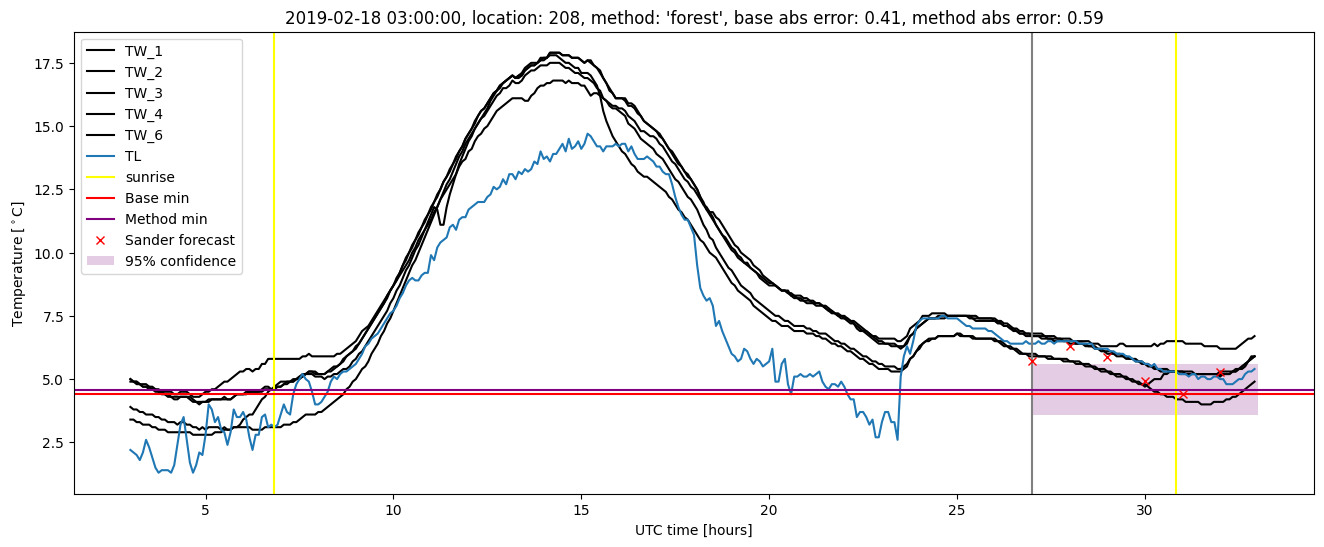
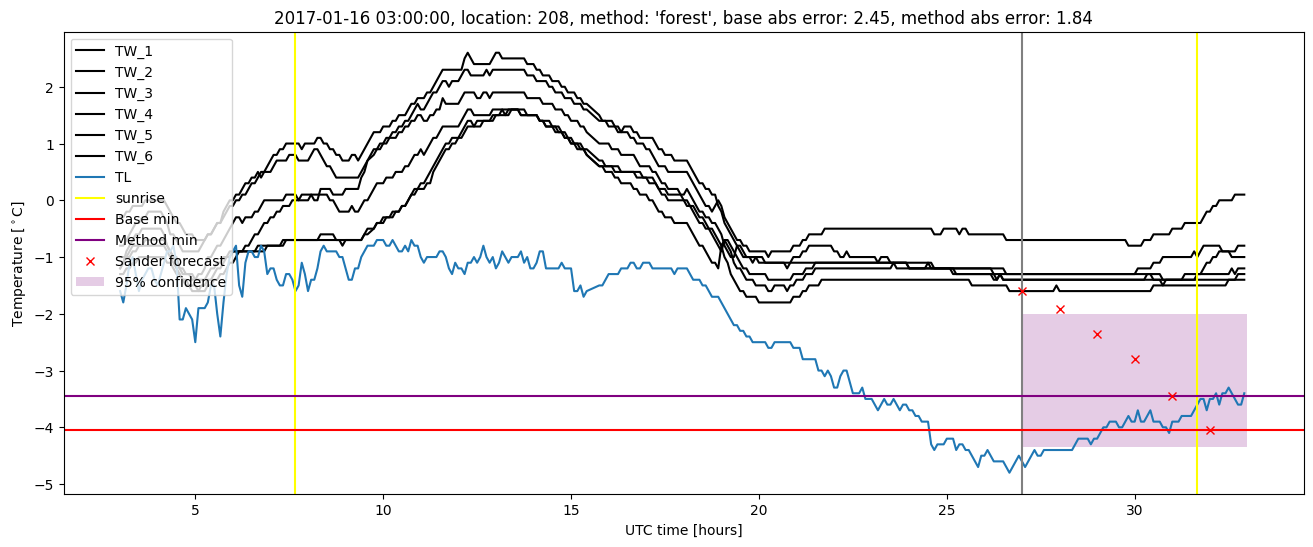
Random forest plots
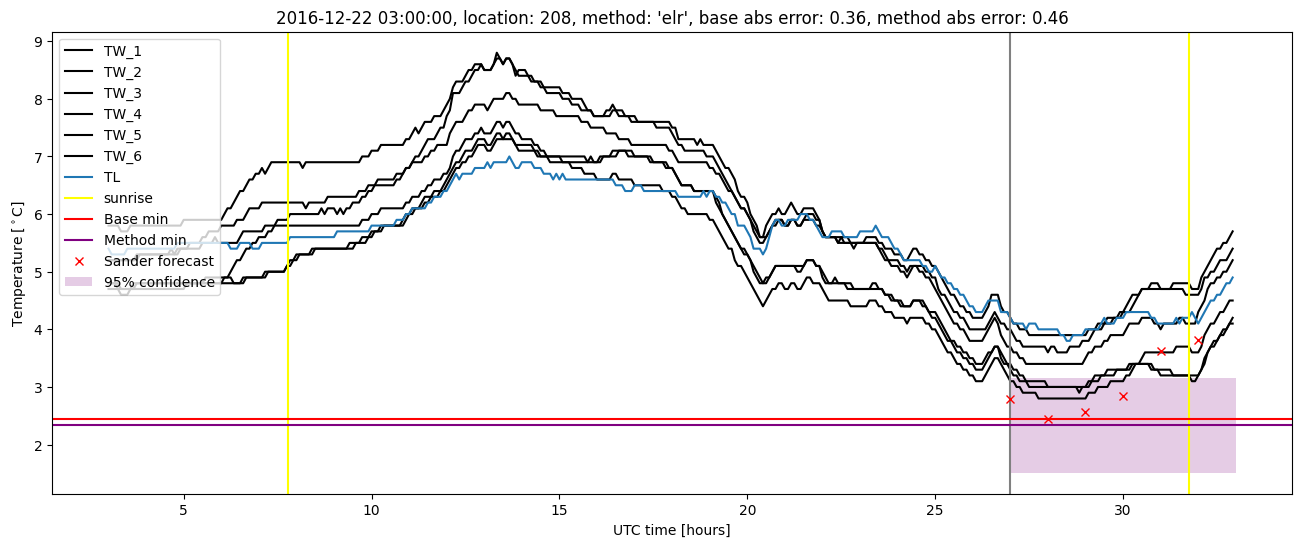
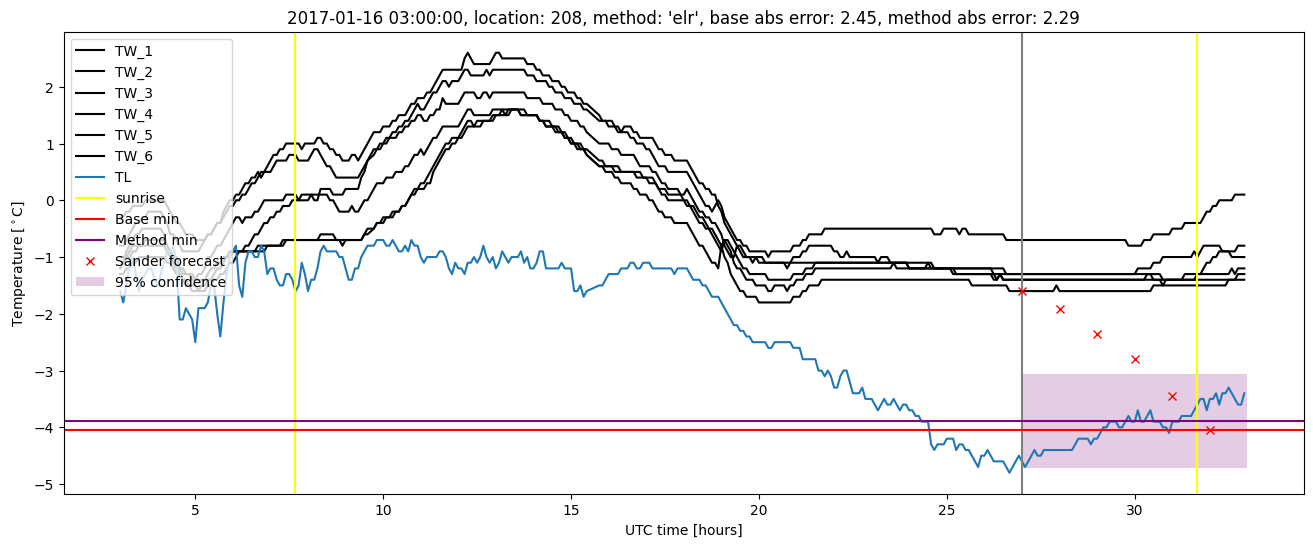
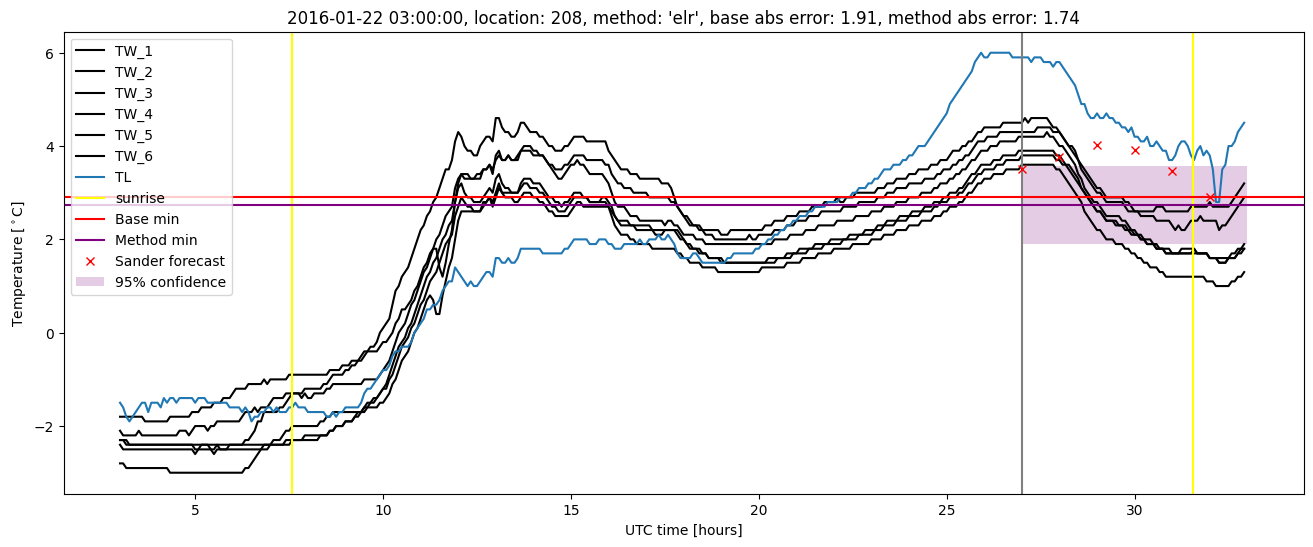
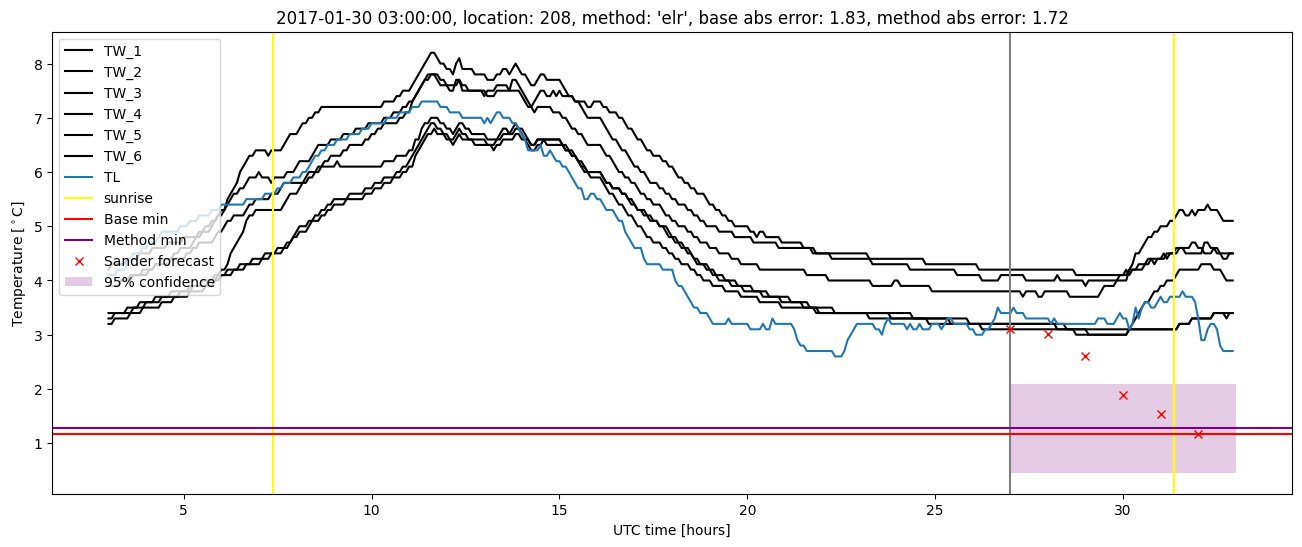
Extended logistic regression results
| names |
period |
power |
significance |
meanSquareError |
absError |
maxError |
CRPS |
IGN |
| baseline |
winter 2016 |
0.994 |
0.038 |
0.355 |
0.462 |
1.914 |
NaN |
NaN |
| elr |
winter 2016 |
0.988 |
0.000e+00 |
0.324 |
0.443 |
1.740 |
0.601 |
6.322 |
| baseline |
winter 2017 |
0.965 |
0.075 |
0.386 |
0.463 |
2.446 |
NaN |
NaN |
| elr |
winter 2017 |
0.956 |
0.125 |
0.364 |
0.447 |
2.291 |
0.572 |
6.010 |
| baseline |
winter 2018 |
0.993 |
0.129 |
0.347 |
0.443 |
1.816 |
NaN |
NaN |
| elr |
winter 2018 |
0.986 |
0.065 |
0.298 |
0.433 |
1.612 |
0.607 |
6.959 |
| baseline |
winter 2019 |
0.986 |
0.062 |
0.284 |
0.393 |
2.050 |
NaN |
NaN |
| elr |
winter 2019 |
0.986 |
0.062 |
0.214 |
0.354 |
1.194 |
0.546 |
4.722 |
| baseline |
all |
0.986 |
0.080 |
0.344 |
0.441 |
2.446 |
NaN |
NaN |
| elr |
all |
0.981 |
0.071 |
0.301 |
0.421 |
2.291 |
0.583 |
6.040 |
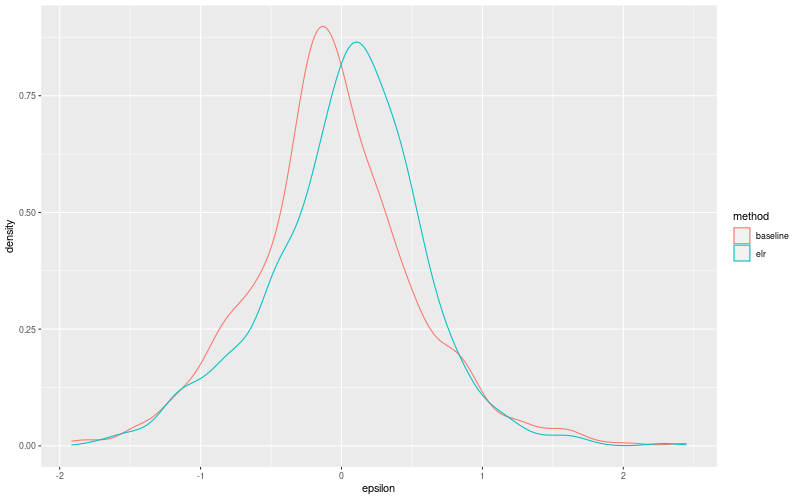
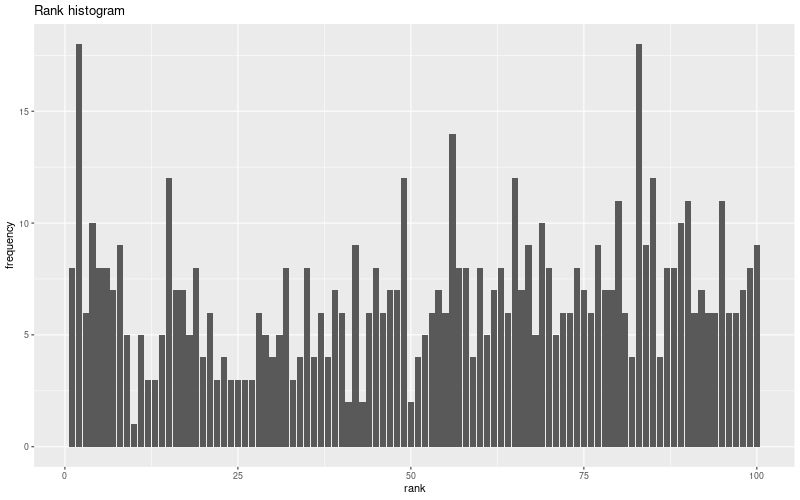
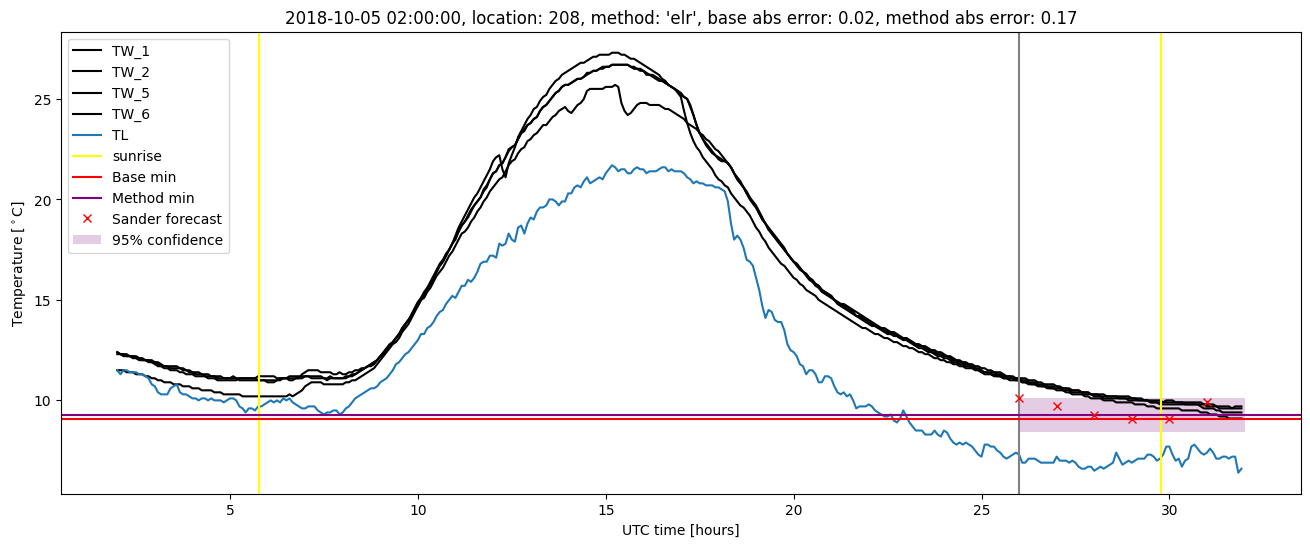
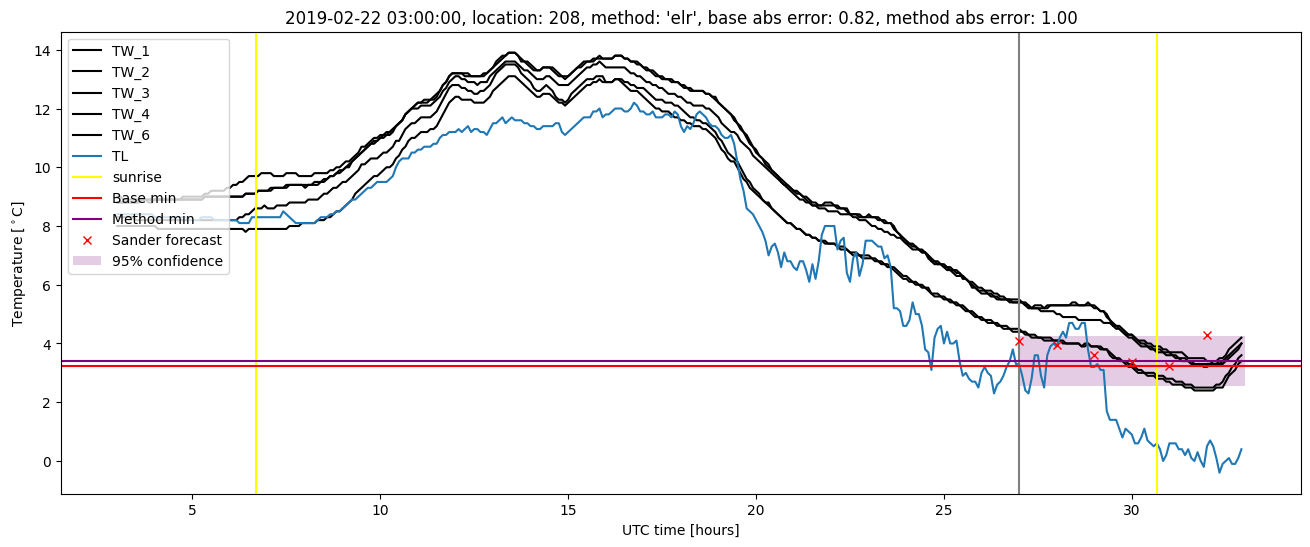
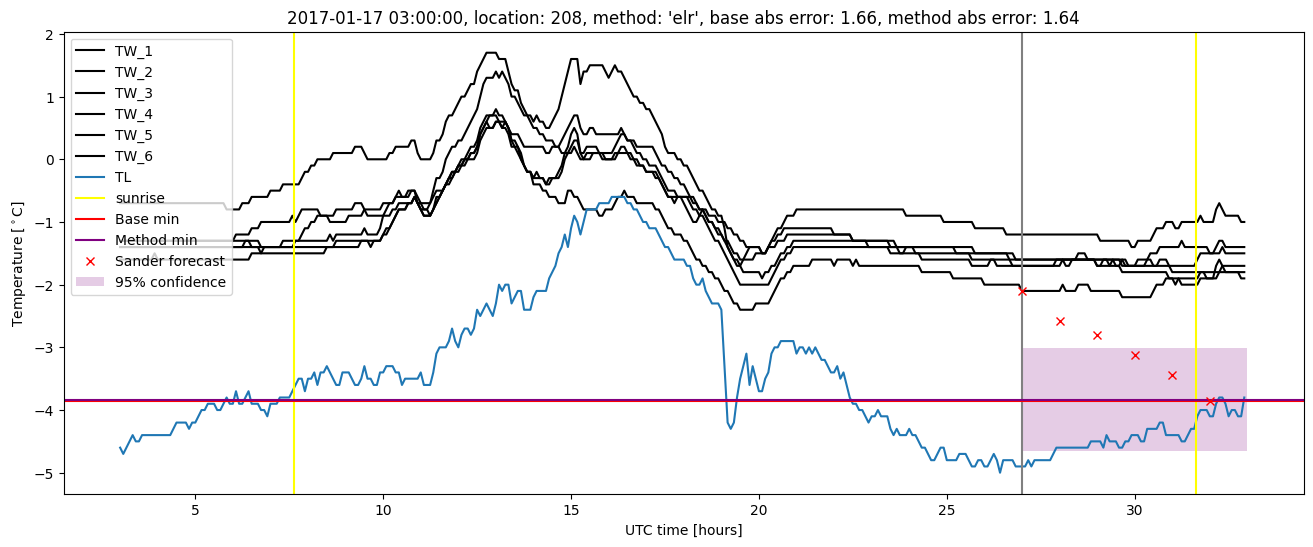
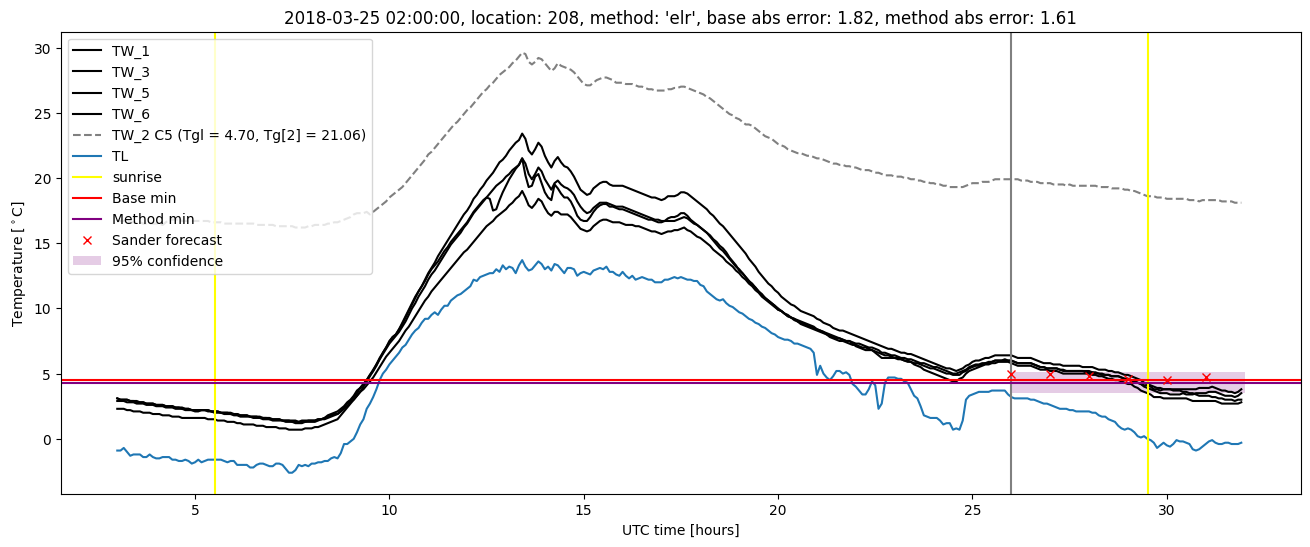
Extended logistic regression plots