GMS location: 207
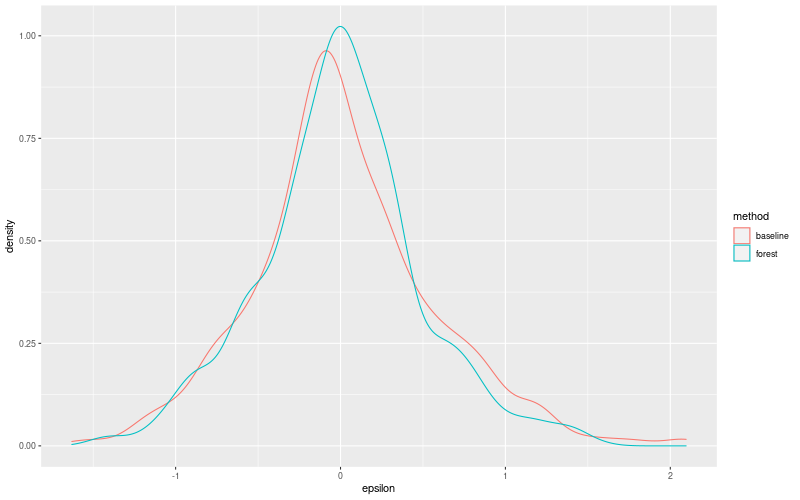
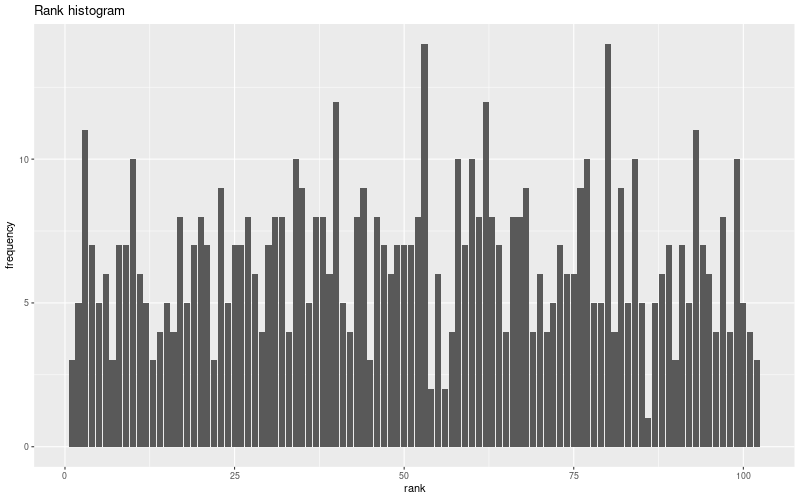
Random forest results
| names |
period |
power |
significance |
meanSquareError |
absError |
maxError |
CRPS |
IGN |
| baseline |
winter 2016 |
0.989 |
0.056 |
0.290 |
0.411 |
1.500 |
NaN |
NaN |
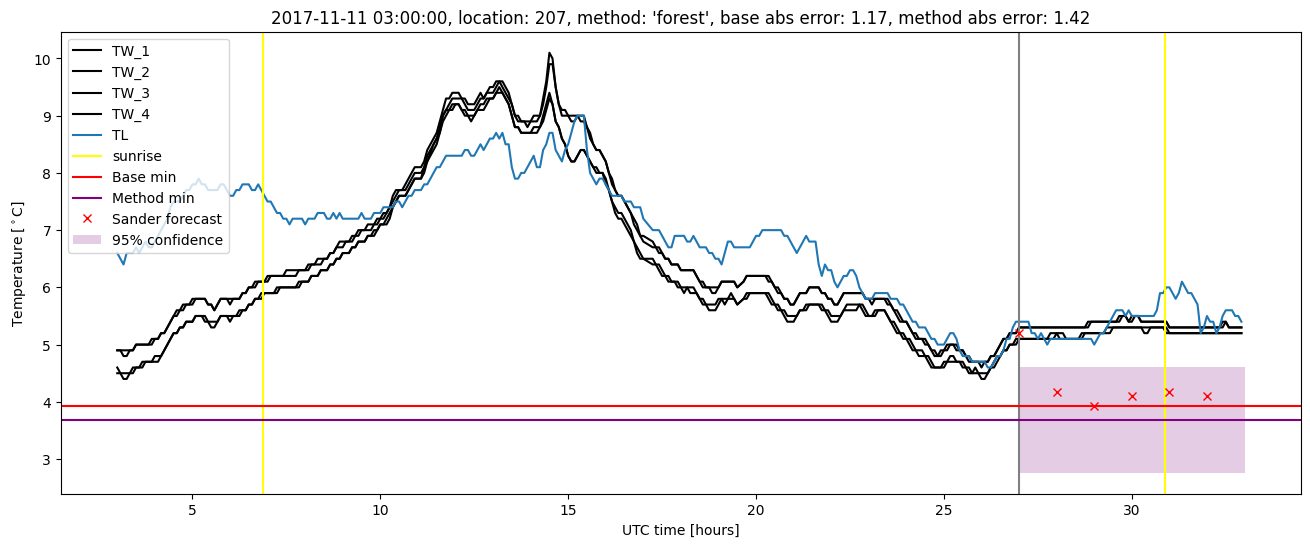
| forest |
winter 2016 |
1.000 |
0.111 |
0.242 |
0.376 |
1.417 |
0.469 |
6.080 |
| baseline |
winter 2017 |
0.965 |
0.029 |
0.387 |
0.463 |
2.096 |
NaN |
NaN |
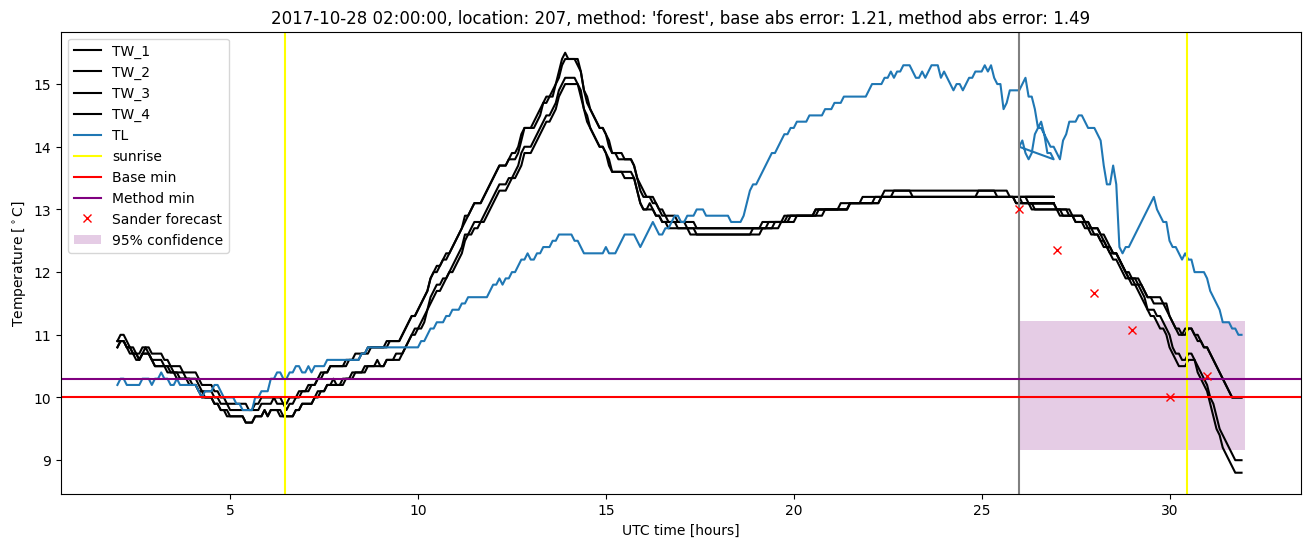
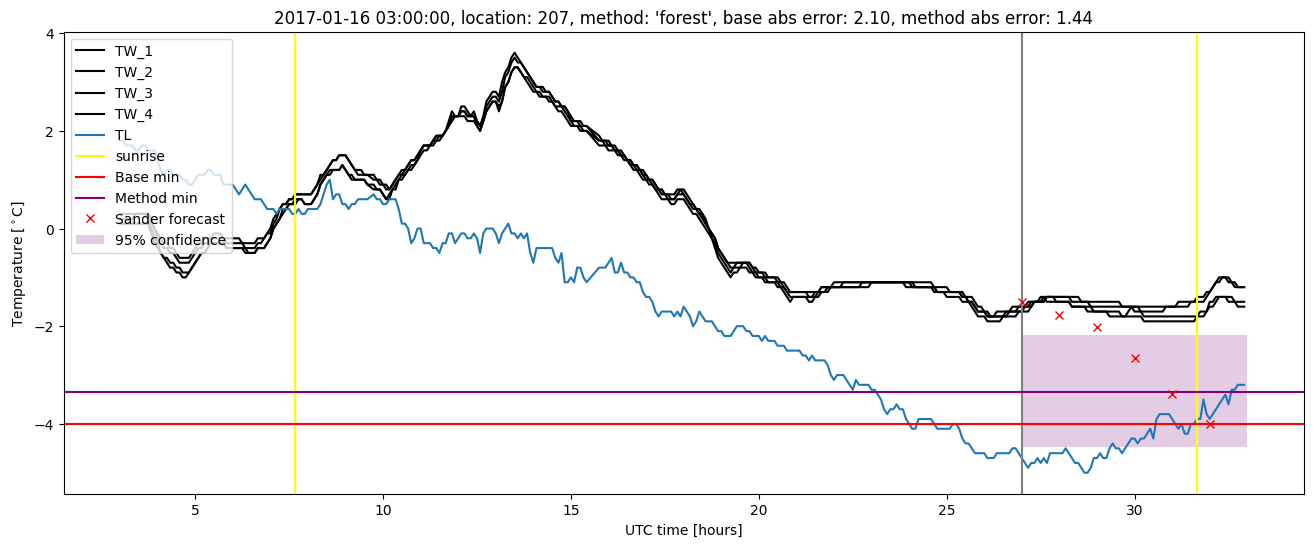
| forest |
winter 2017 |
0.974 |
0.029 |
0.285 |
0.405 |
1.557 |
0.478 |
6.041 |
| baseline |
winter 2018 |
0.992 |
0.120 |
0.297 |
0.417 |
1.629 |
NaN |
NaN |
| forest |
winter 2018 |
1.000 |
0.120 |
0.239 |
0.375 |
1.489 |
0.490 |
3.870 |
| baseline |
winter 2019 |
0.993 |
0.000e+00 |
0.264 |
0.376 |
1.821 |
NaN |
NaN |
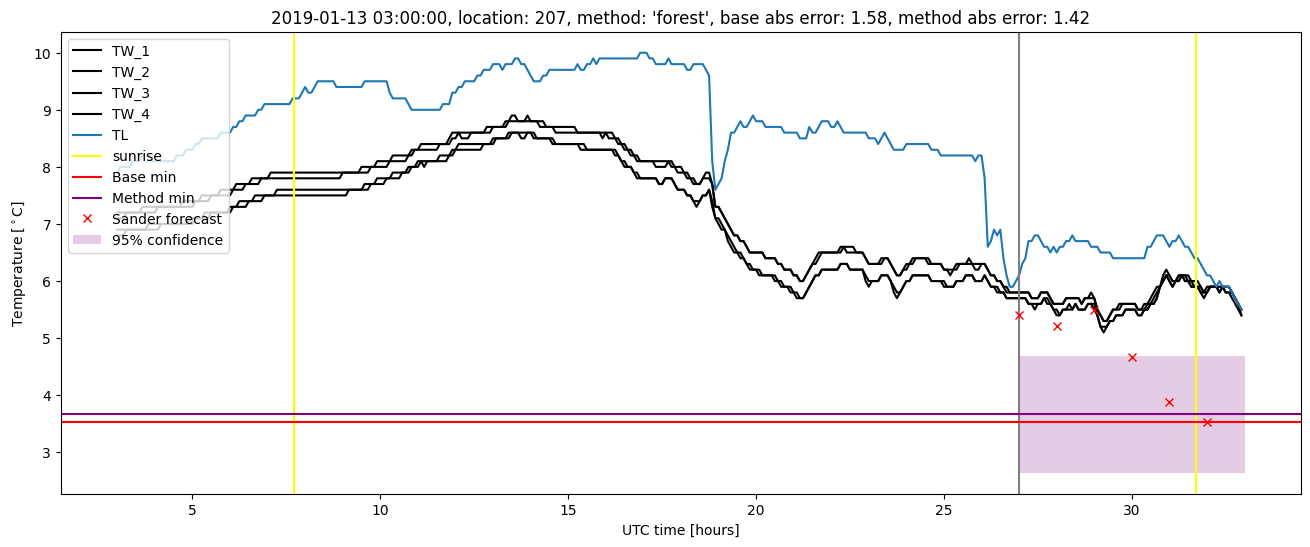
| forest |
winter 2019 |
0.993 |
0.071 |
0.189 |
0.314 |
1.422 |
0.486 |
3.927 |
| baseline |
all |
0.986 |
0.054 |
0.307 |
0.415 |
2.096 |
NaN |
NaN |
| forest |
all |
0.993 |
0.076 |
0.238 |
0.367 |
1.557 |
0.480 |
5.050 |
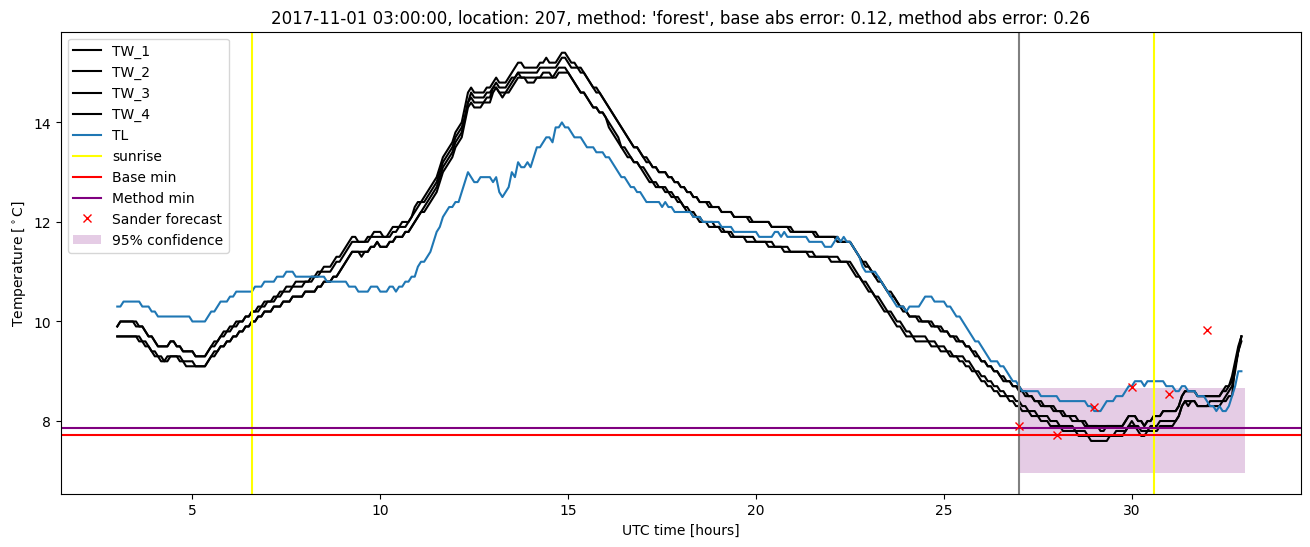
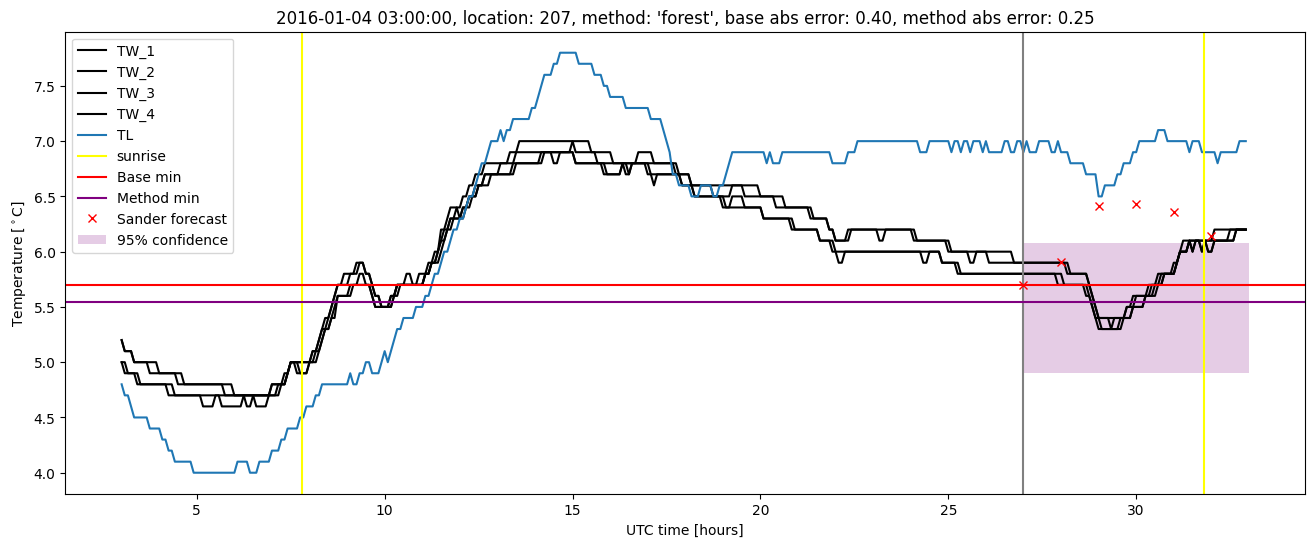
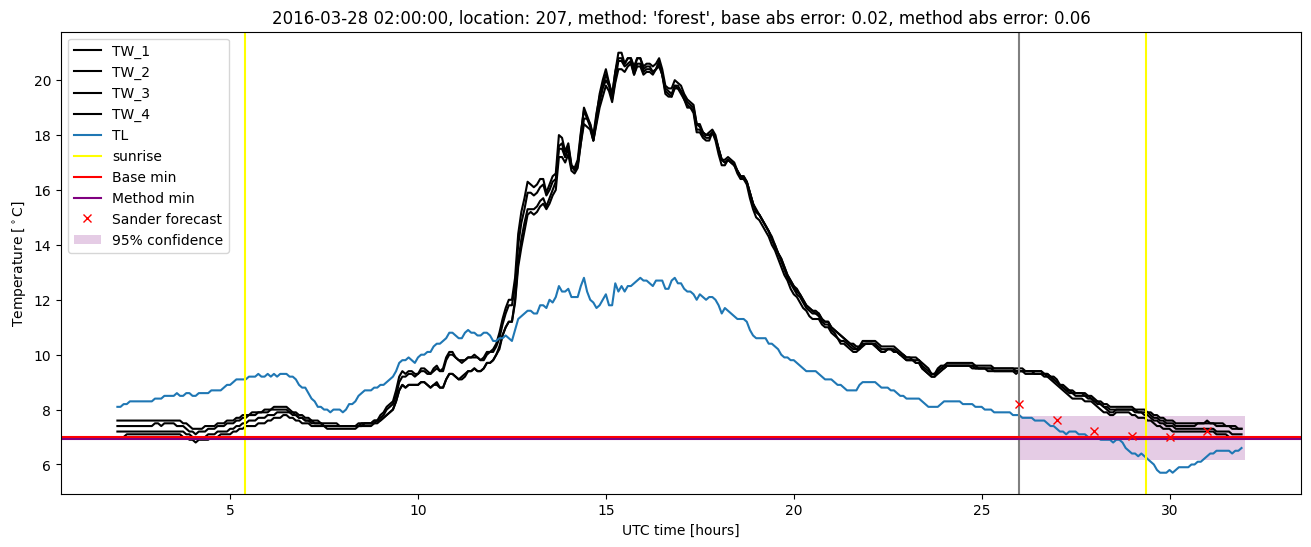
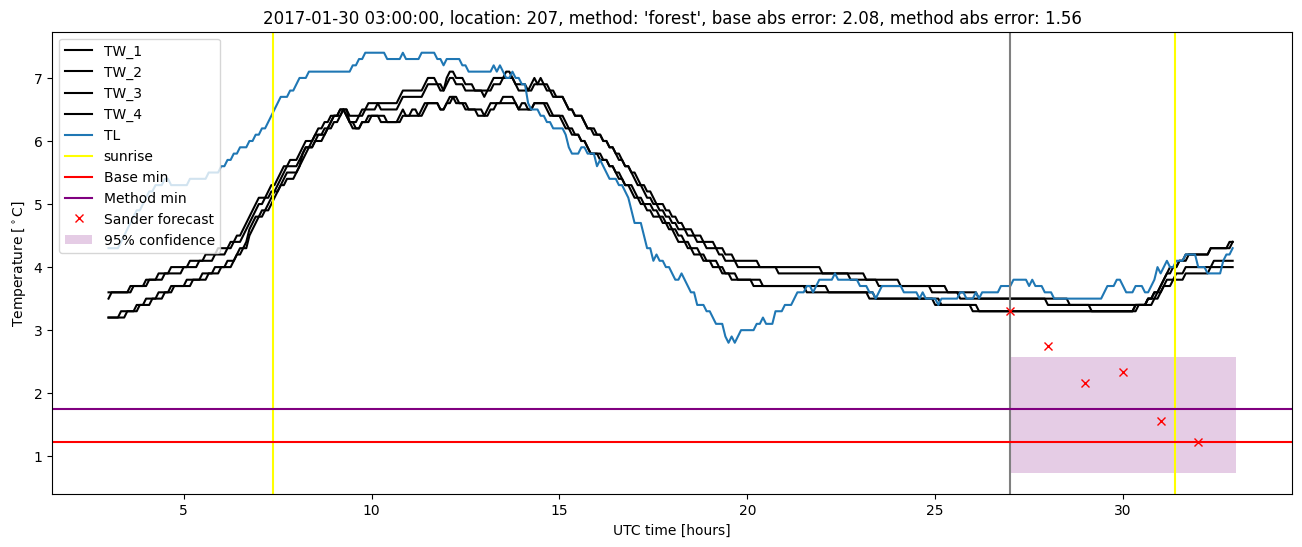
Random forest plots
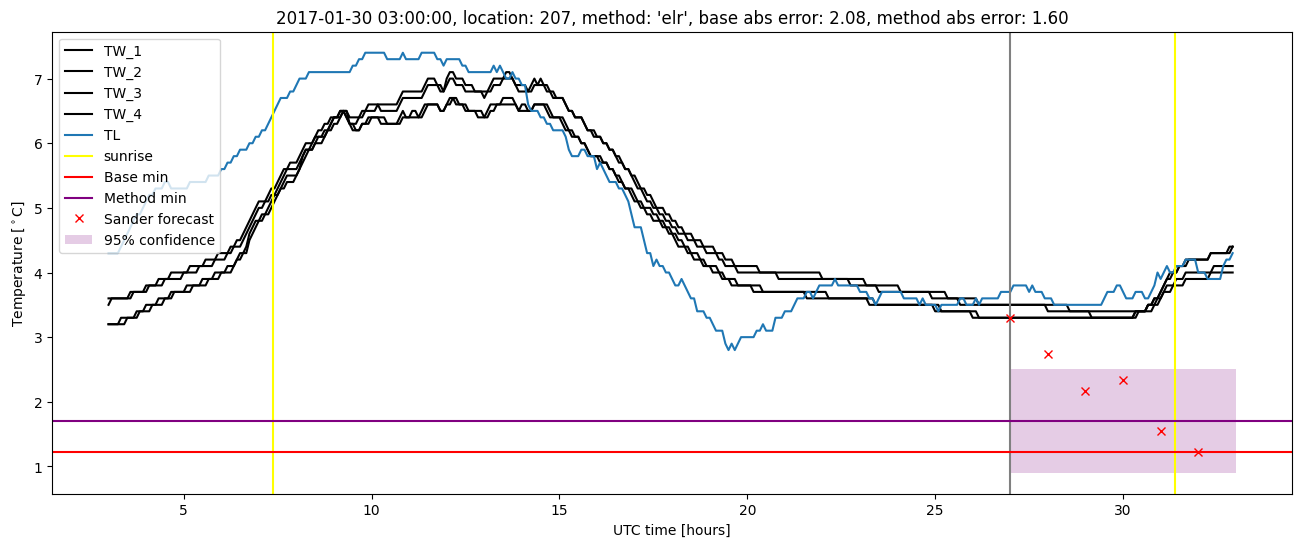
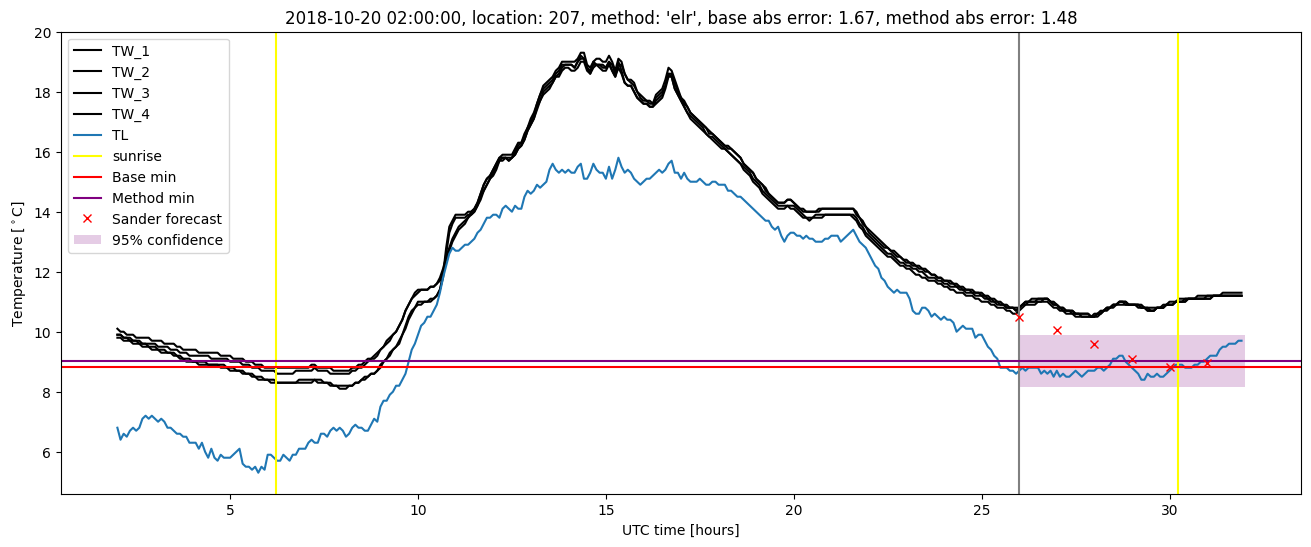
Extended logistic regression results
| names |
period |
power |
significance |
meanSquareError |
absError |
maxError |
CRPS |
IGN |
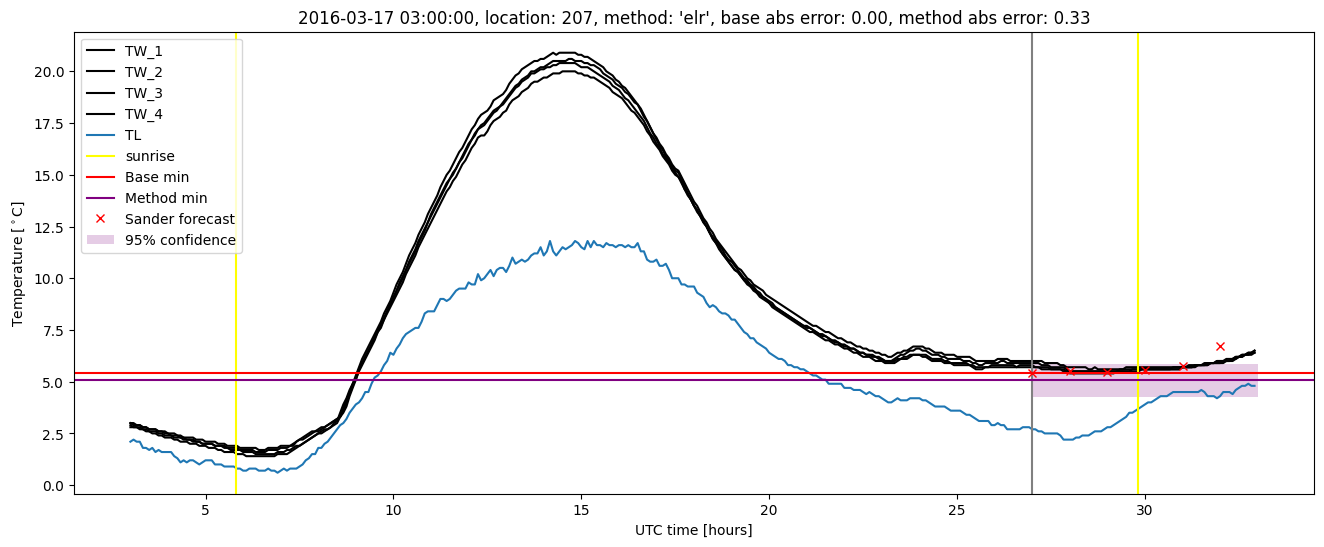
| baseline |
winter 2016 |
0.989 |
0.056 |
0.290 |
0.411 |
1.500 |
NaN |
NaN |
| elr |
winter 2016 |
0.989 |
0.111 |
0.256 |
0.396 |
1.371 |
0.550 |
6.458 |
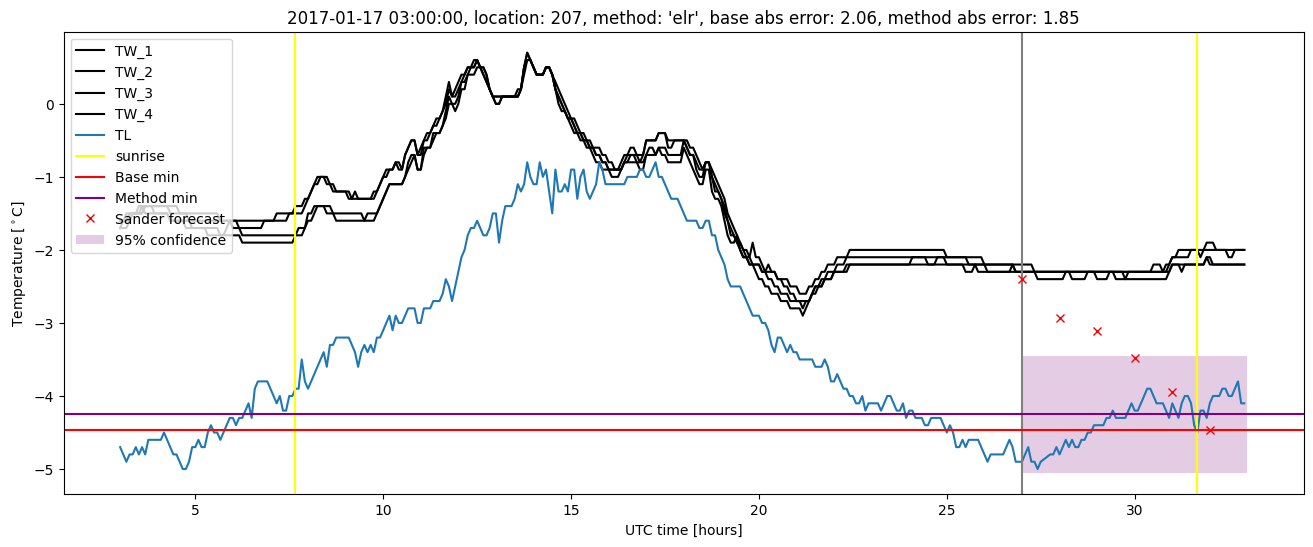
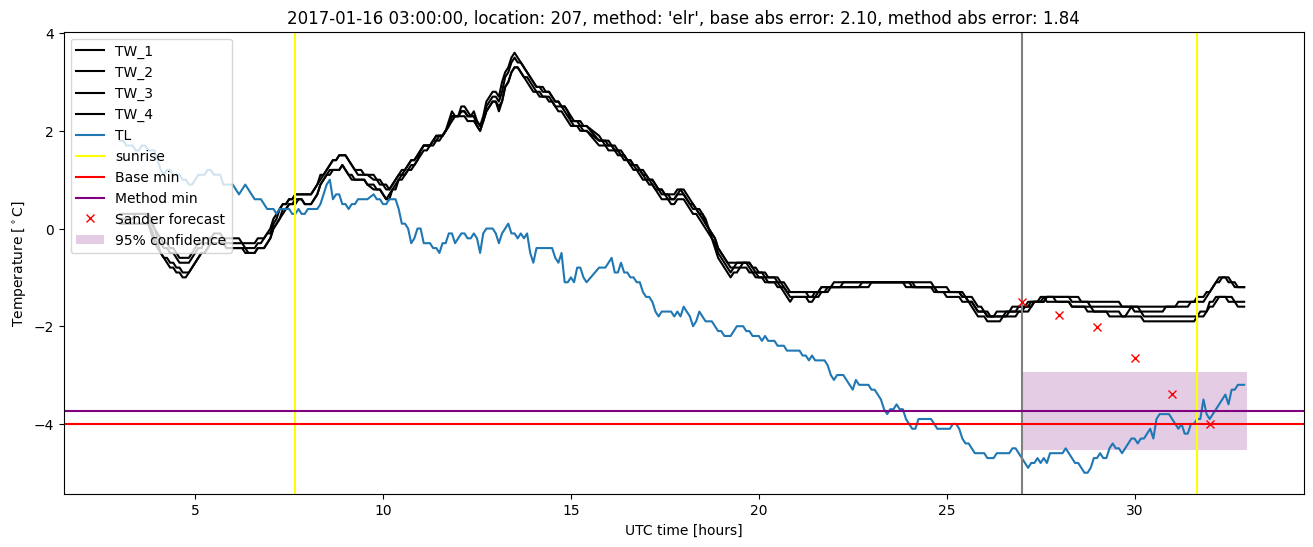
| baseline |
winter 2017 |
0.965 |
0.029 |
0.387 |
0.463 |
2.096 |
NaN |
NaN |
| elr |
winter 2017 |
0.974 |
0.029 |
0.301 |
0.416 |
1.850 |
0.520 |
5.573 |
| baseline |
winter 2018 |
0.992 |
0.120 |
0.297 |
0.417 |
1.629 |
NaN |
NaN |
| elr |
winter 2018 |
1.000 |
0.080 |
0.249 |
0.395 |
1.629 |
0.545 |
6.058 |
| baseline |
winter 2019 |
0.993 |
0.000e+00 |
0.264 |
0.376 |
1.821 |
NaN |
NaN |
| elr |
winter 2019 |
0.993 |
0.000e+00 |
0.203 |
0.330 |
1.479 |
0.520 |
4.456 |
| baseline |
all |
0.986 |
0.054 |
0.307 |
0.415 |
2.096 |
NaN |
NaN |
| elr |
all |
0.990 |
0.054 |
0.252 |
0.384 |
1.850 |
0.535 |
5.678 |
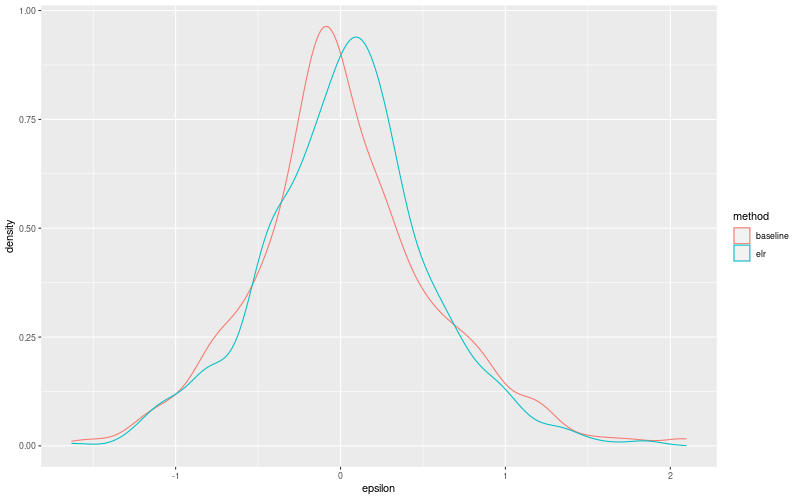
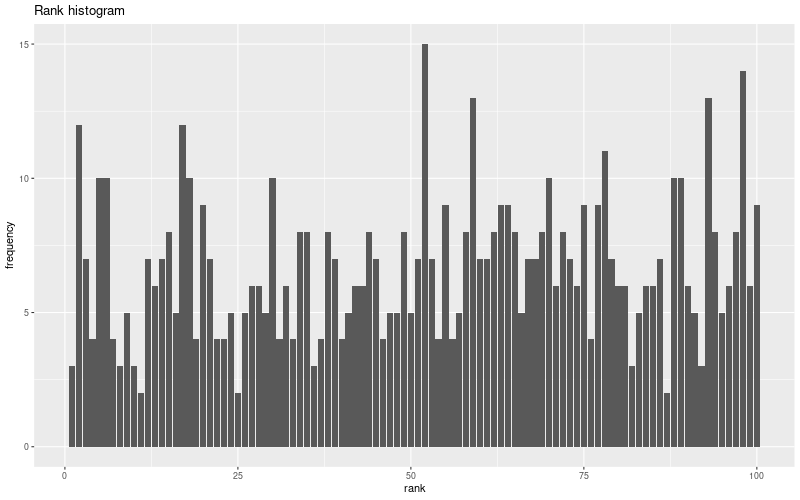
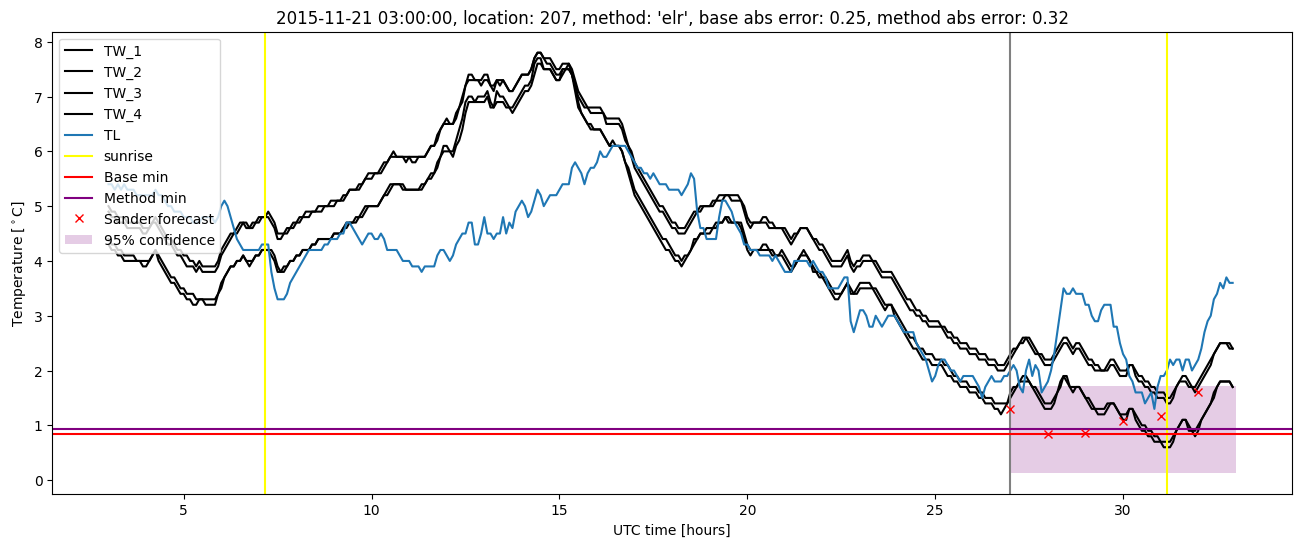
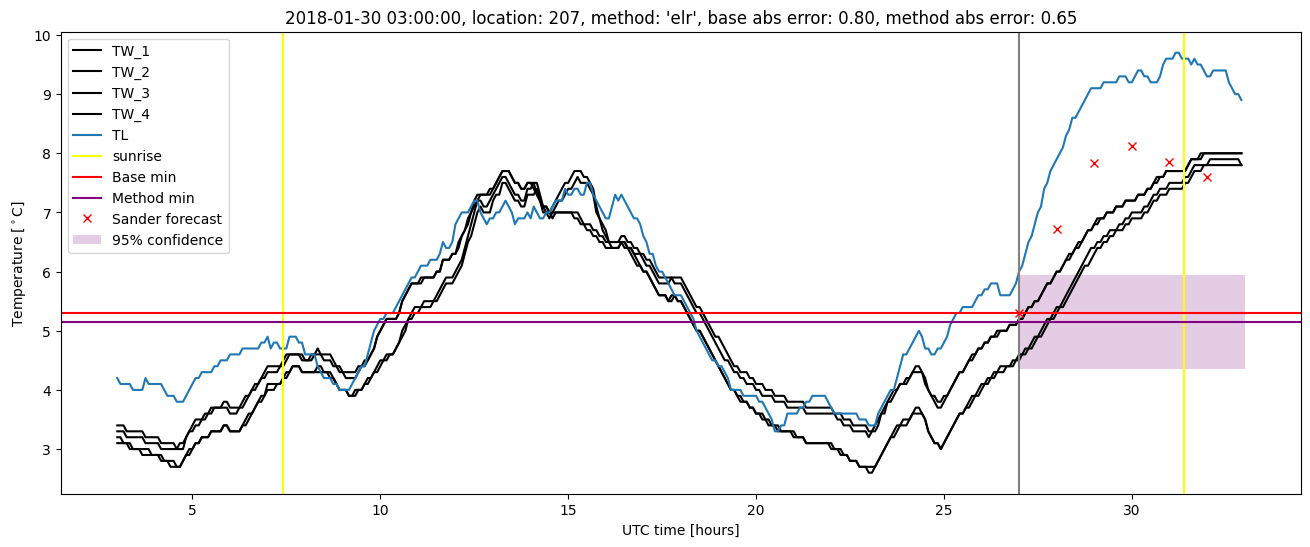
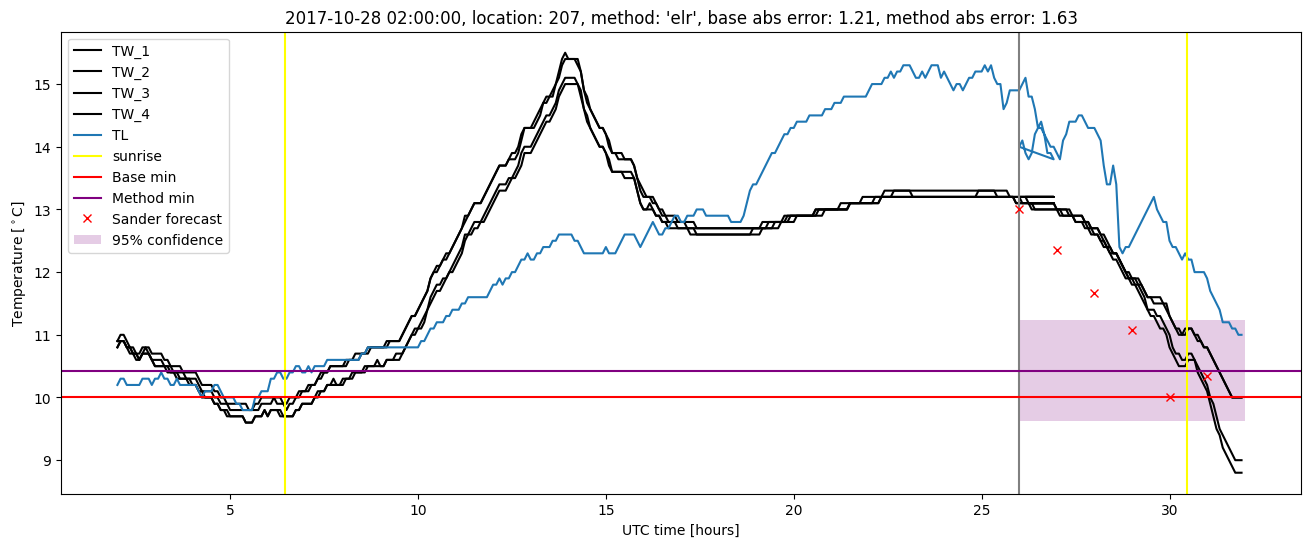
Extended logistic regression plots