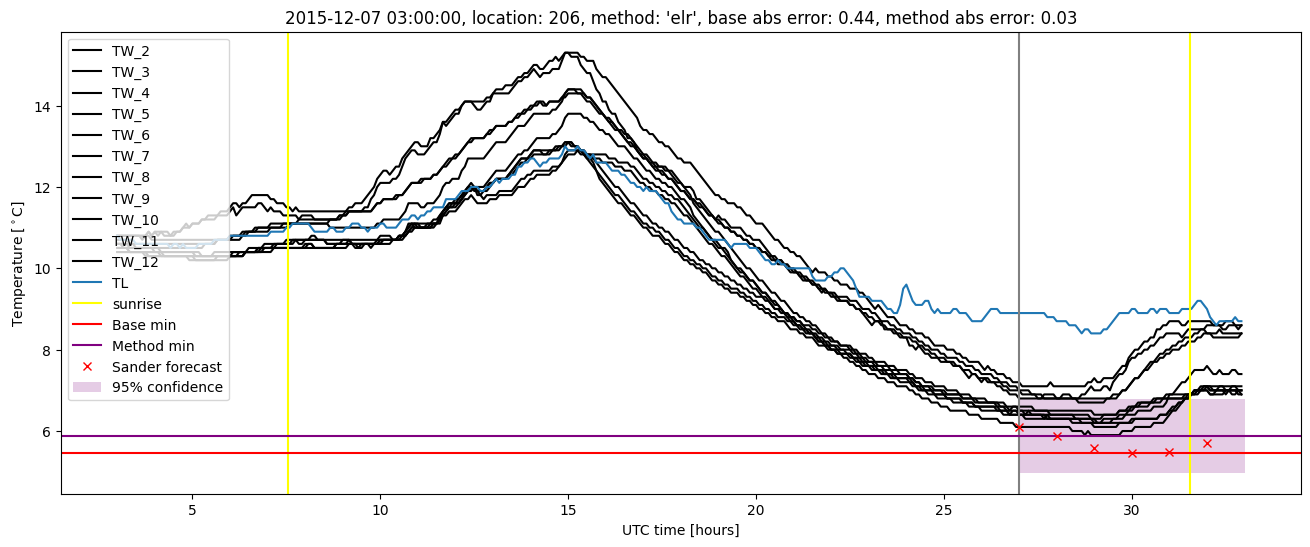
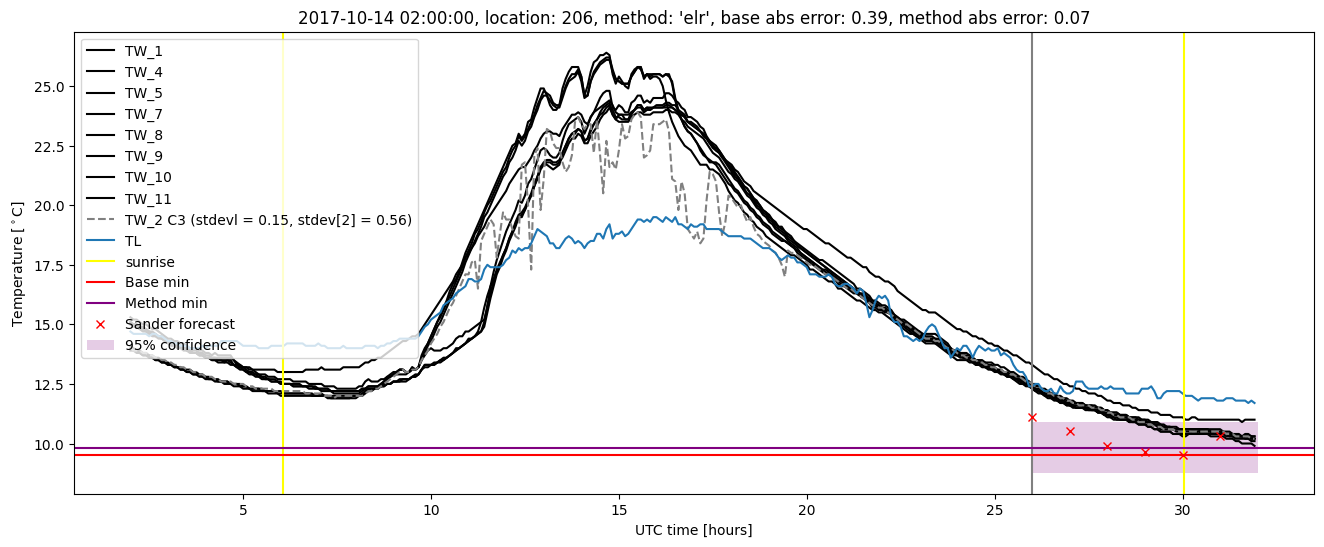
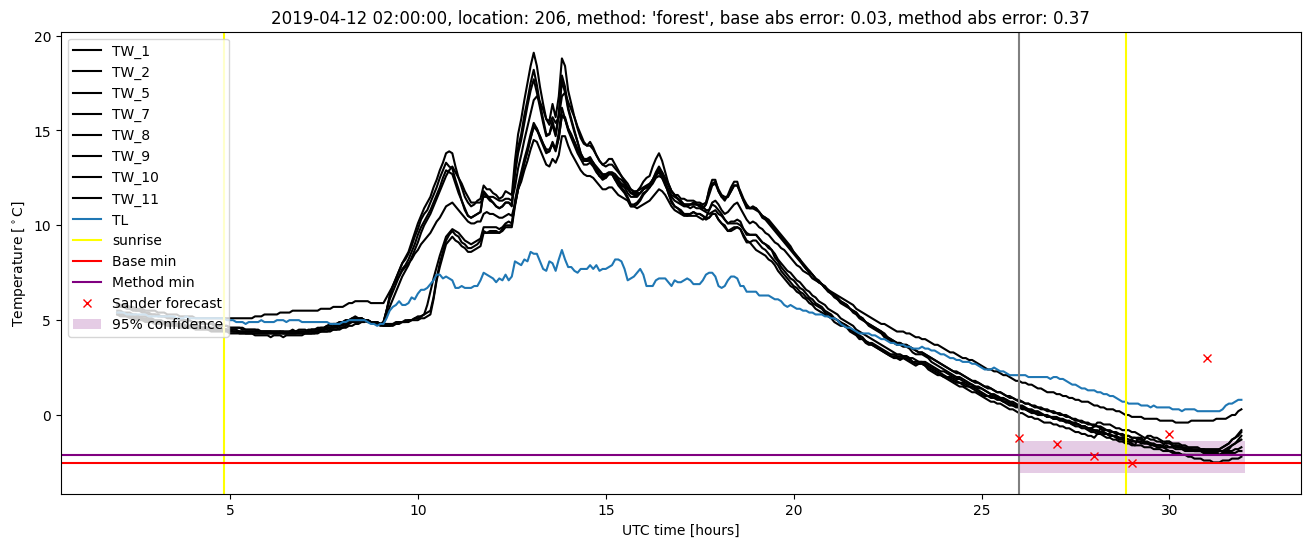
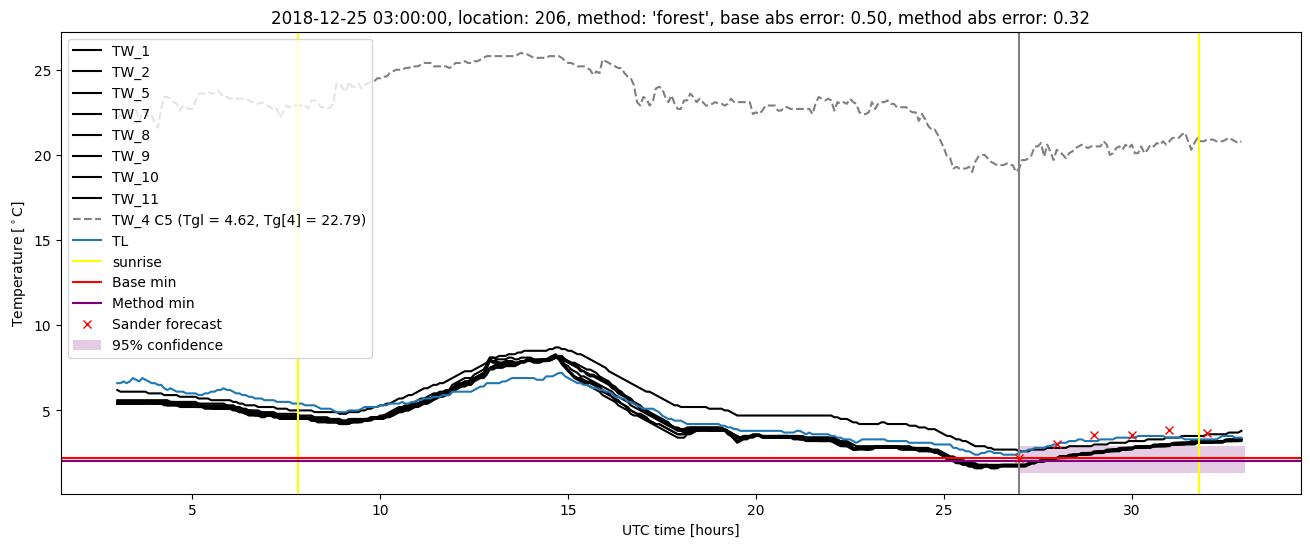
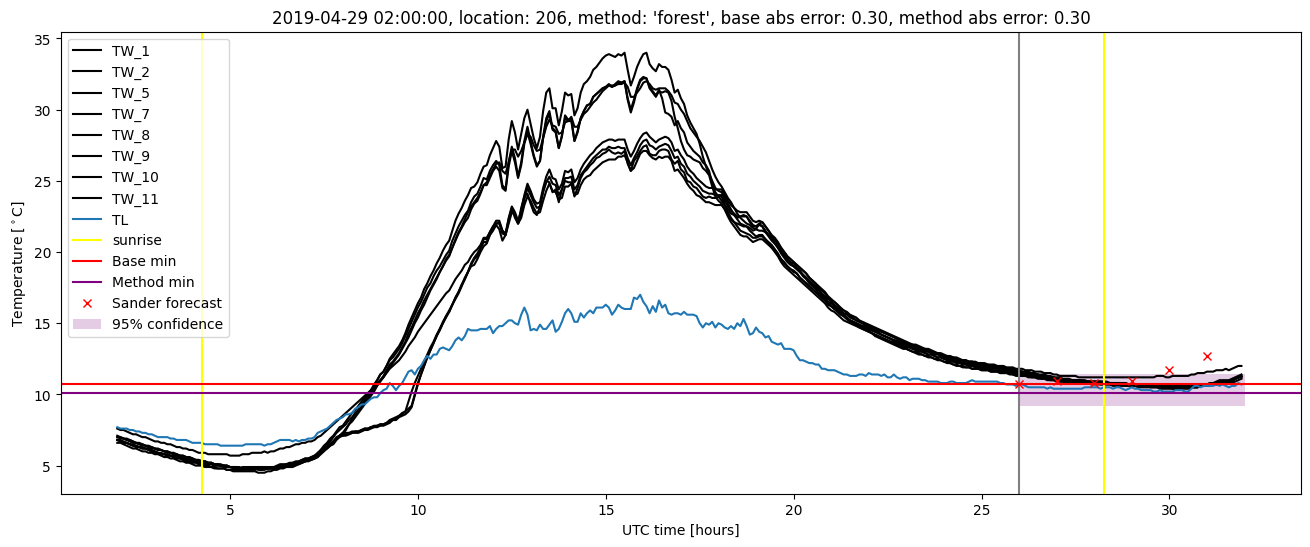
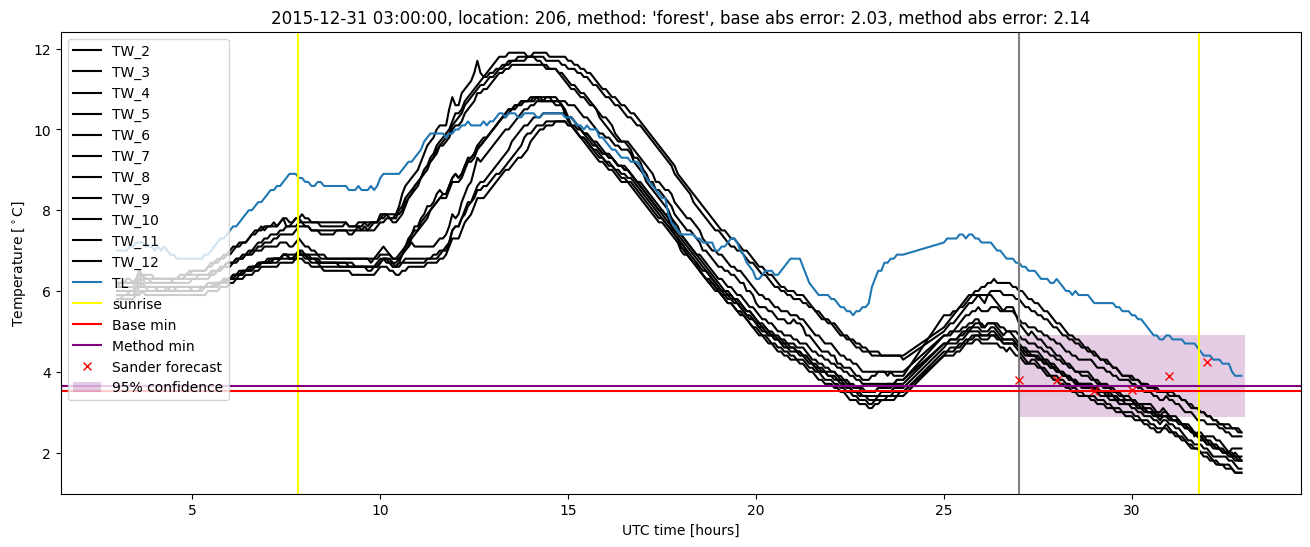
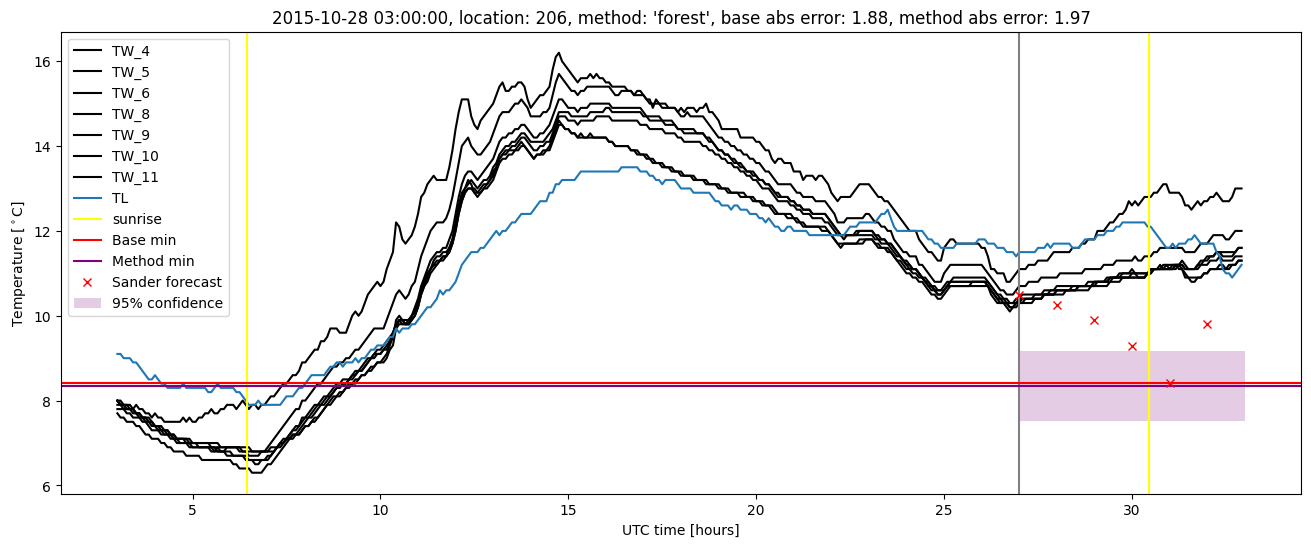
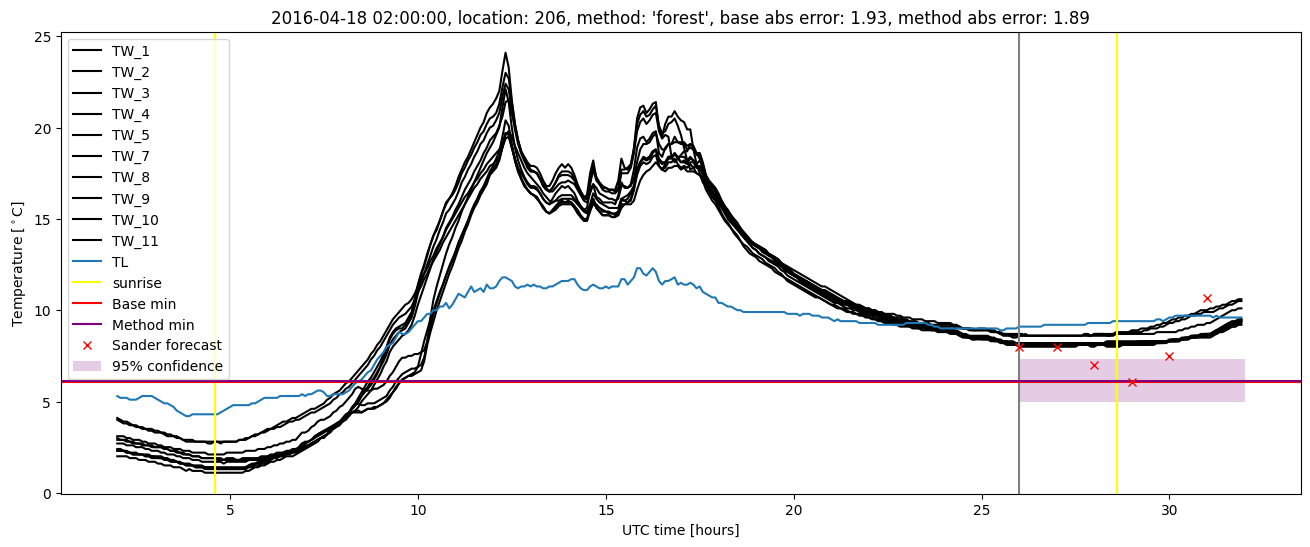
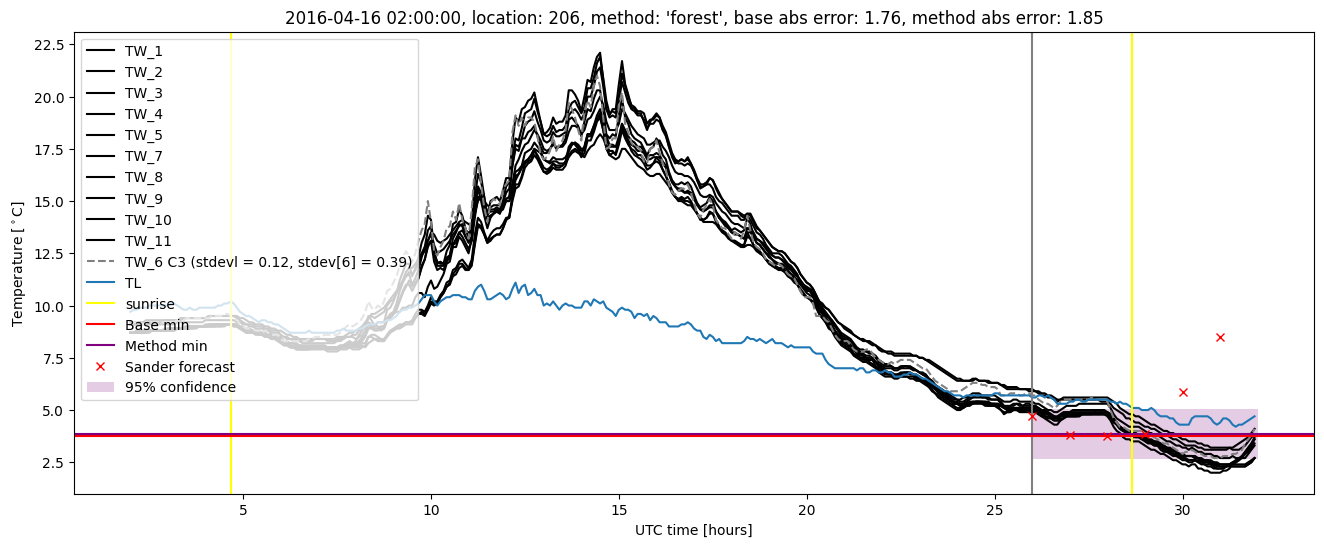
GMS location: 206
Random forest results
| names |
period |
power |
significance |
meanSquareError |
absError |
maxError |
CRPS |
IGN |
| baseline |
winter 2016 |
0.988 |
0.156 |
0.589 |
0.579 |
2.385 |
NaN |
NaN |
| forest |
winter 2016 |
0.988 |
0.156 |
0.460 |
0.502 |
2.141 |
0.474 |
4.194 |
| baseline |
winter 2017 |
0.964 |
0.071 |
0.532 |
0.533 |
2.367 |
NaN |
NaN |
| forest |
winter 2017 |
0.973 |
0.071 |
0.349 |
0.441 |
1.791 |
0.469 |
3.372 |
| baseline |
winter 2018 |
0.993 |
0.100 |
0.351 |
0.440 |
2.003 |
NaN |
NaN |
| forest |
winter 2018 |
0.993 |
0.100 |
0.293 |
0.416 |
1.701 |
0.463 |
2.437 |
| baseline |
winter 2019 |
0.979 |
0.160 |
0.374 |
0.465 |
1.837 |
NaN |
NaN |
| forest |
winter 2019 |
0.990 |
0.200 |
0.282 |
0.399 |
1.579 |
0.467 |
2.817 |
| baseline |
all |
0.983 |
0.115 |
0.471 |
0.509 |
2.385 |
NaN |
NaN |
| forest |
all |
0.987 |
0.122 |
0.356 |
0.445 |
2.141 |
0.469 |
3.269 |
Random forest plots

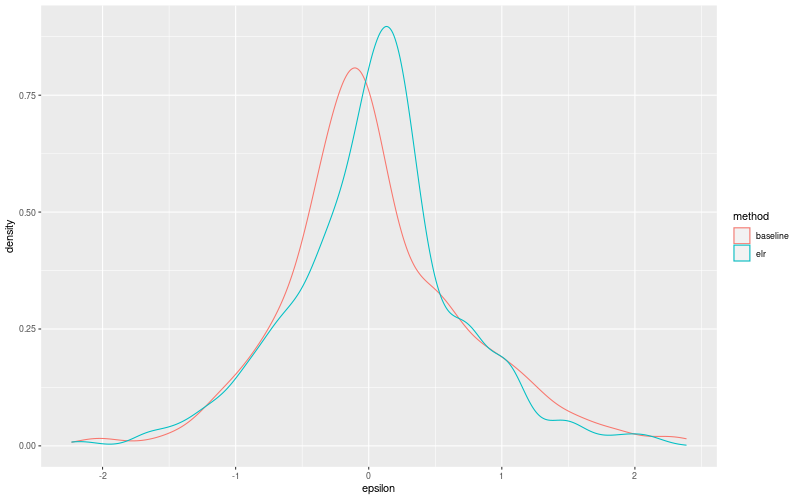
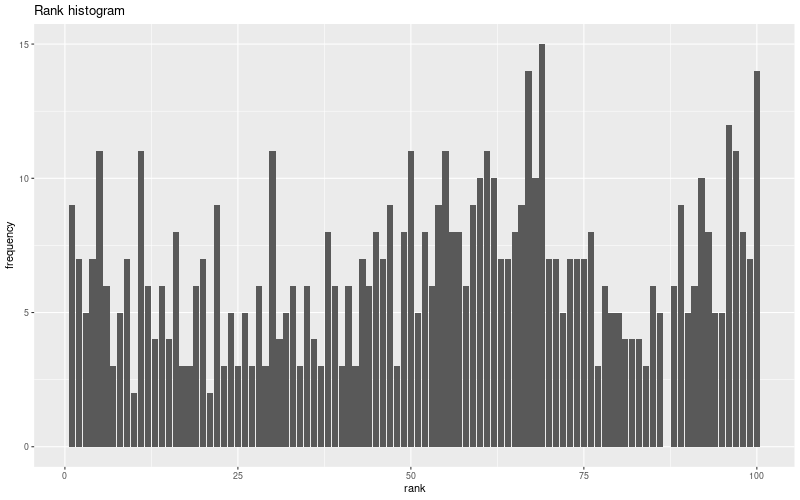
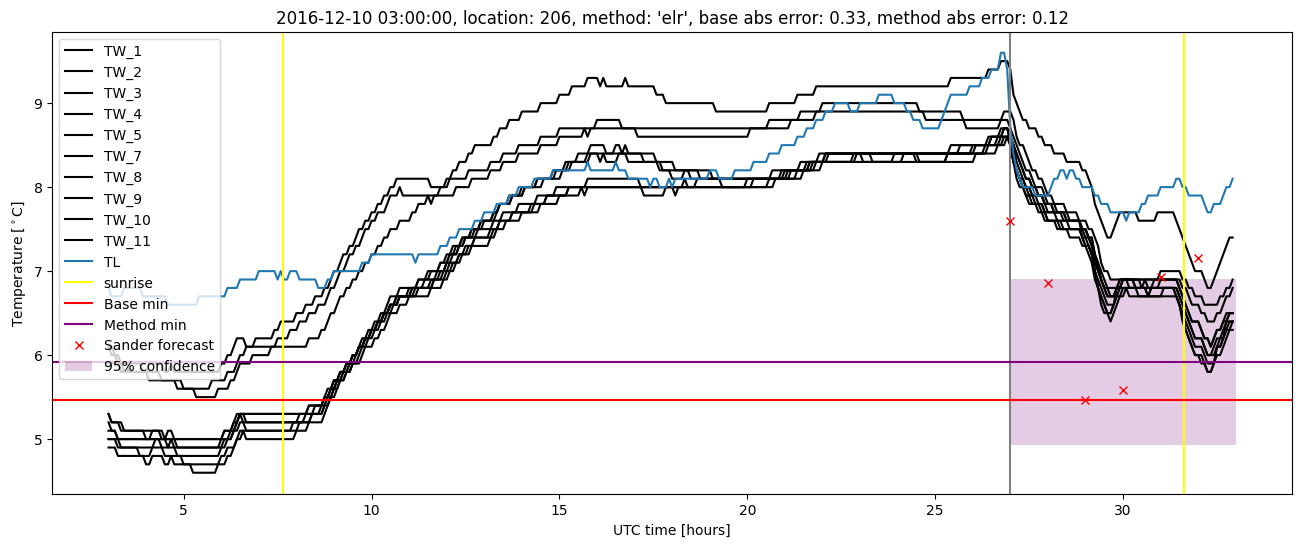
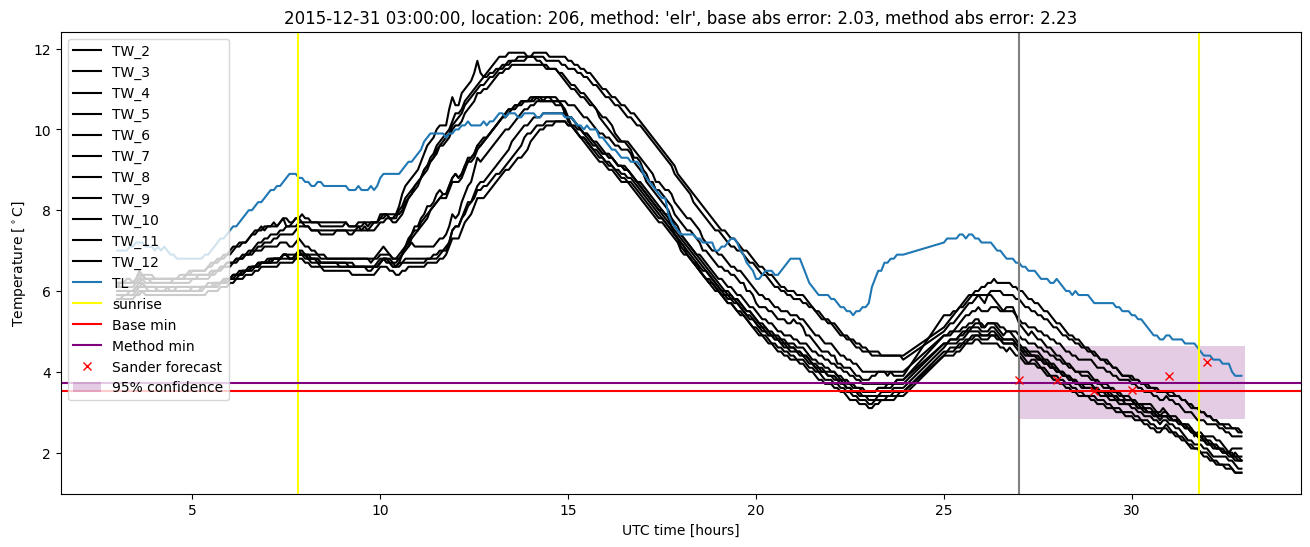
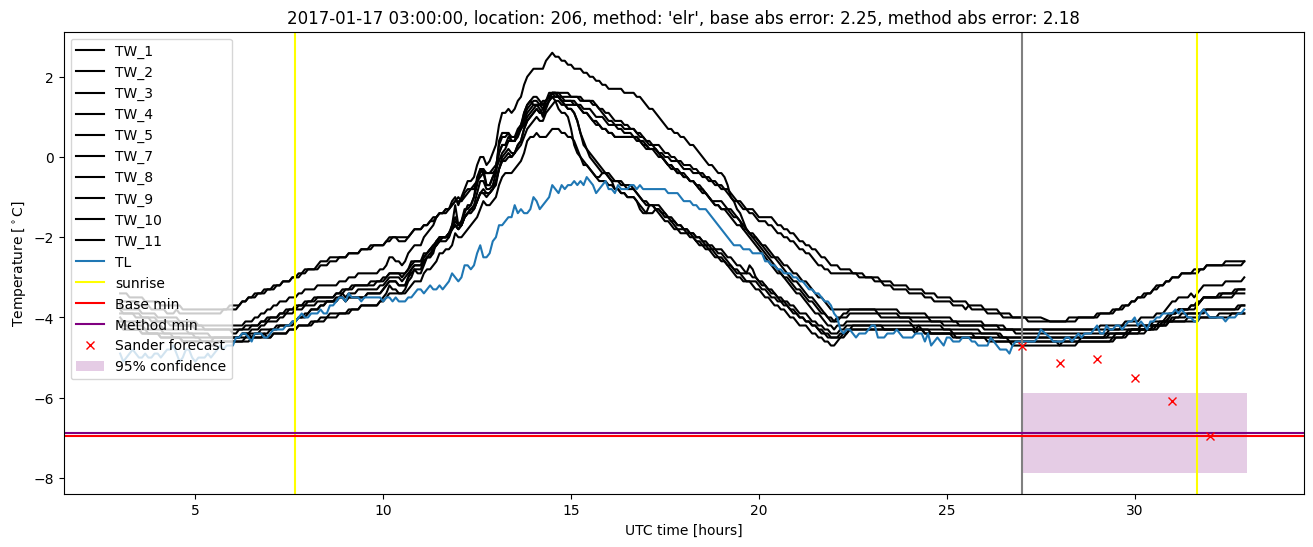
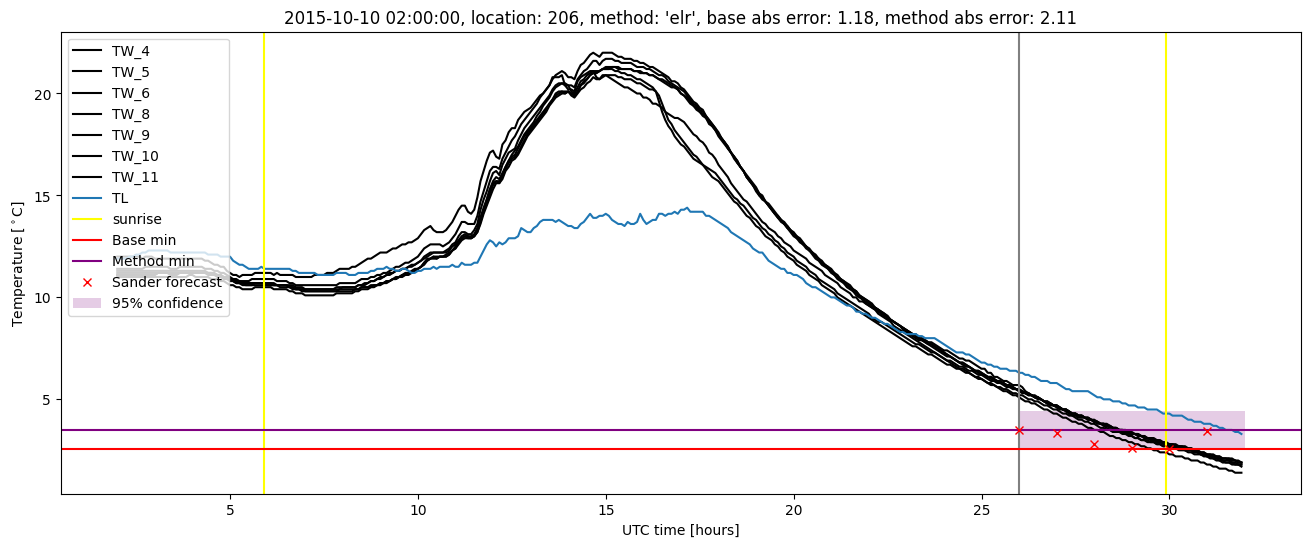
Extended logistic regression results
| names |
period |
power |
significance |
meanSquareError |
absError |
maxError |
CRPS |
IGN |
| baseline |
winter 2016 |
0.988 |
0.156 |
0.589 |
0.579 |
2.385 |
NaN |
NaN |
| elr |
winter 2016 |
0.983 |
0.125 |
0.555 |
0.568 |
2.231 |
0.568 |
4.345 |
| baseline |
winter 2017 |
0.964 |
0.071 |
0.532 |
0.533 |
2.367 |
NaN |
NaN |
| elr |
winter 2017 |
0.964 |
0.071 |
0.394 |
0.455 |
2.181 |
0.502 |
2.566 |
| baseline |
winter 2018 |
0.993 |
0.100 |
0.351 |
0.440 |
2.003 |
NaN |
NaN |
| elr |
winter 2018 |
0.993 |
0.075 |
0.300 |
0.421 |
1.748 |
0.549 |
2.460 |
| baseline |
winter 2019 |
0.979 |
0.160 |
0.374 |
0.465 |
1.837 |
NaN |
NaN |
| elr |
winter 2019 |
1.000 |
0.200 |
0.309 |
0.403 |
1.692 |
0.517 |
2.369 |
| baseline |
all |
0.983 |
0.115 |
0.471 |
0.509 |
2.385 |
NaN |
NaN |
| elr |
all |
0.985 |
0.108 |
0.402 |
0.471 |
2.231 |
0.538 |
3.051 |
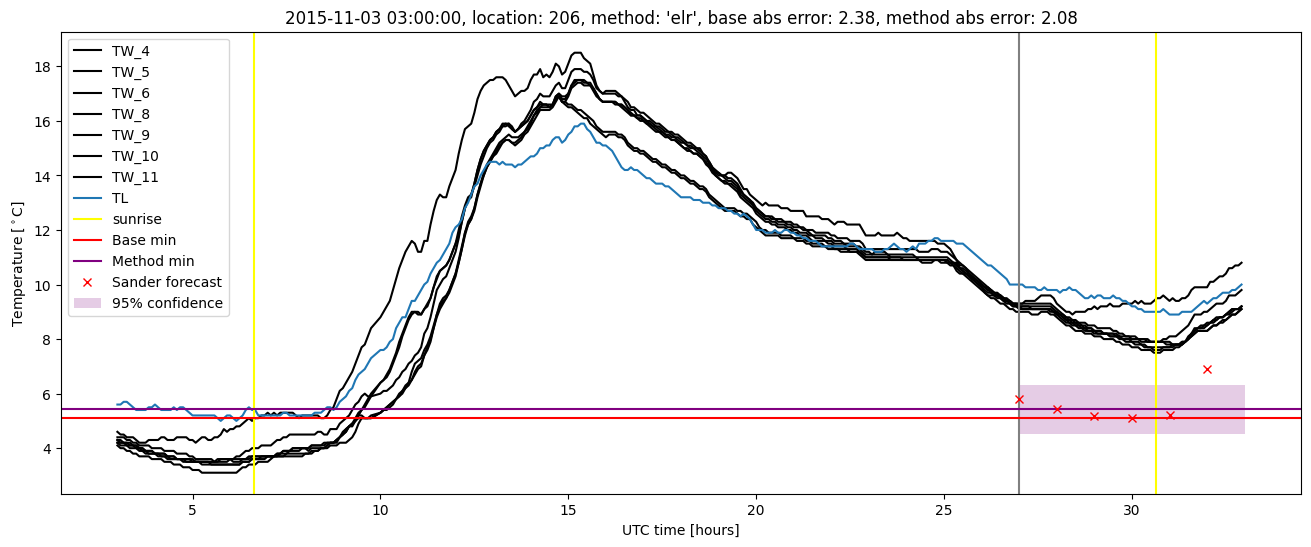
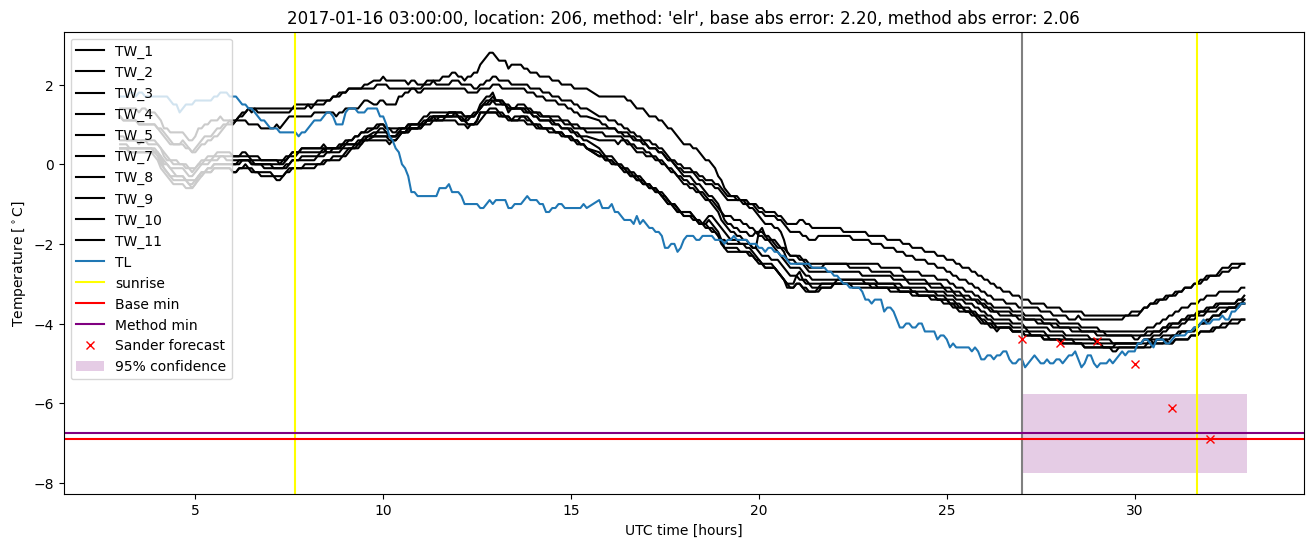
Extended logistic regression plots