GMS location: 205
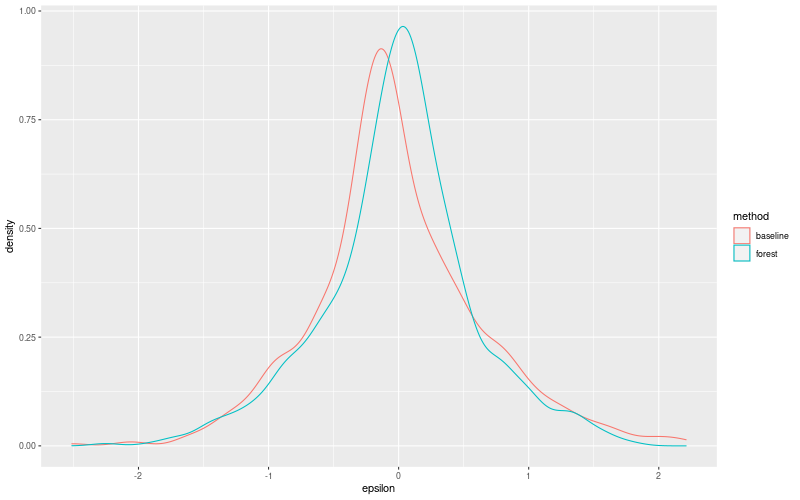
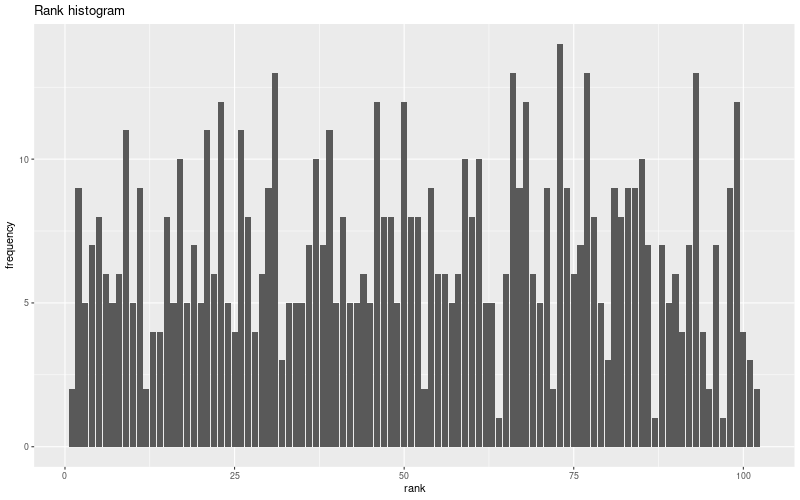
Random forest results
| names |
period |
power |
significance |
meanSquareError |
absError |
maxError |
CRPS |
IGN |
| baseline |
winter 2016 |
0.978 |
0.038 |
0.443 |
0.512 |
2.046 |
NaN |
NaN |
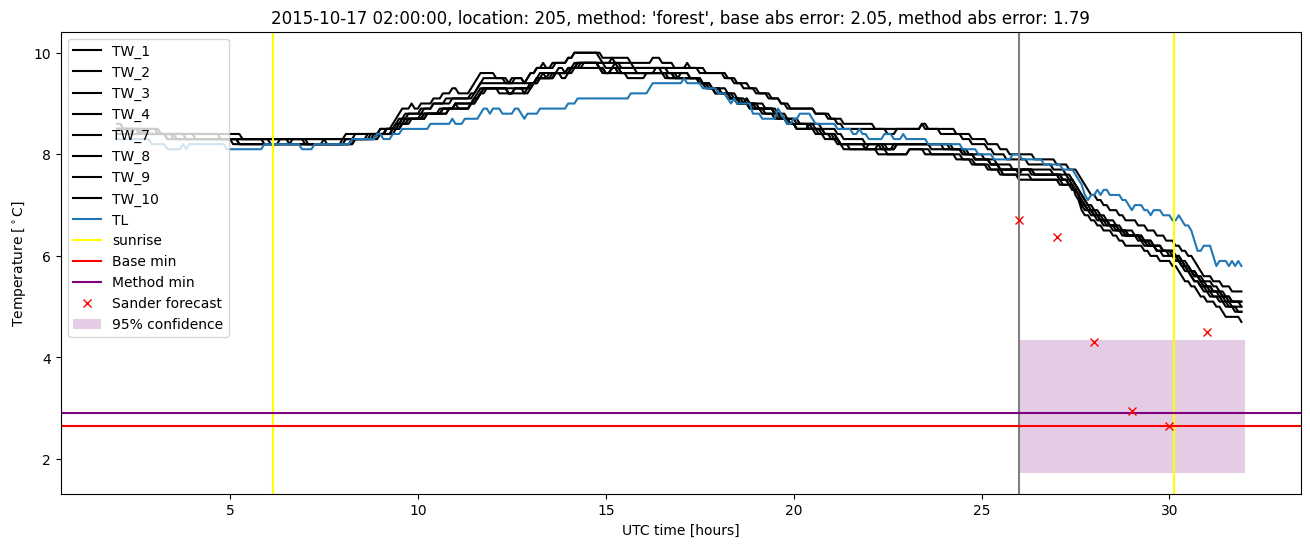
| forest |
winter 2016 |
0.989 |
0.077 |
0.366 |
0.443 |
1.793 |
0.477 |
4.276 |
| baseline |
winter 2017 |
0.957 |
0.053 |
0.480 |
0.506 |
2.210 |
NaN |
NaN |
| forest |
winter 2017 |
0.957 |
0.026 |
0.361 |
0.452 |
1.893 |
0.478 |
4.794 |
| baseline |
winter 2018 |
0.986 |
0.108 |
0.350 |
0.437 |
1.689 |
NaN |
NaN |
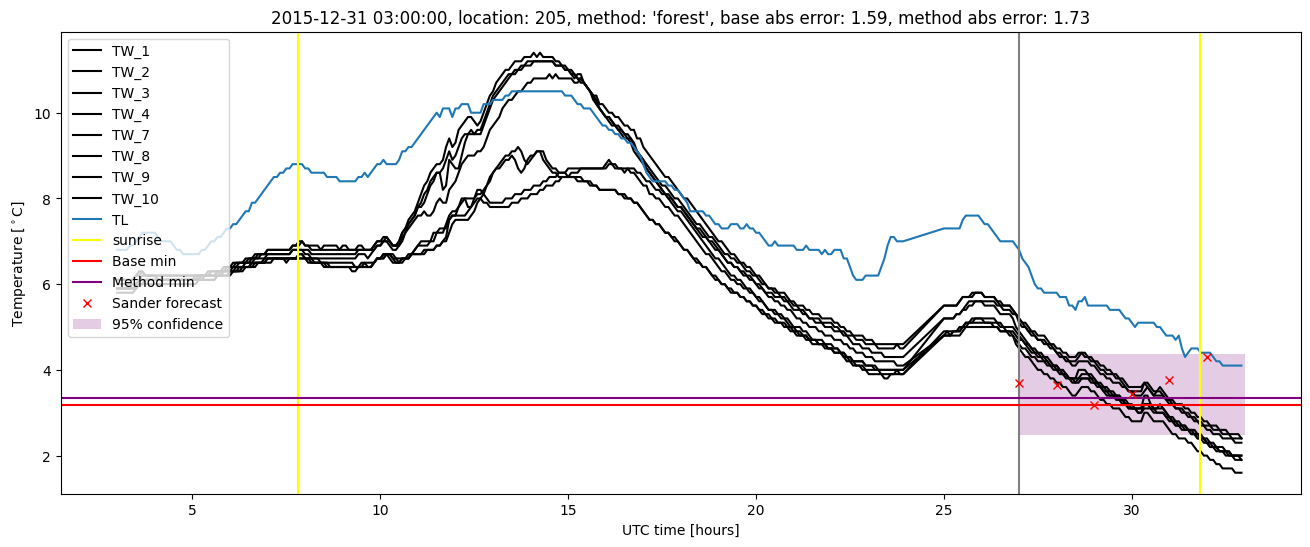
| forest |
winter 2018 |
0.993 |
0.081 |
0.298 |
0.406 |
1.561 |
0.502 |
3.300 |
| baseline |
winter 2019 |
0.993 |
0.000e+00 |
0.405 |
0.465 |
2.512 |
NaN |
NaN |
| forest |
winter 2019 |
0.993 |
0.000e+00 |
0.327 |
0.408 |
2.253 |
0.481 |
3.432 |
| baseline |
all |
0.979 |
0.059 |
0.418 |
0.481 |
2.512 |
NaN |
NaN |
| forest |
all |
0.985 |
0.051 |
0.338 |
0.427 |
2.253 |
0.485 |
3.943 |
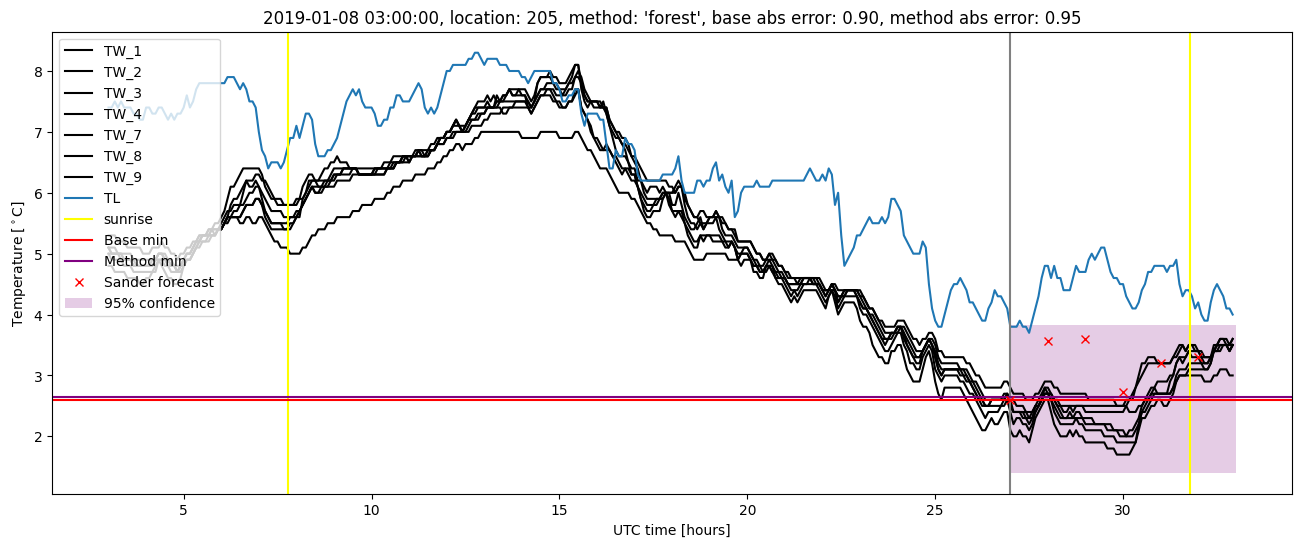
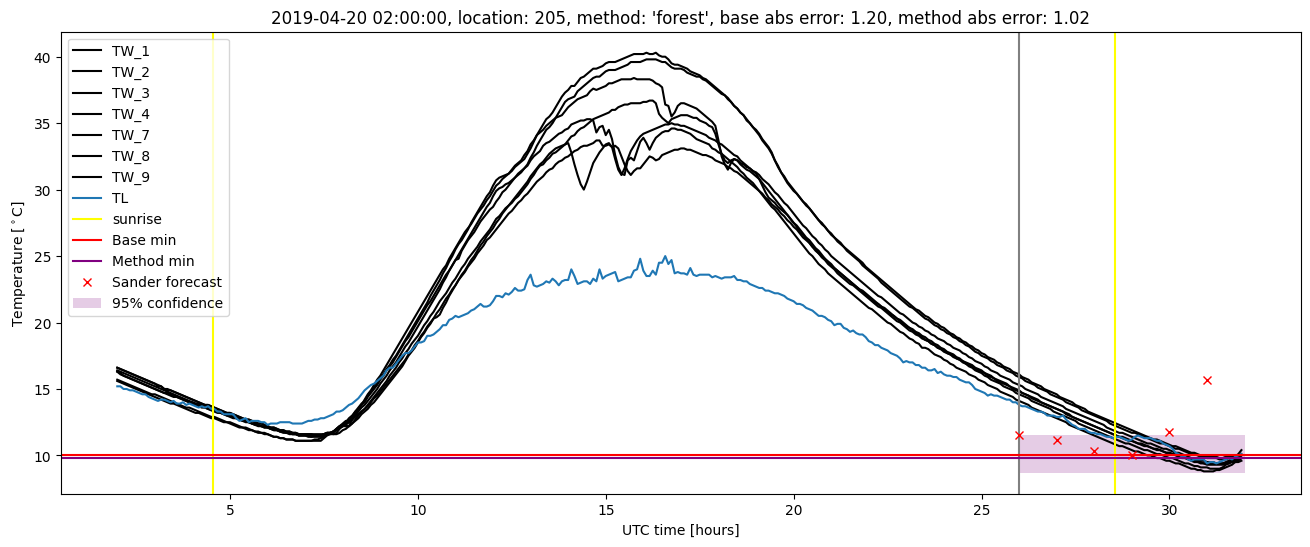
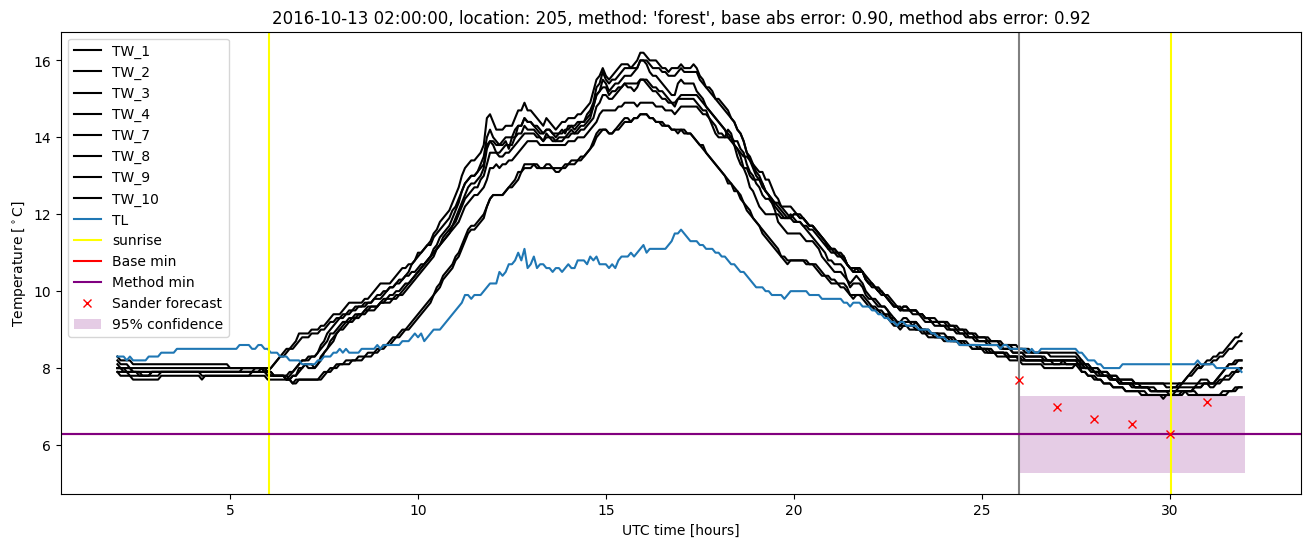
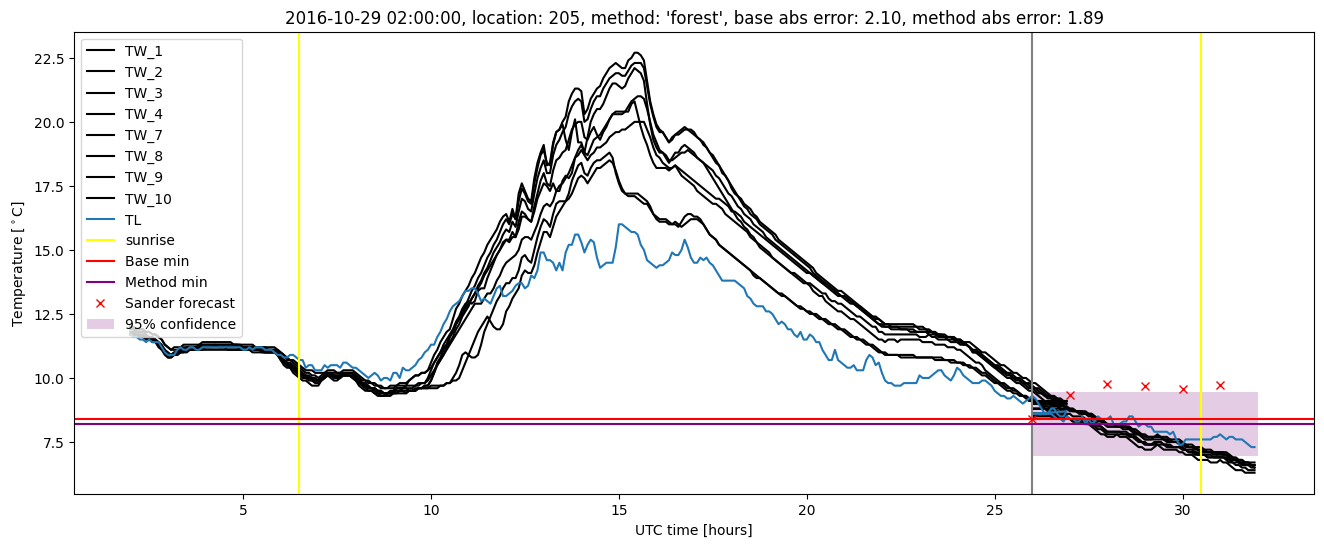
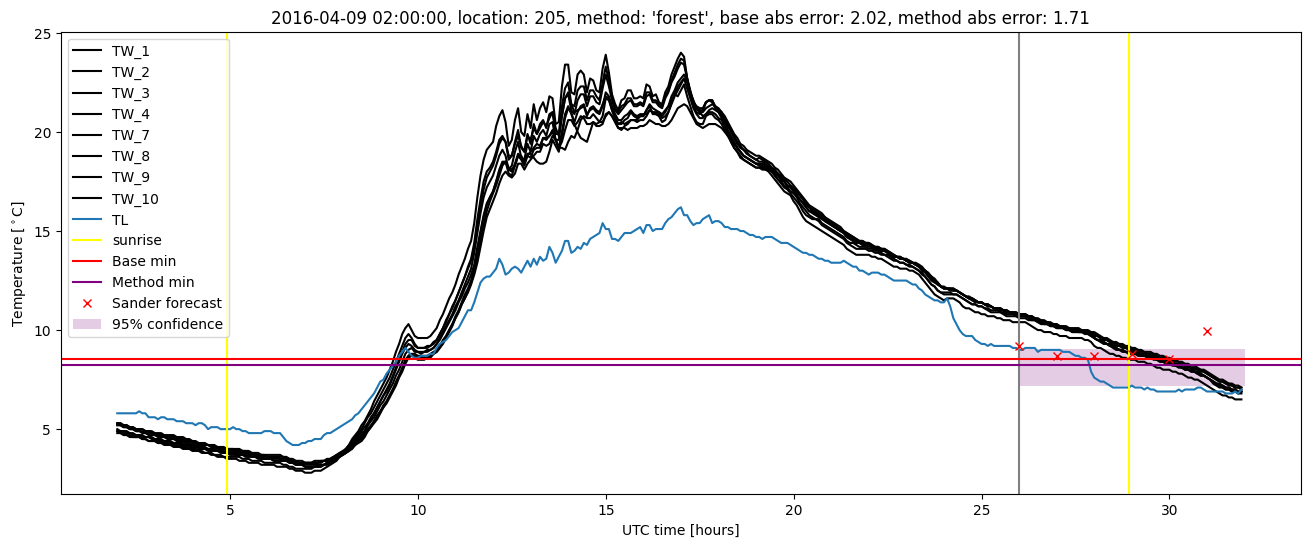
Random forest plots

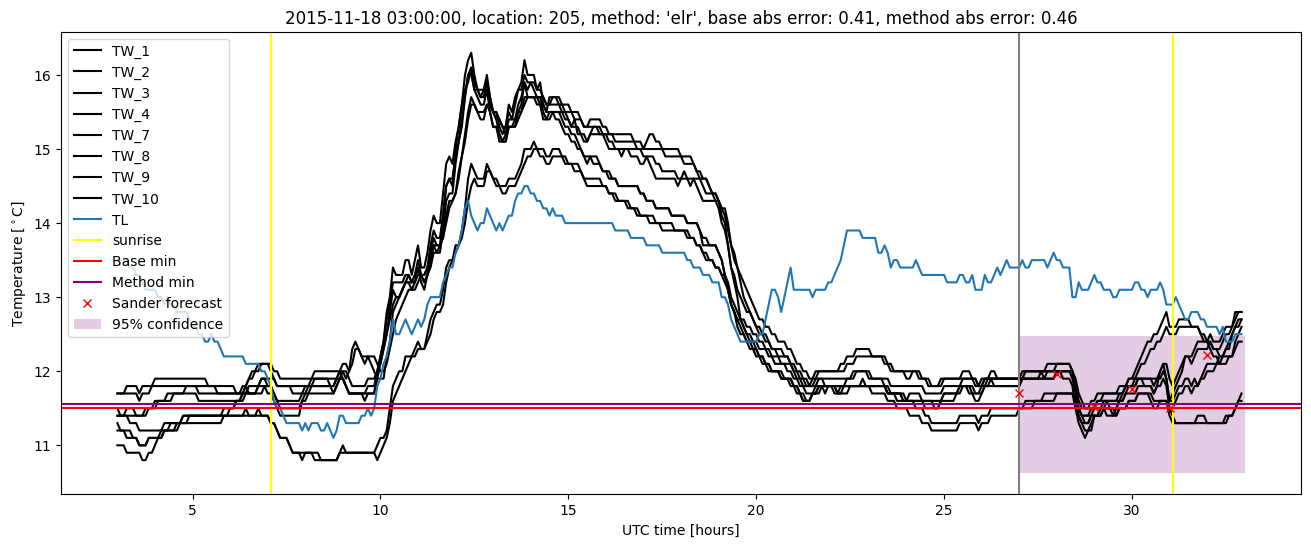
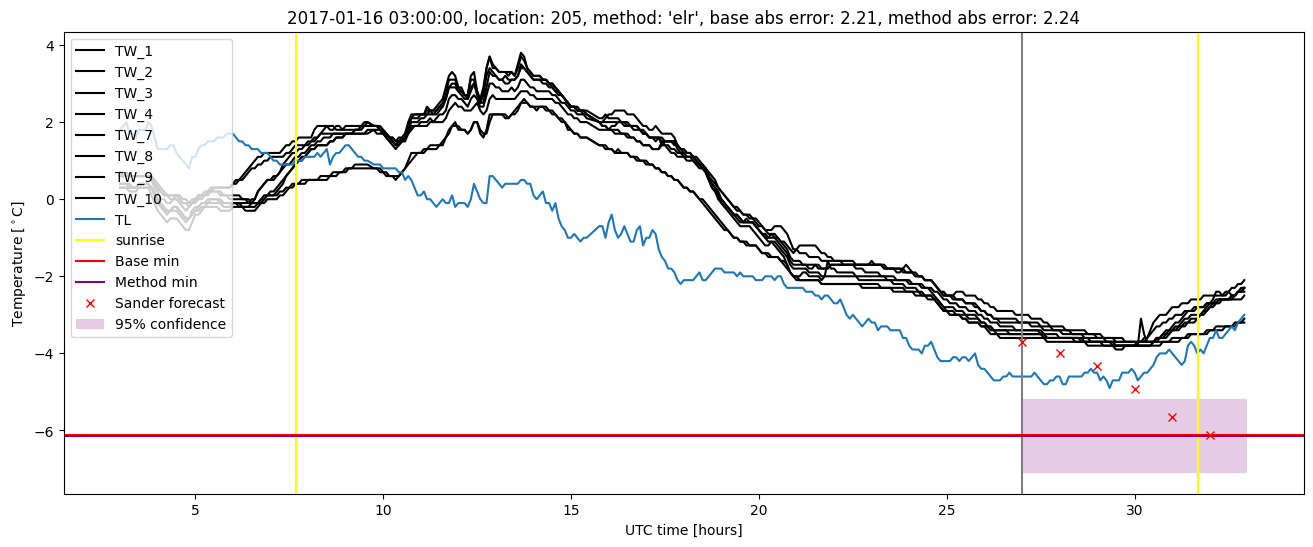
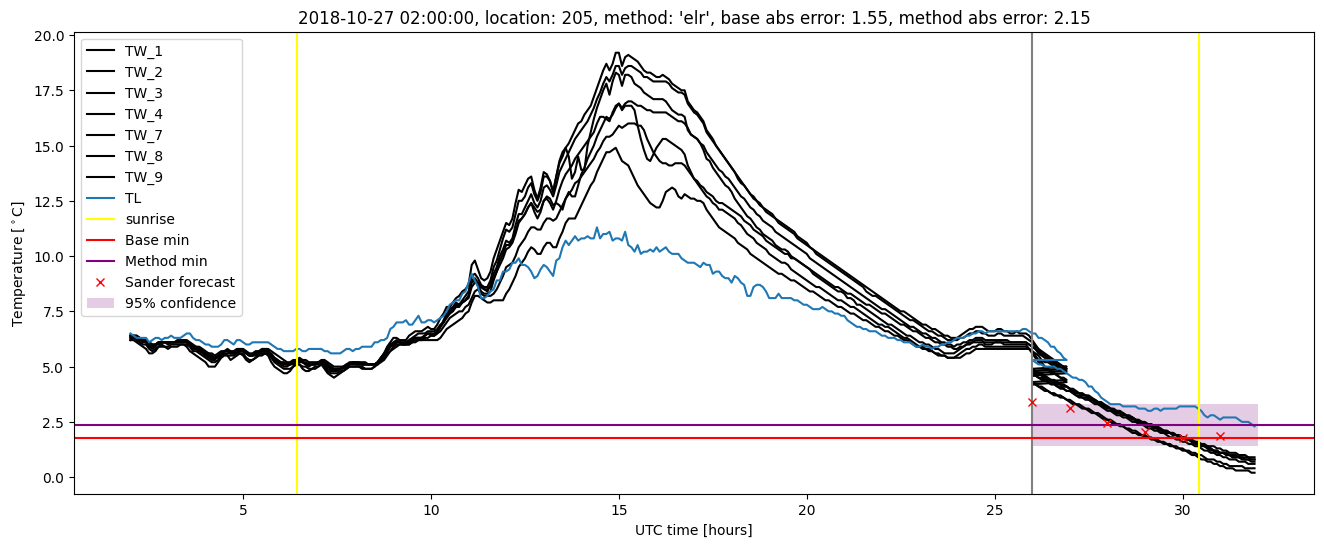
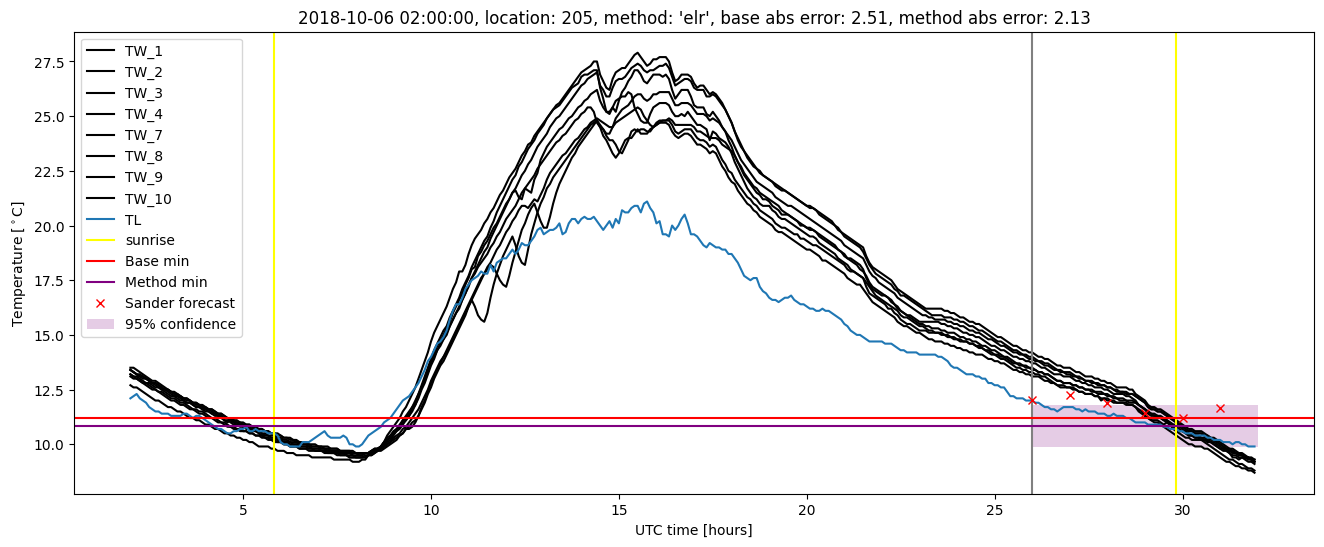
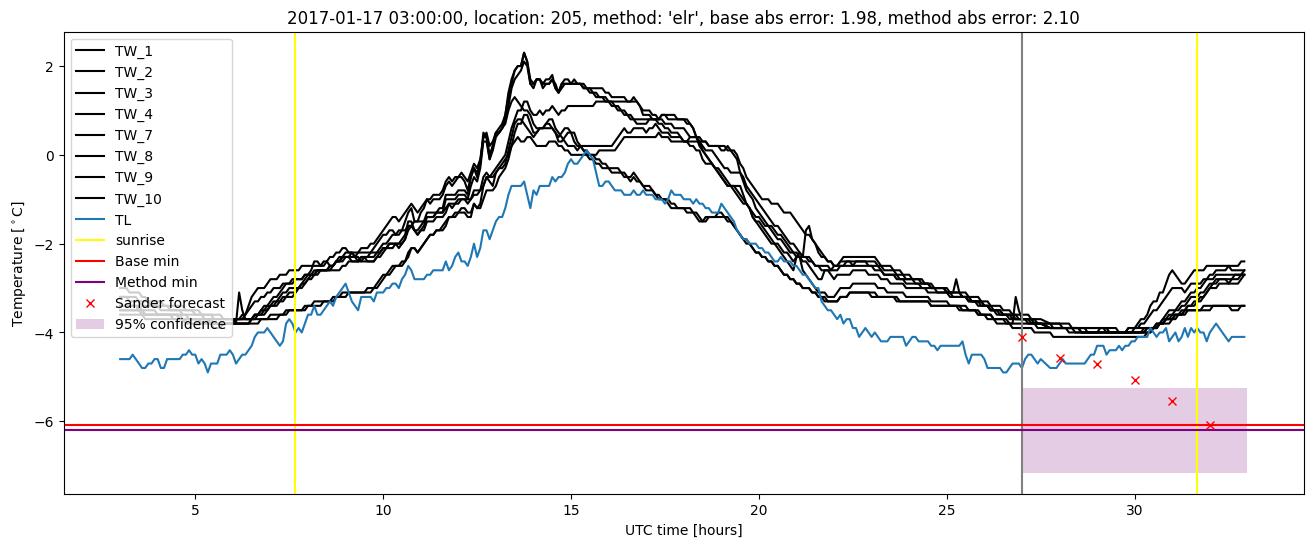
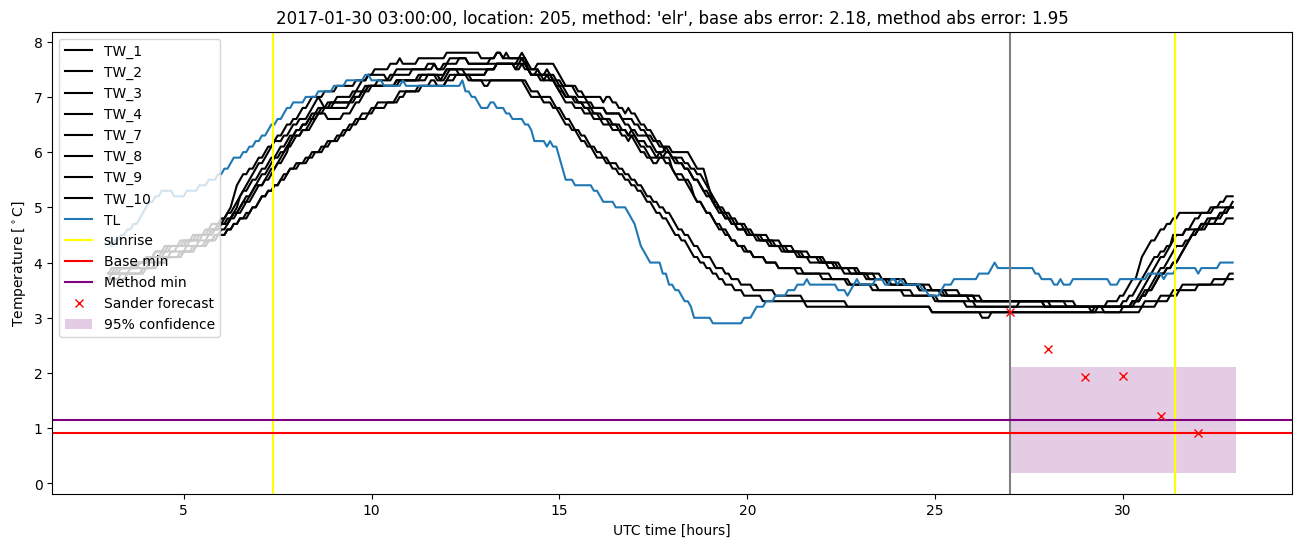
Extended logistic regression results
| names |
period |
power |
significance |
meanSquareError |
absError |
maxError |
CRPS |
IGN |
| baseline |
winter 2016 |
0.978 |
0.038 |
0.443 |
0.512 |
2.046 |
NaN |
NaN |
| elr |
winter 2016 |
0.989 |
0.077 |
0.431 |
0.499 |
1.847 |
0.566 |
3.981 |
| baseline |
winter 2017 |
0.957 |
0.053 |
0.480 |
0.506 |
2.210 |
NaN |
NaN |
| elr |
winter 2017 |
0.948 |
0.053 |
0.418 |
0.489 |
2.236 |
0.537 |
3.207 |
| baseline |
winter 2018 |
0.986 |
0.108 |
0.350 |
0.437 |
1.689 |
NaN |
NaN |
| elr |
winter 2018 |
0.979 |
0.108 |
0.345 |
0.452 |
1.621 |
0.566 |
3.111 |
| baseline |
winter 2019 |
0.993 |
0.000e+00 |
0.405 |
0.465 |
2.512 |
NaN |
NaN |
| elr |
winter 2019 |
0.986 |
0.000e+00 |
0.325 |
0.408 |
2.148 |
0.599 |
3.986 |
| baseline |
all |
0.979 |
0.059 |
0.418 |
0.481 |
2.512 |
NaN |
NaN |
| elr |
all |
0.978 |
0.068 |
0.381 |
0.464 |
2.236 |
0.567 |
3.589 |
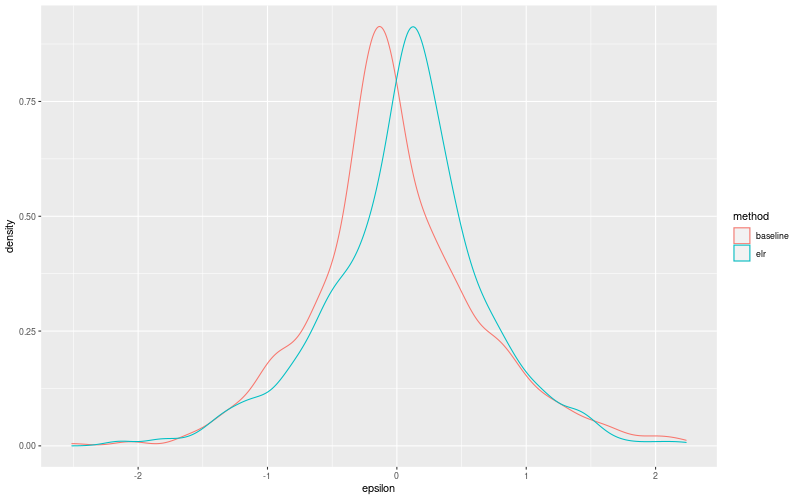
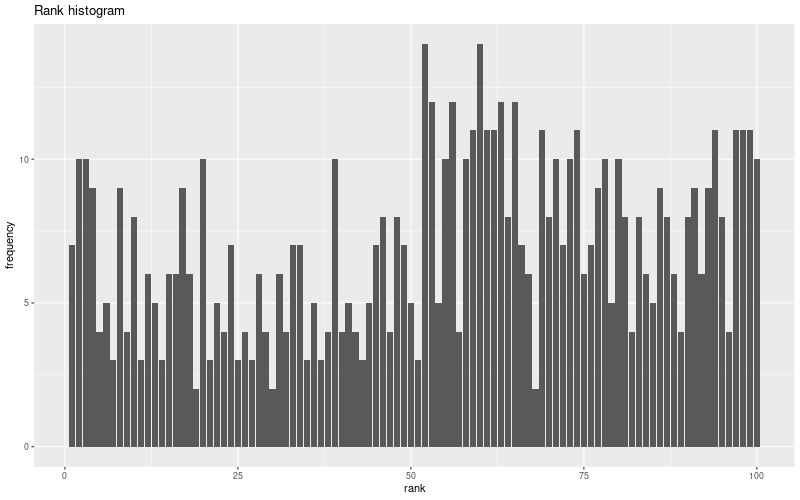
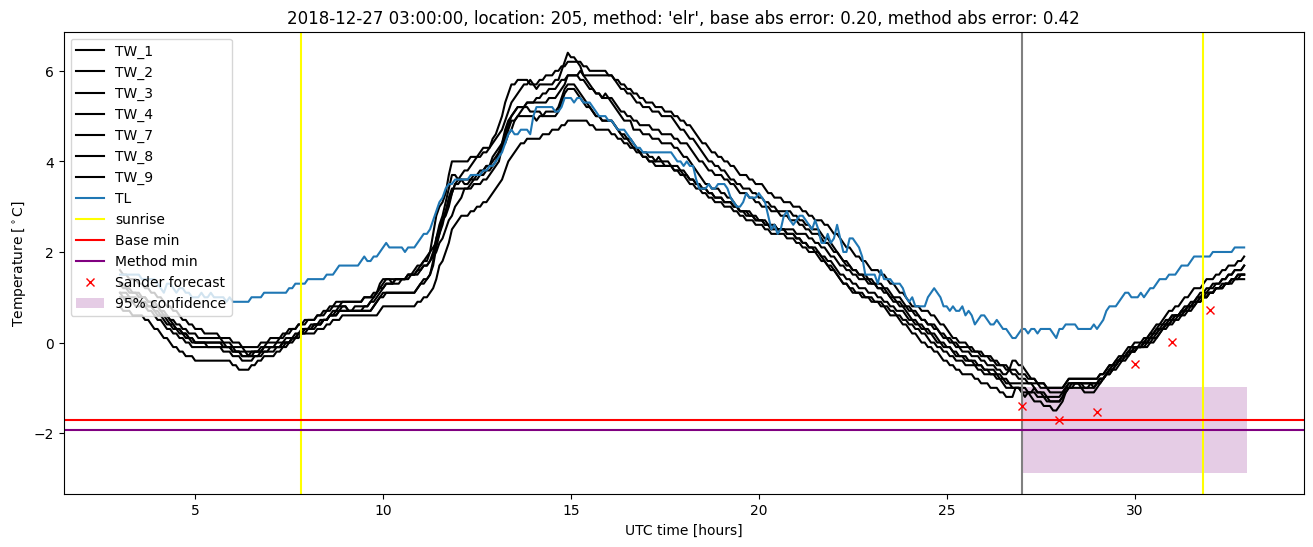
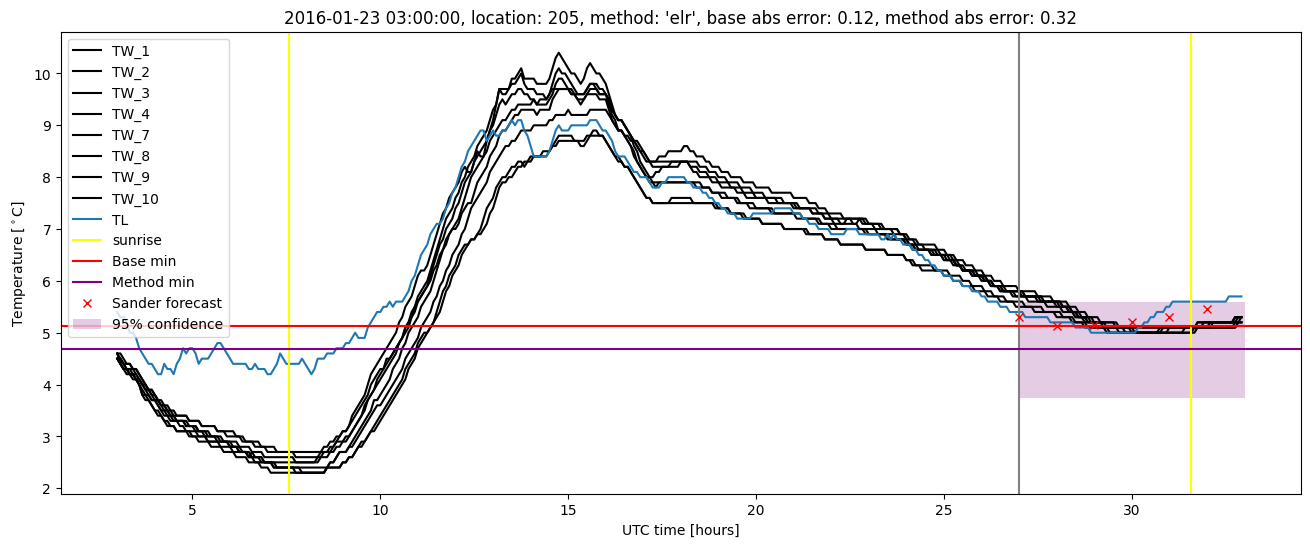
Extended logistic regression plots