GMS location: 204
Random forest results
| names |
period |
power |
significance |
meanSquareError |
absError |
maxError |
CRPS |
IGN |
| baseline |
winter 2016 |
0.983 |
0.194 |
2.451 |
0.870 |
1.324e+01 |
NaN |
NaN |
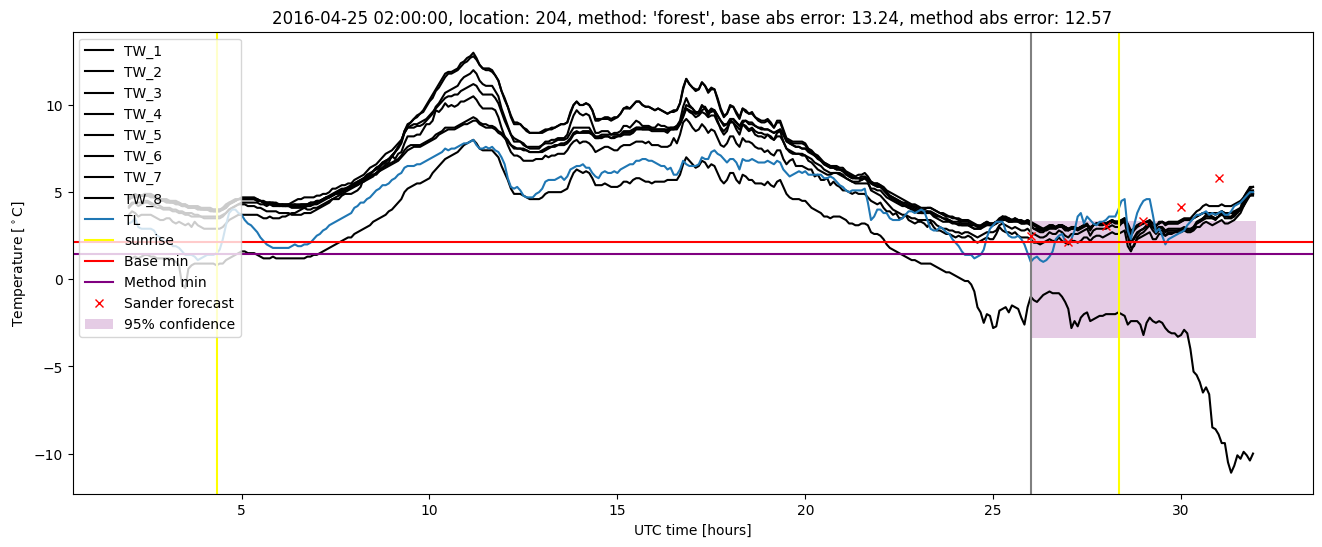
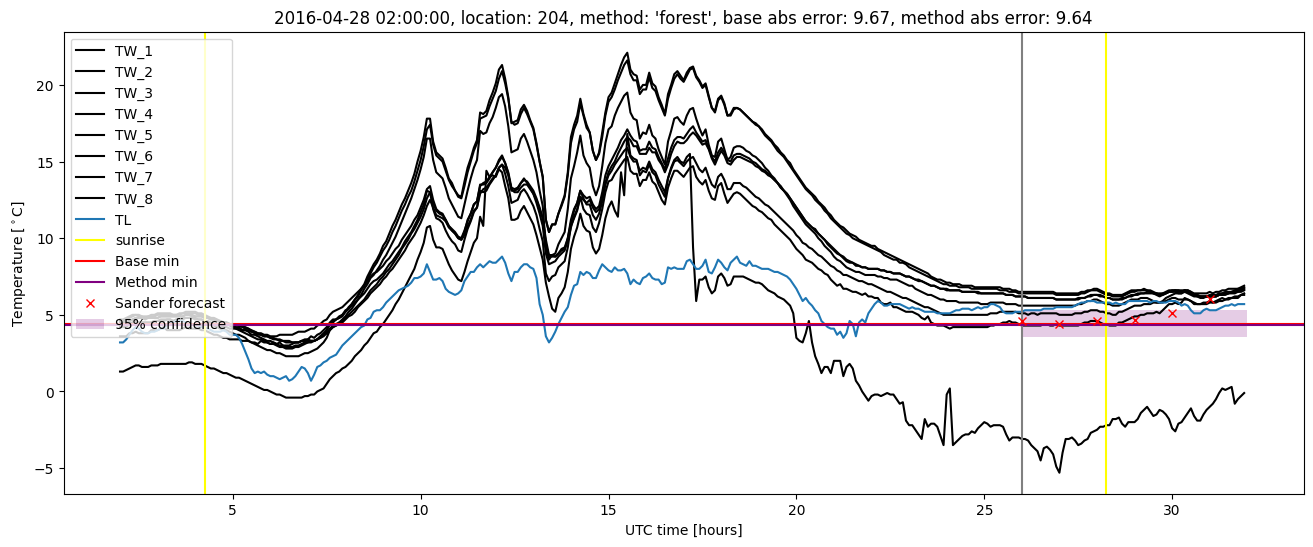
| forest |
winter 2016 |
0.977 |
0.194 |
2.257 |
0.801 |
1.257e+01 |
0.479 |
3.805 |
| baseline |
winter 2017 |
0.950 |
0.062 |
0.667 |
0.527 |
5.496 |
NaN |
NaN |
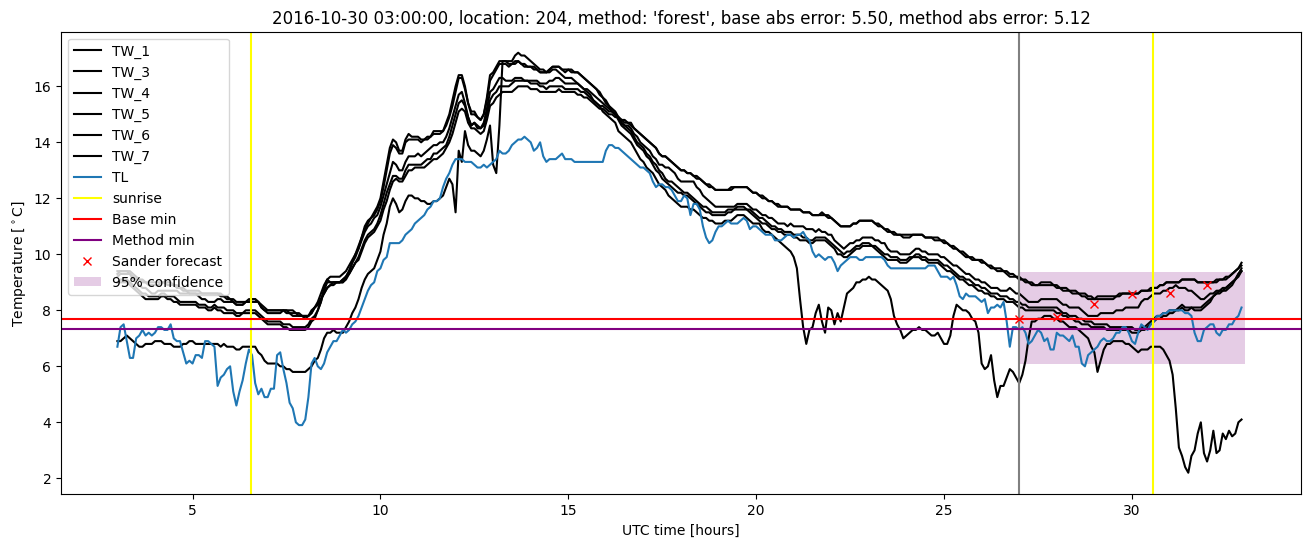
| forest |
winter 2017 |
0.967 |
0.031 |
0.528 |
0.474 |
5.118 |
0.547 |
1.510 |
| baseline |
winter 2018 |
0.986 |
0.097 |
0.312 |
0.415 |
1.897 |
NaN |
NaN |
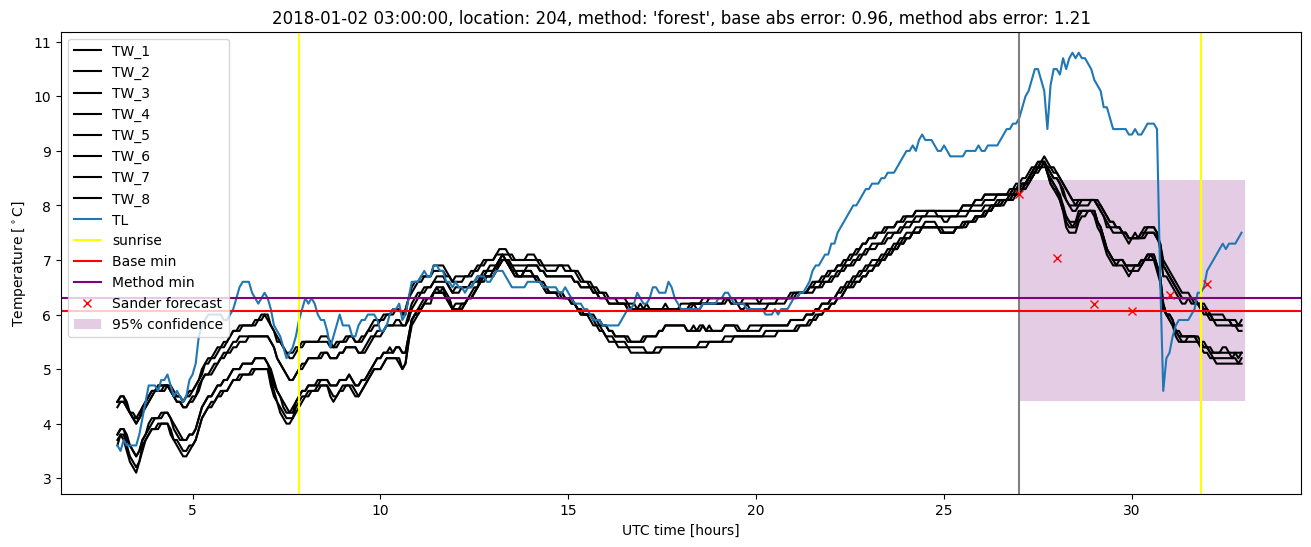
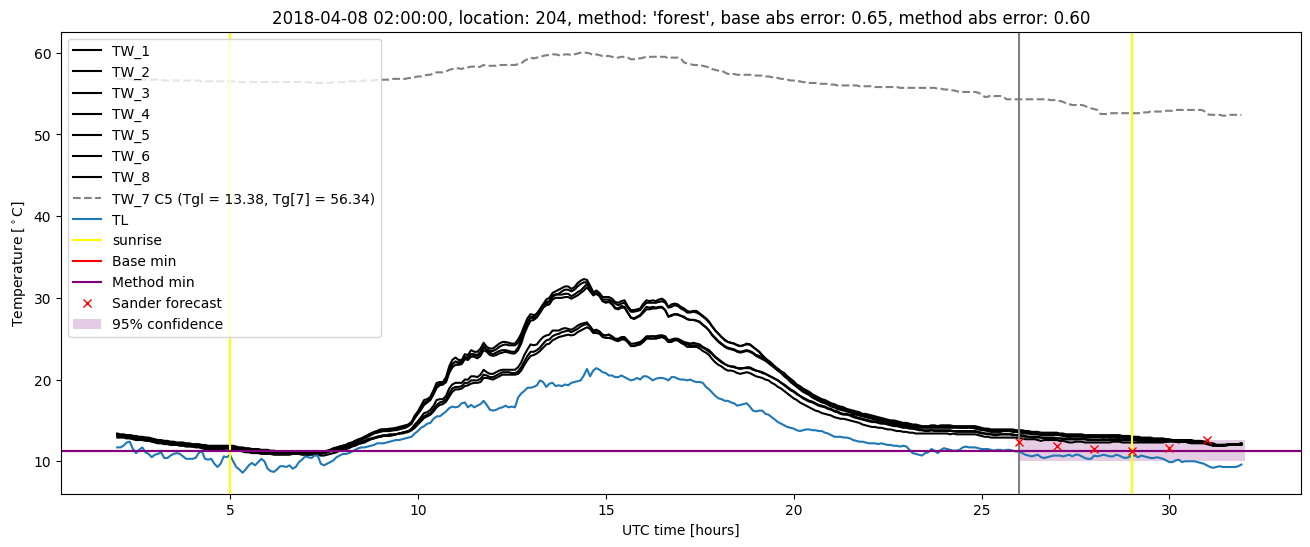
| forest |
winter 2018 |
0.966 |
0.032 |
0.431 |
0.444 |
3.799 |
0.666 |
1.579 |
| baseline |
winter 2019 |
0.993 |
0.000e+00 |
0.357 |
0.437 |
2.304 |
NaN |
NaN |
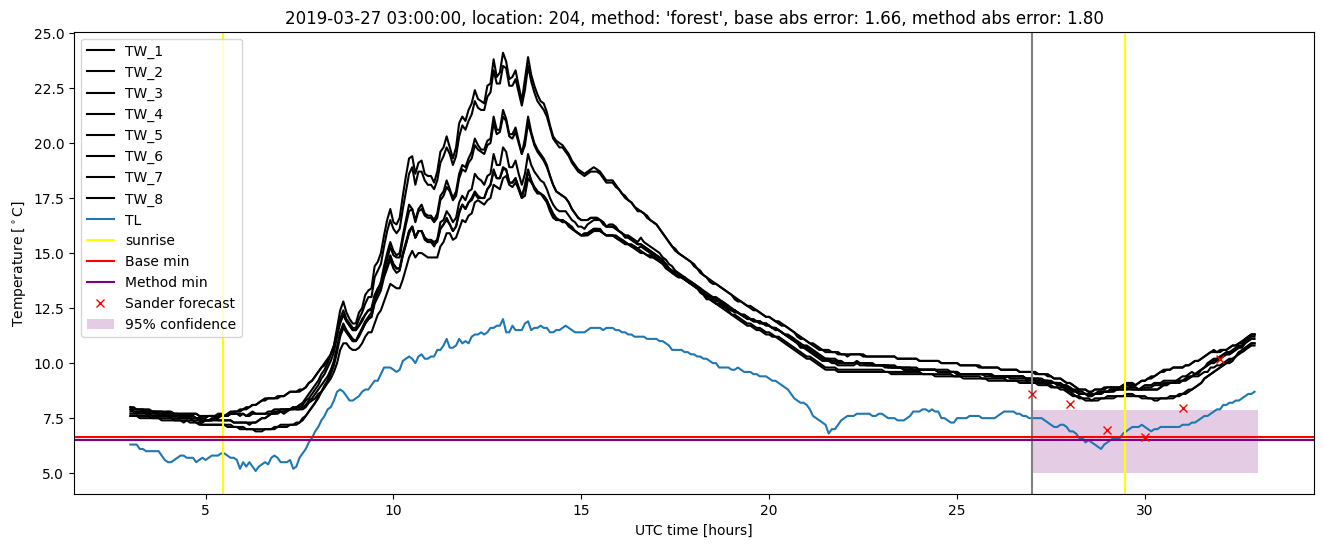
| forest |
winter 2019 |
0.993 |
0.111 |
0.270 |
0.387 |
1.801 |
0.603 |
1.554 |
| baseline |
all |
0.979 |
0.107 |
1.037 |
0.581 |
1.324e+01 |
NaN |
NaN |
| forest |
all |
0.976 |
0.087 |
0.961 |
0.544 |
1.257e+01 |
0.570 |
2.220 |
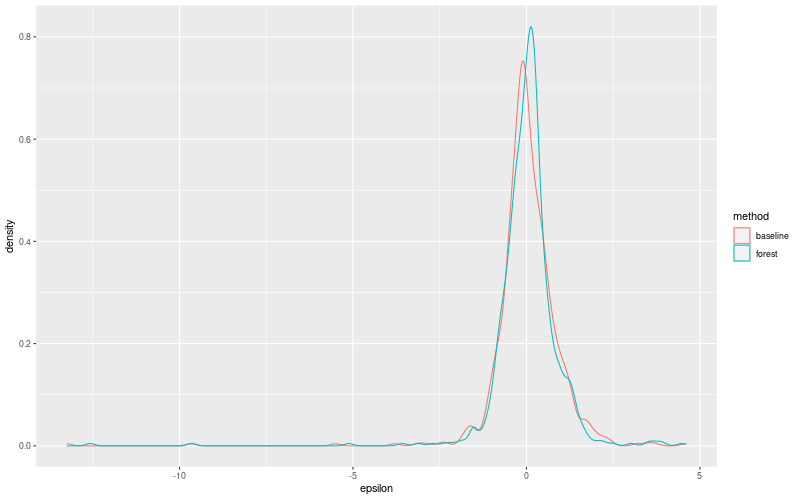
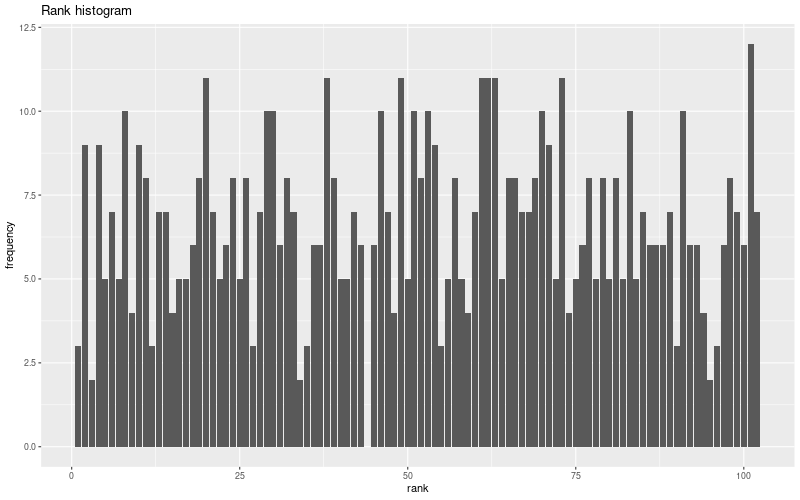
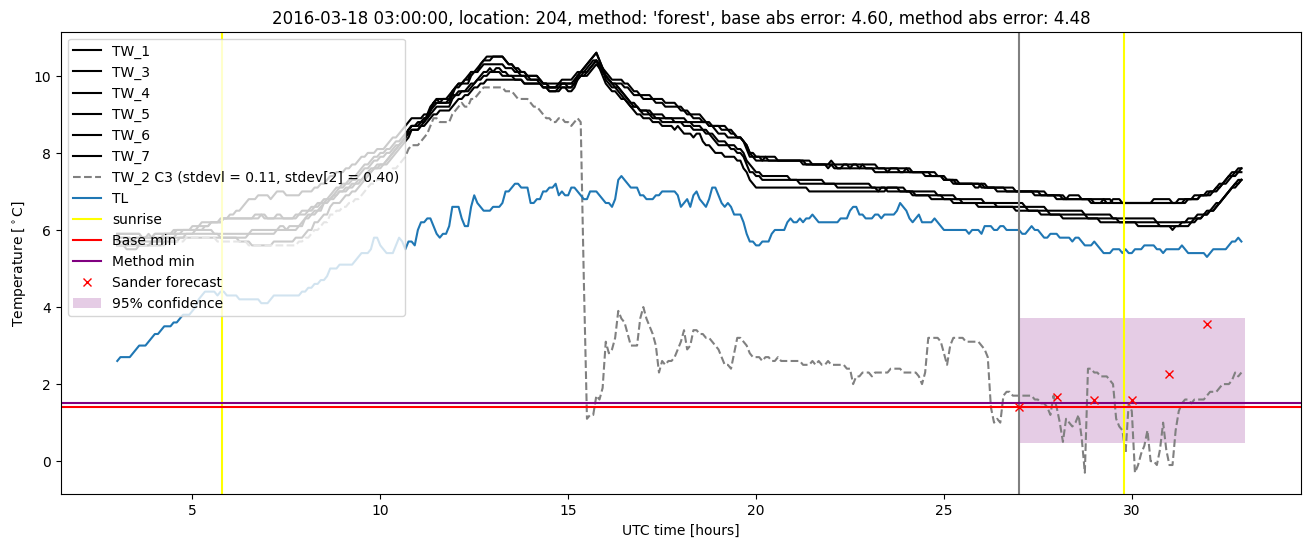
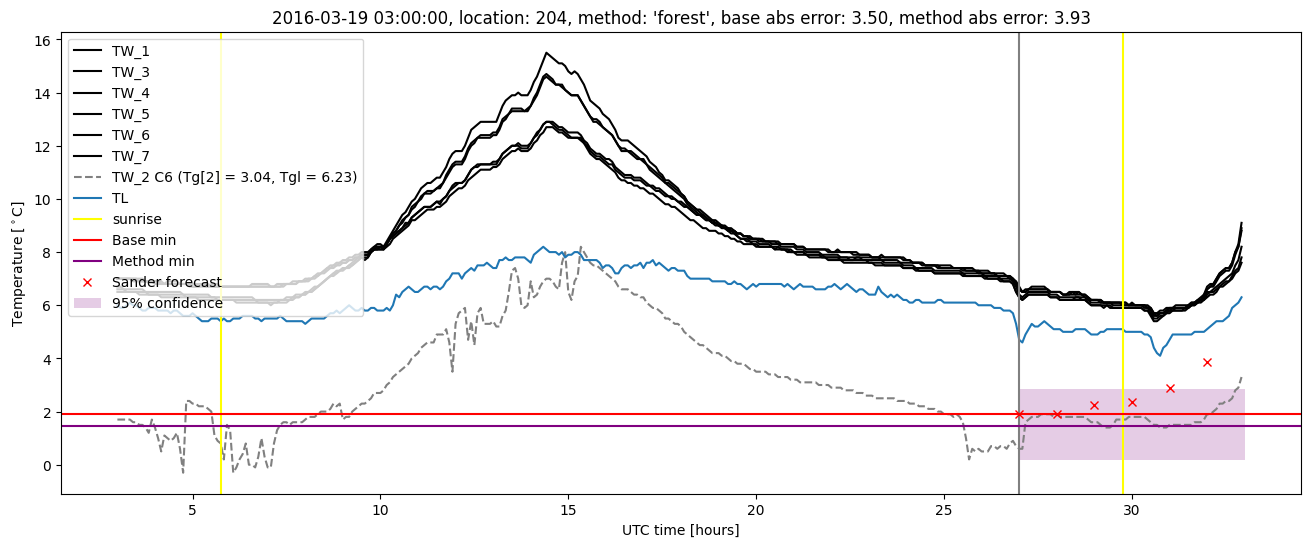
Random forest plots
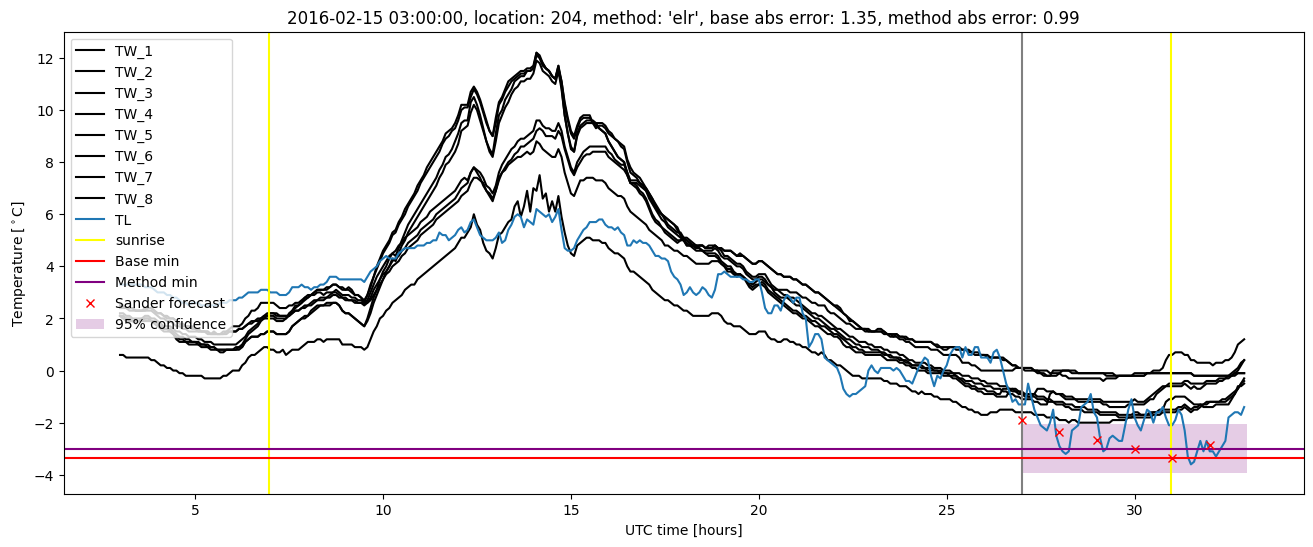
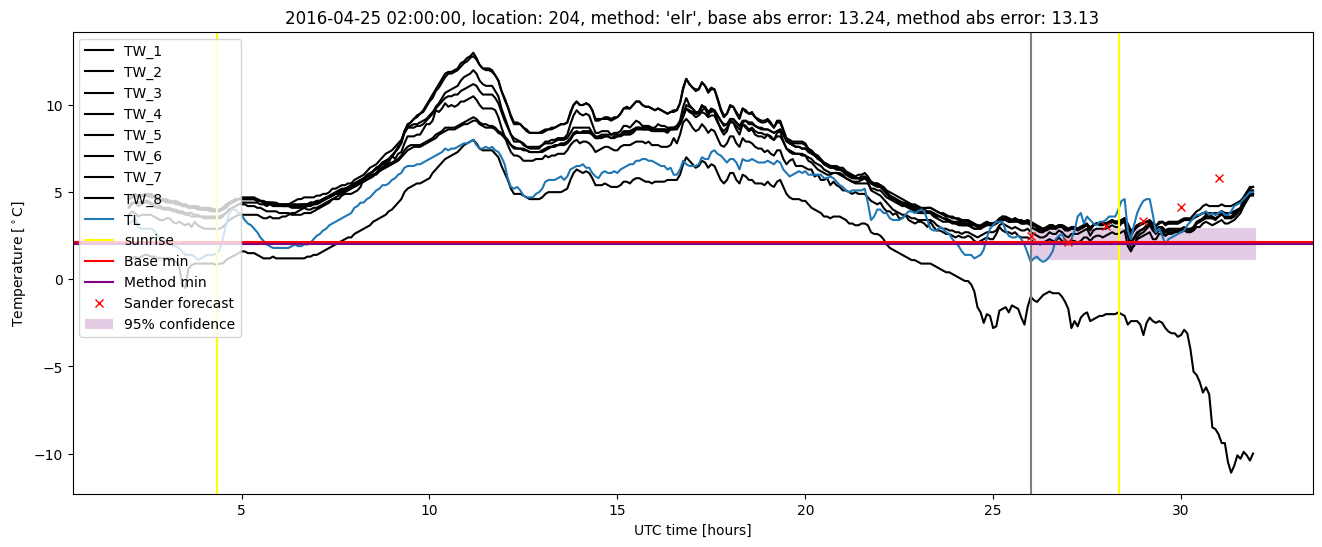
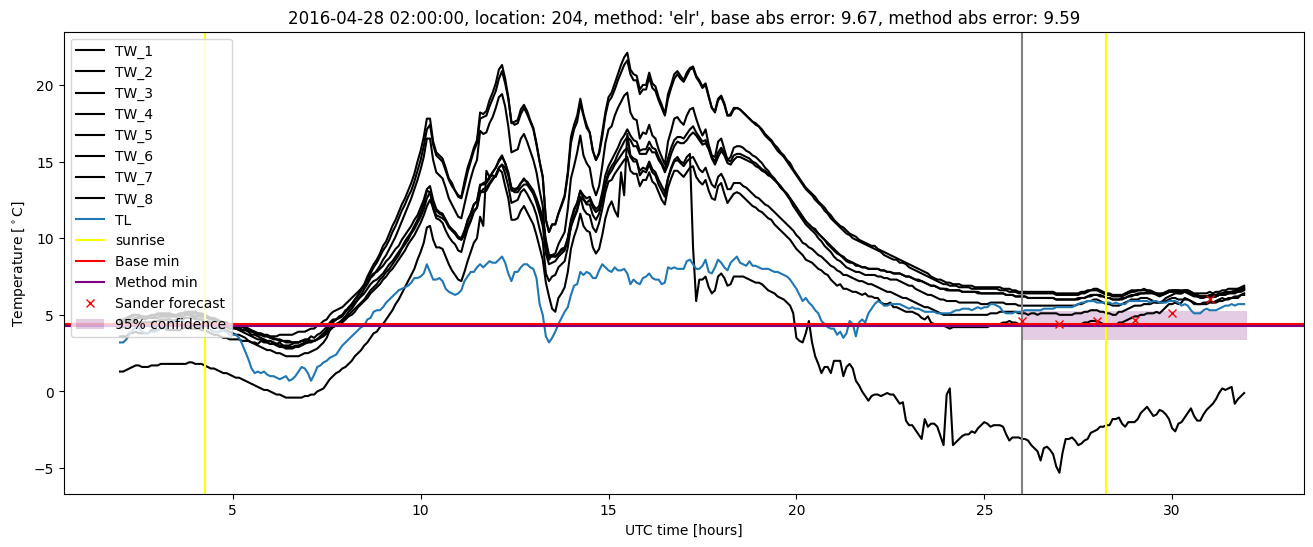
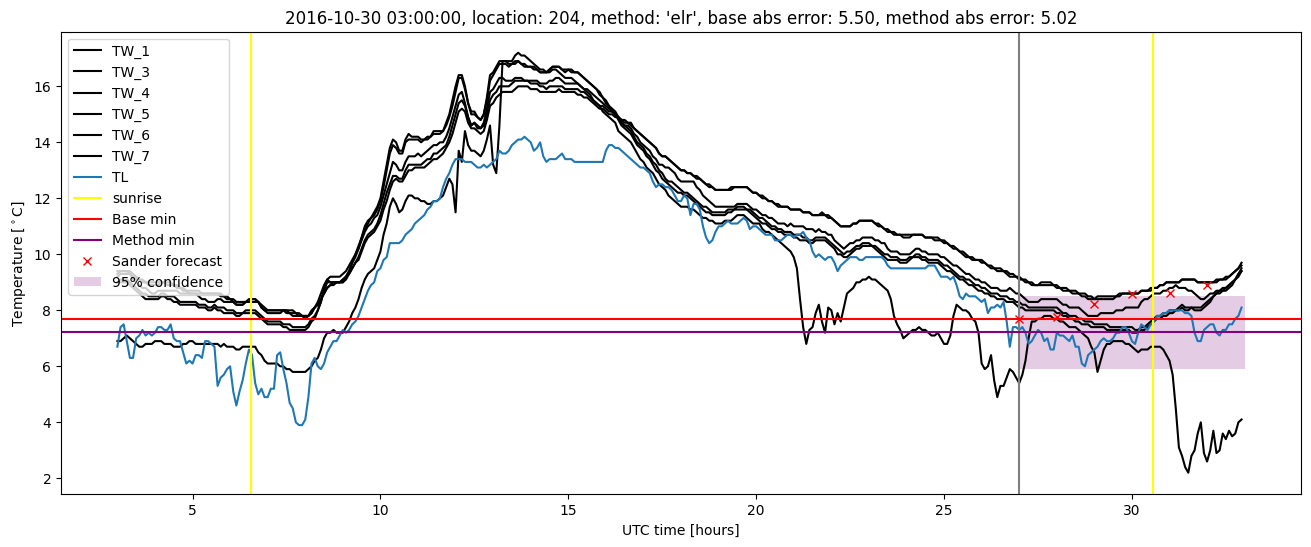
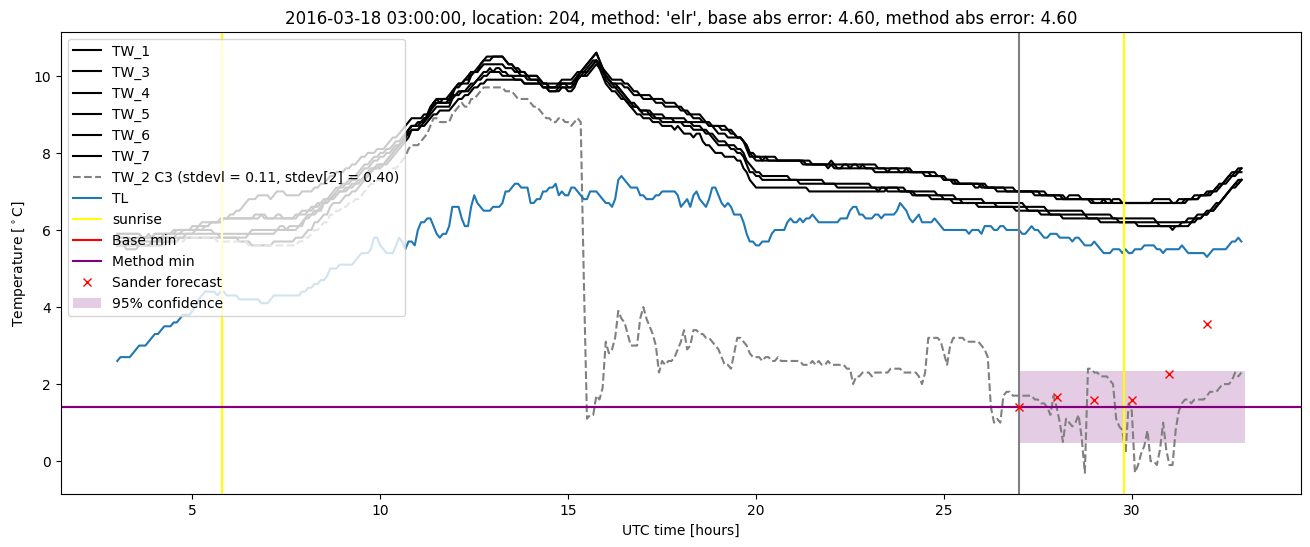
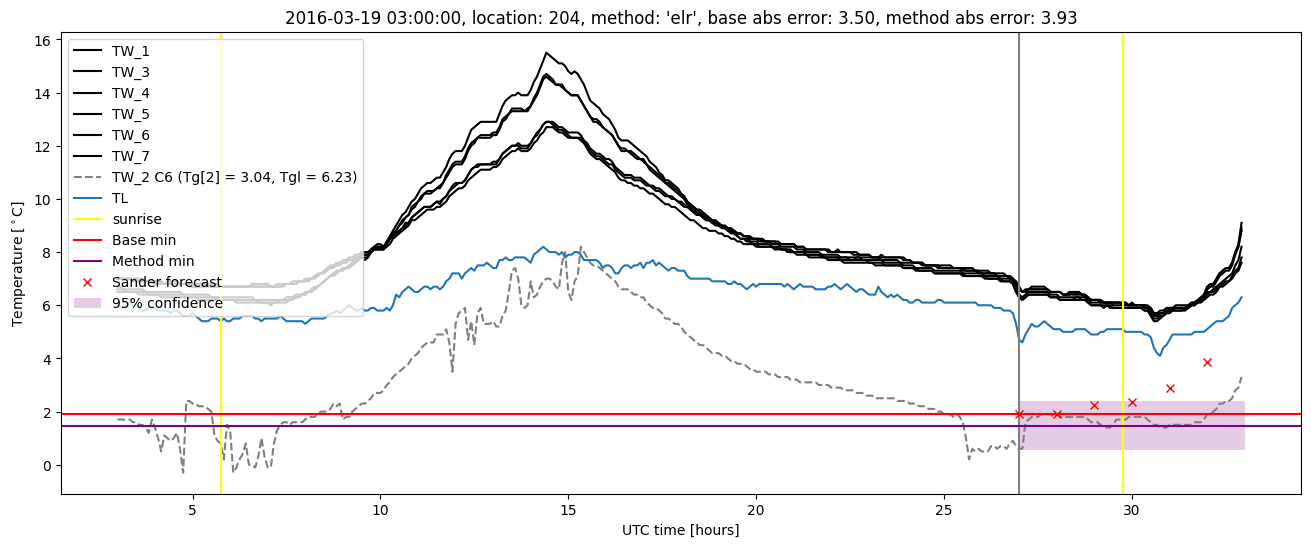
Extended logistic regression results
| names |
period |
power |
significance |
meanSquareError |
absError |
maxError |
CRPS |
IGN |
| baseline |
winter 2016 |
0.983 |
0.194 |
2.451 |
0.870 |
1.324e+01 |
NaN |
NaN |
| elr |
winter 2016 |
0.977 |
0.226 |
2.338 |
0.820 |
1.313e+01 |
0.516 |
3.259 |
| baseline |
winter 2017 |
0.950 |
0.062 |
0.667 |
0.527 |
5.496 |
NaN |
NaN |
| elr |
winter 2017 |
0.967 |
0.031 |
0.535 |
0.478 |
5.017 |
0.482 |
1.358 |
| baseline |
winter 2018 |
0.986 |
0.097 |
0.312 |
0.415 |
1.897 |
NaN |
NaN |
| elr |
winter 2018 |
0.973 |
0.065 |
0.309 |
0.427 |
2.065 |
0.516 |
1.385 |
| baseline |
winter 2019 |
0.993 |
0.000e+00 |
0.357 |
0.437 |
2.304 |
NaN |
NaN |
| elr |
winter 2019 |
1.000 |
0.111 |
0.274 |
0.388 |
2.356 |
0.464 |
1.244 |
| baseline |
all |
0.979 |
0.107 |
1.037 |
0.581 |
1.324e+01 |
NaN |
NaN |
| elr |
all |
0.979 |
0.107 |
0.955 |
0.547 |
1.313e+01 |
0.497 |
1.905 |
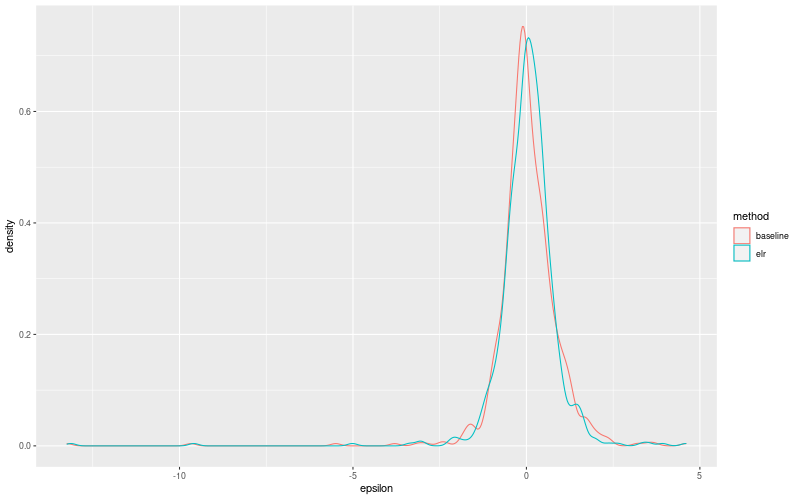
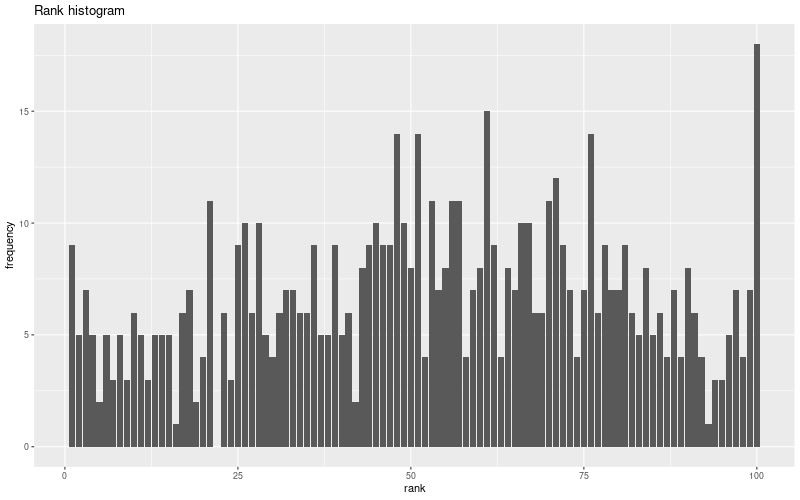
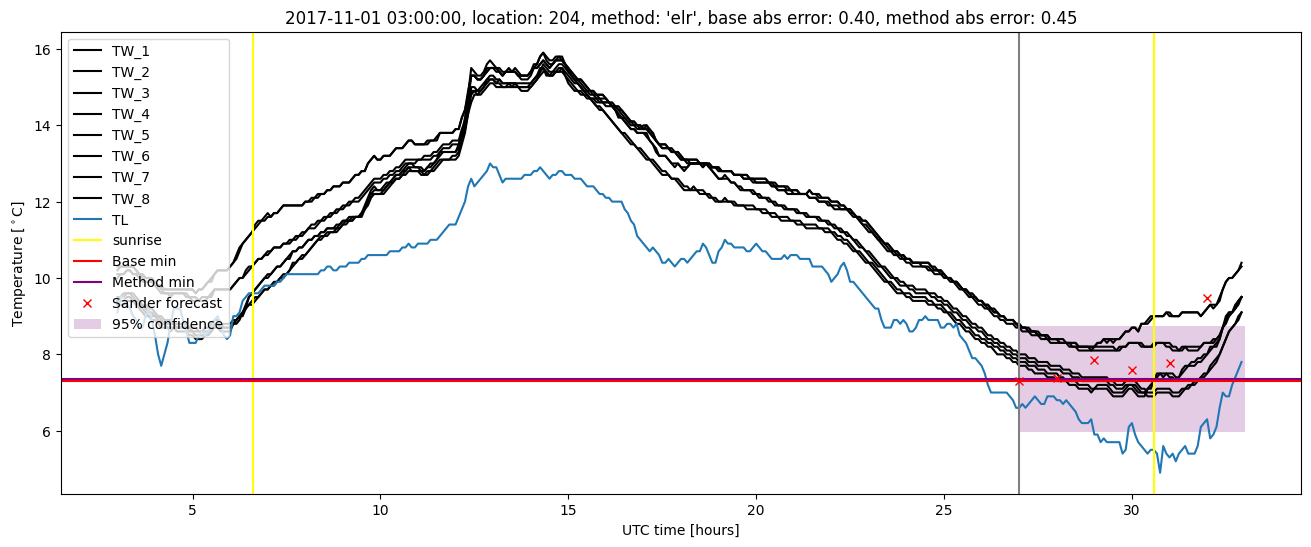
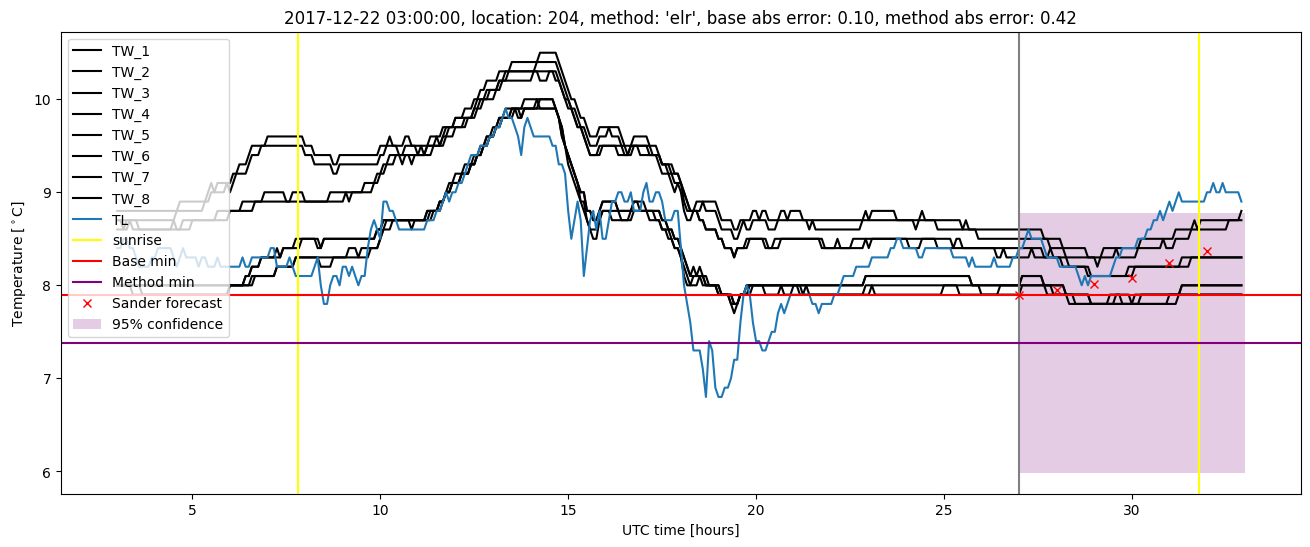
Extended logistic regression plots