GMS location: 203
Random forest results
| names |
period |
power |
significance |
meanSquareError |
absError |
maxError |
CRPS |
IGN |
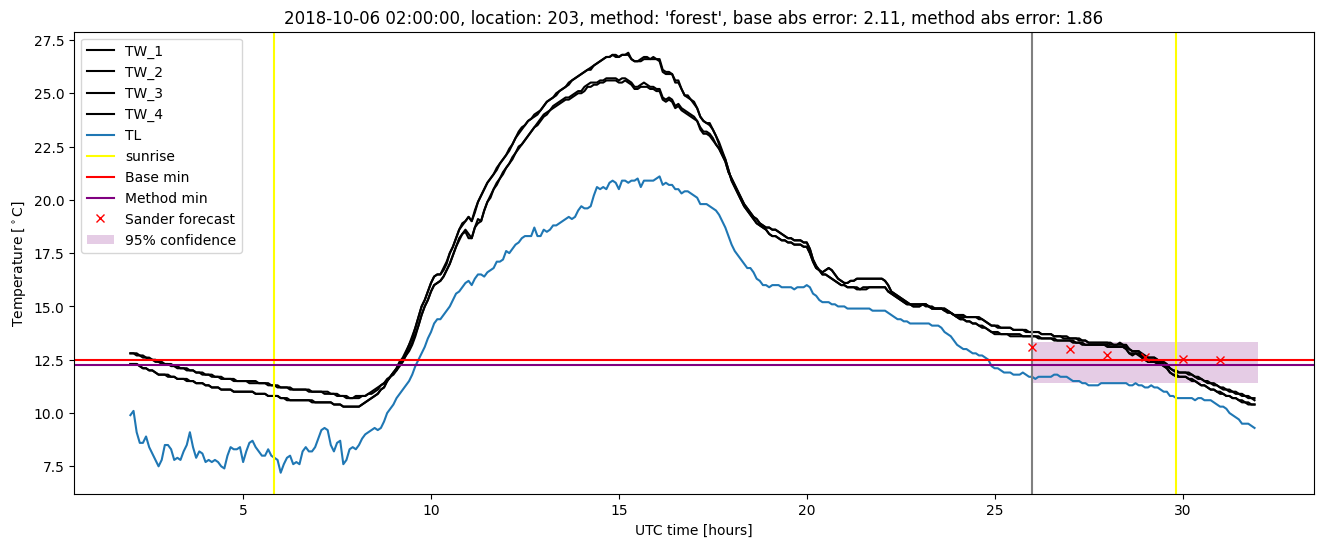
| baseline |
winter 2016 |
0.984 |
0.000e+00 |
0.445 |
0.507 |
2.897 |
NaN |
NaN |
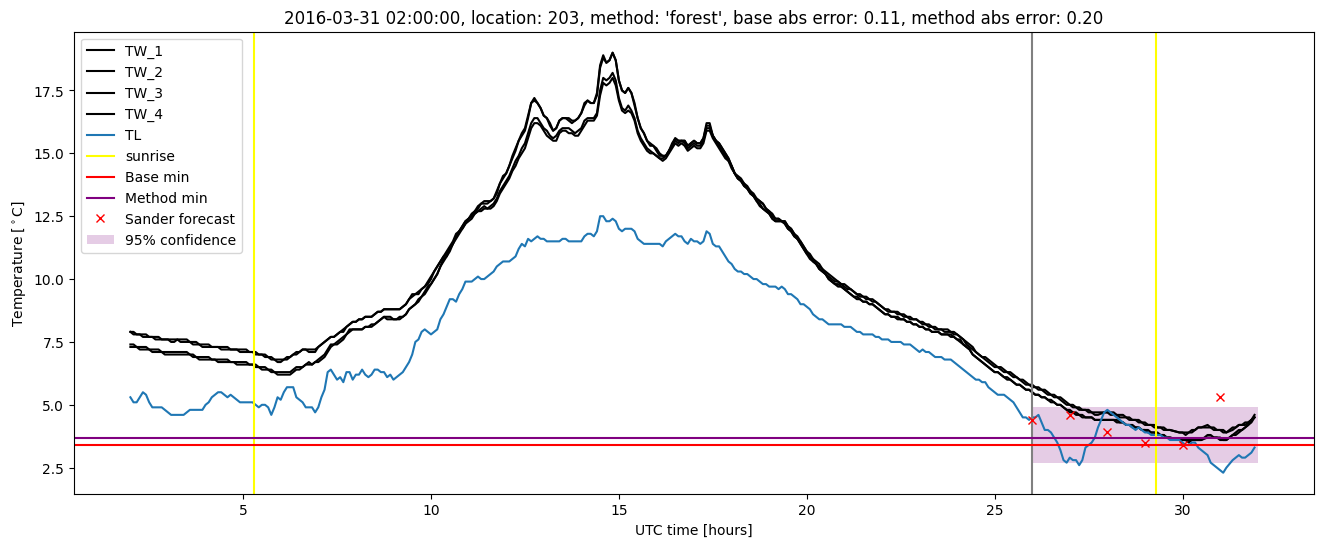
| forest |
winter 2016 |
0.989 |
0.000e+00 |
0.342 |
0.441 |
2.656 |
0.463 |
4.781 |
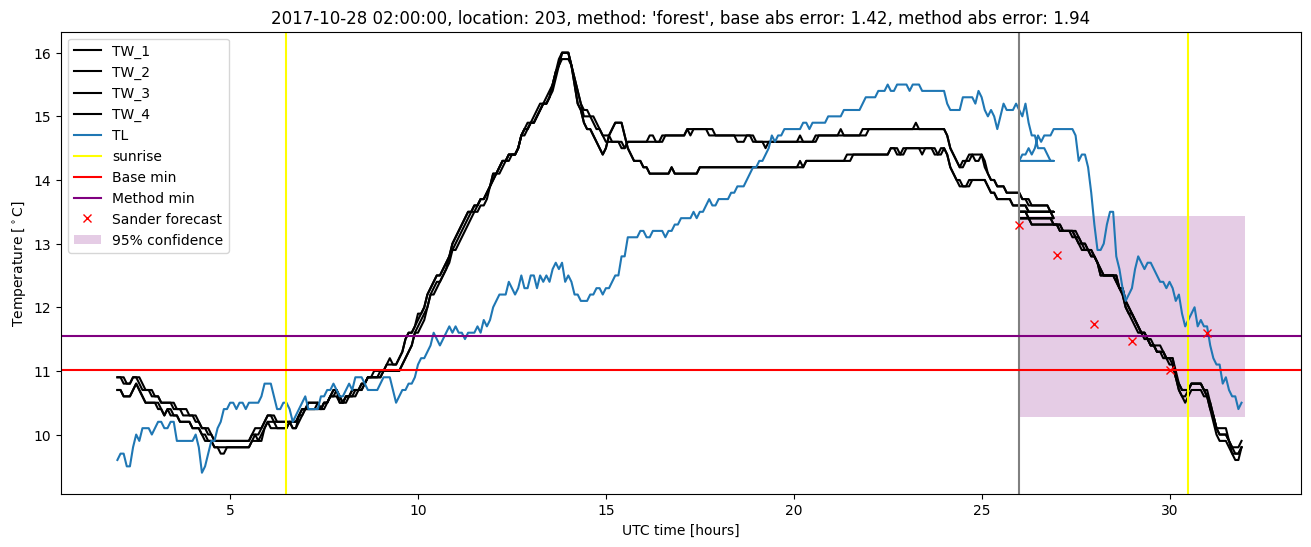
| baseline |
winter 2017 |
0.967 |
0.094 |
0.486 |
0.528 |
2.411 |
NaN |
NaN |
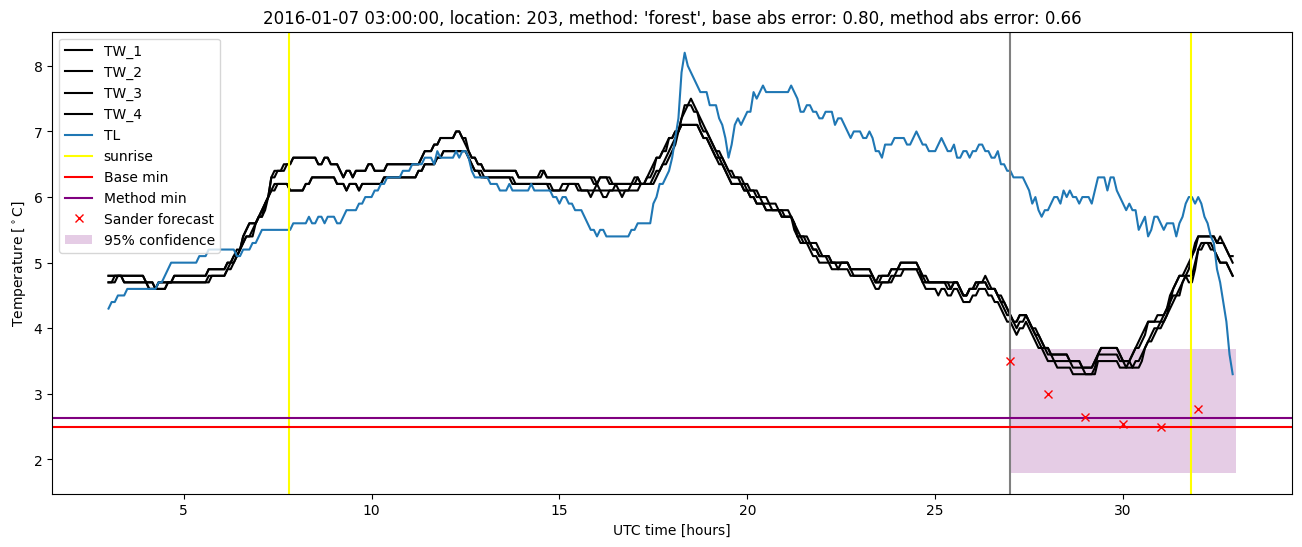
| forest |
winter 2017 |
0.975 |
0.094 |
0.315 |
0.425 |
1.527 |
0.476 |
3.545 |
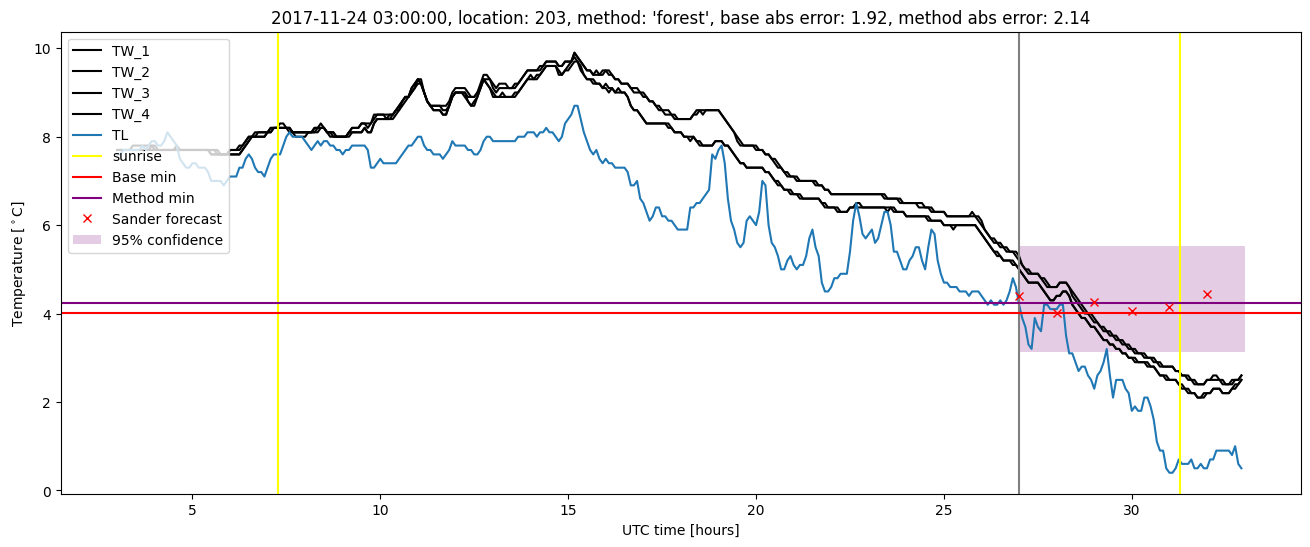
| baseline |
winter 2018 |
0.986 |
0.133 |
0.324 |
0.429 |
1.923 |
NaN |
NaN |
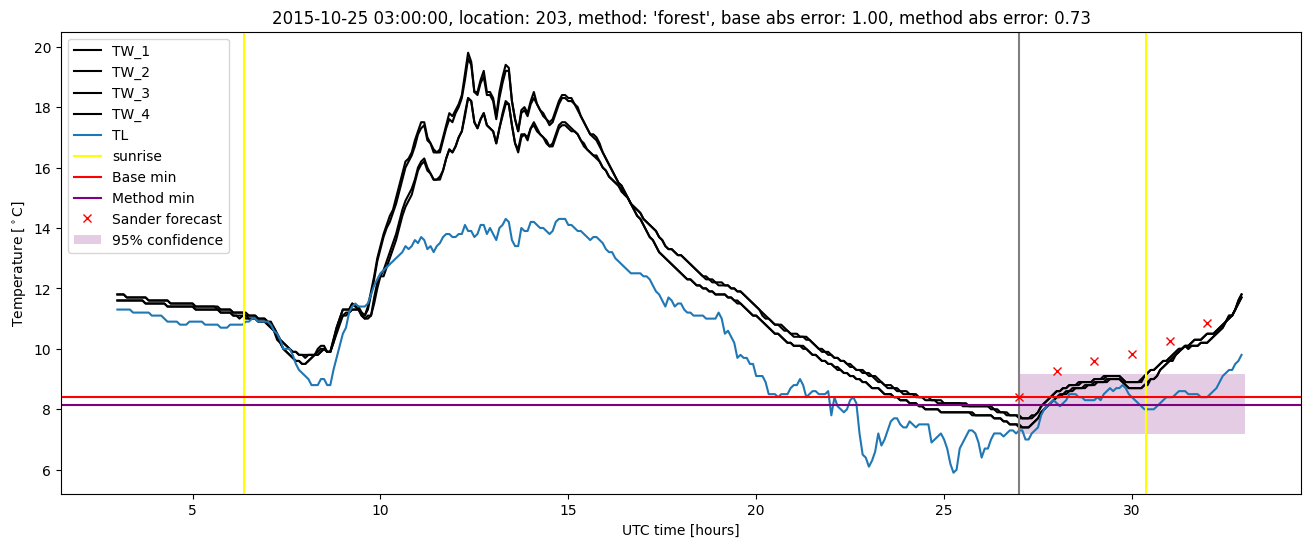
| forest |
winter 2018 |
0.993 |
0.133 |
0.269 |
0.375 |
2.136 |
0.458 |
2.454 |
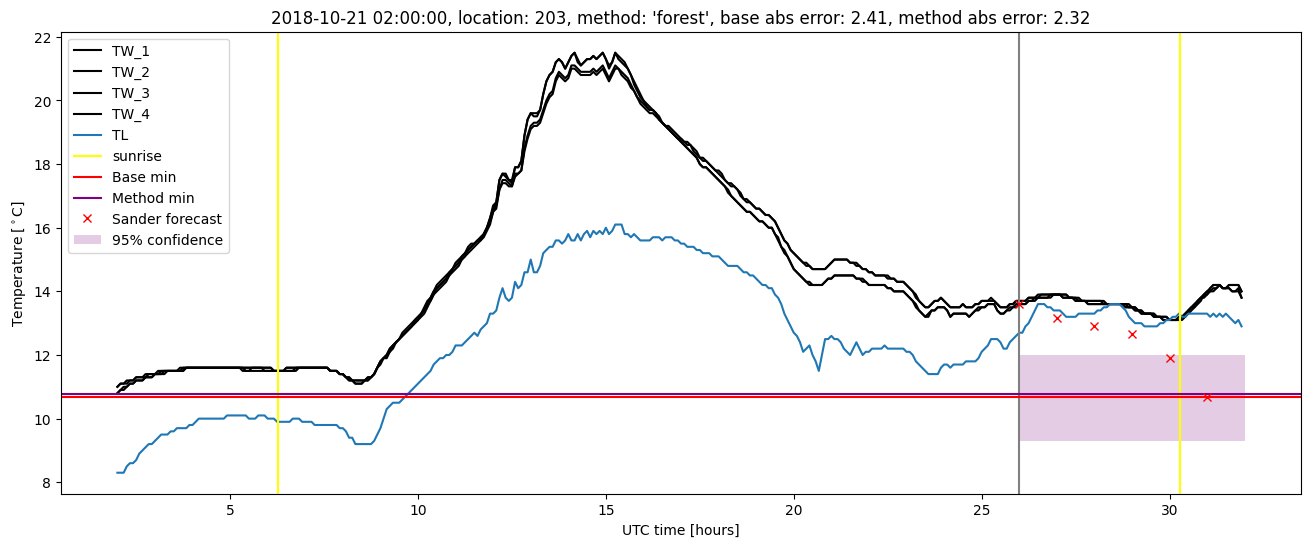
| baseline |
winter 2019 |
0.993 |
0.077 |
0.375 |
0.455 |
2.413 |
NaN |
NaN |
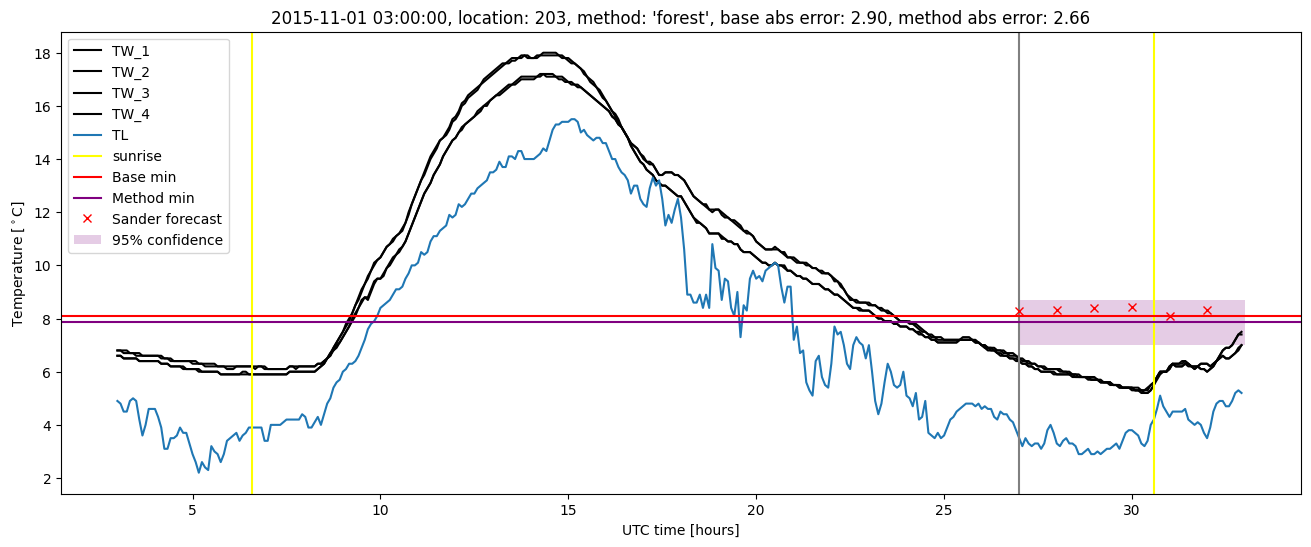
| forest |
winter 2019 |
1.000 |
0.077 |
0.287 |
0.405 |
2.322 |
0.451 |
2.801 |
| baseline |
all |
0.983 |
0.087 |
0.408 |
0.480 |
2.897 |
NaN |
NaN |
| forest |
all |
0.990 |
0.087 |
0.305 |
0.412 |
2.656 |
0.462 |
3.473 |
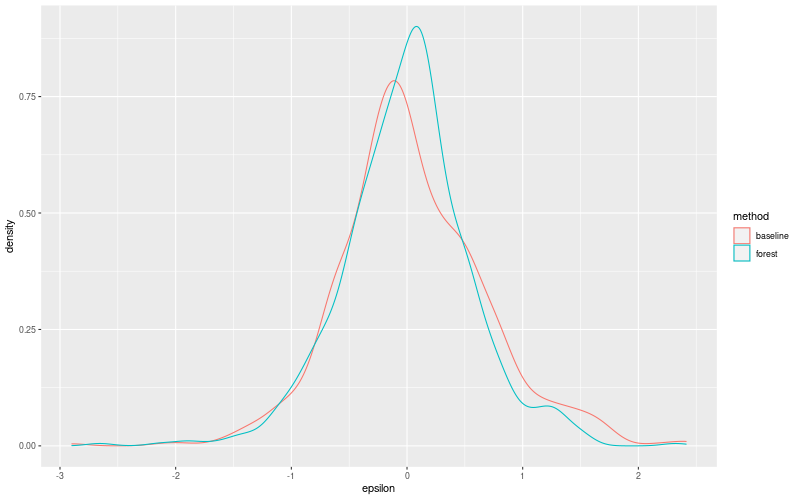
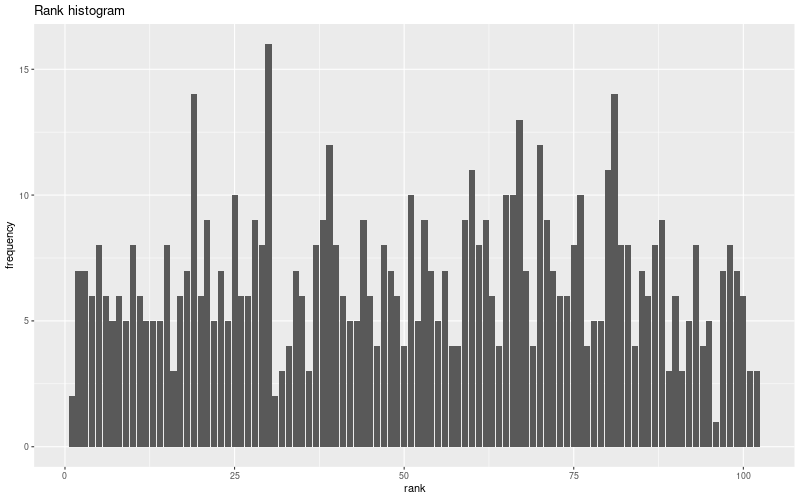
Random forest plots
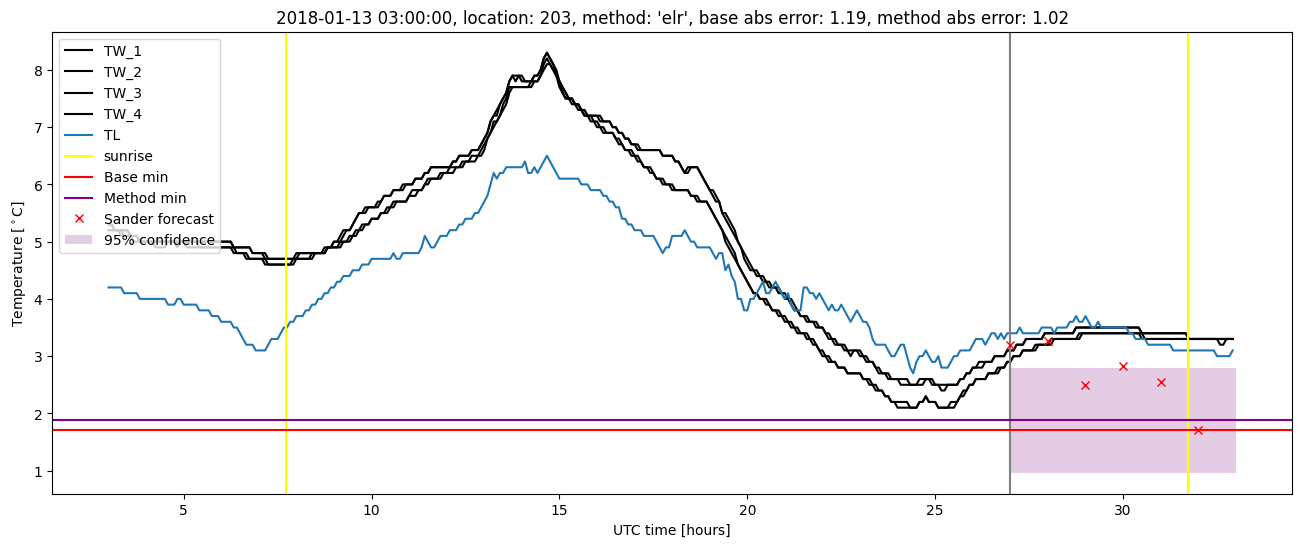
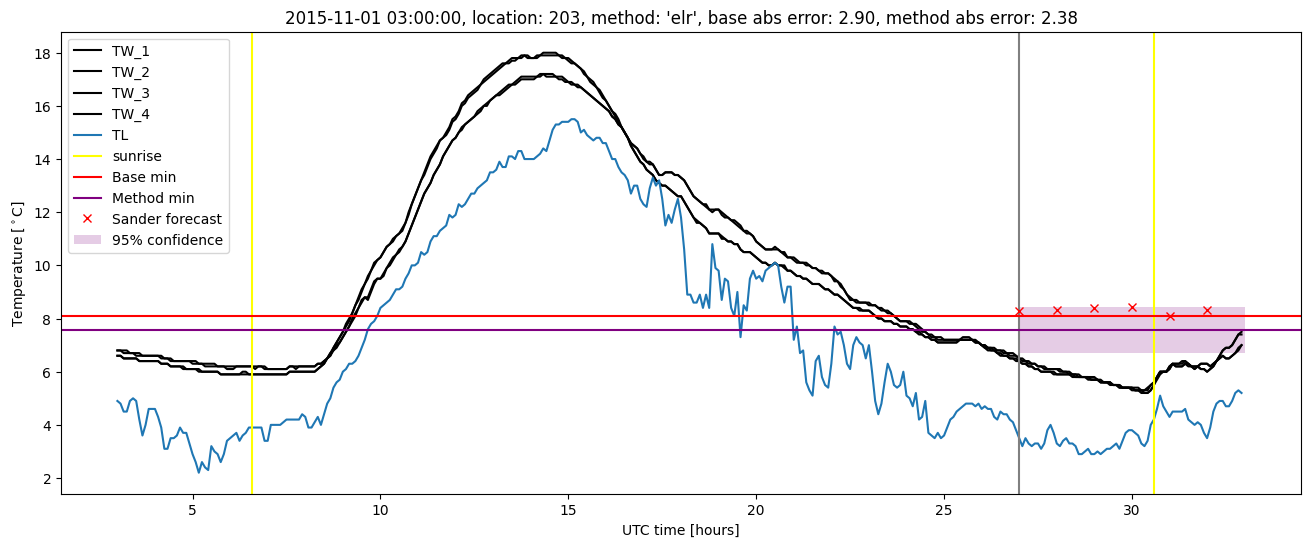
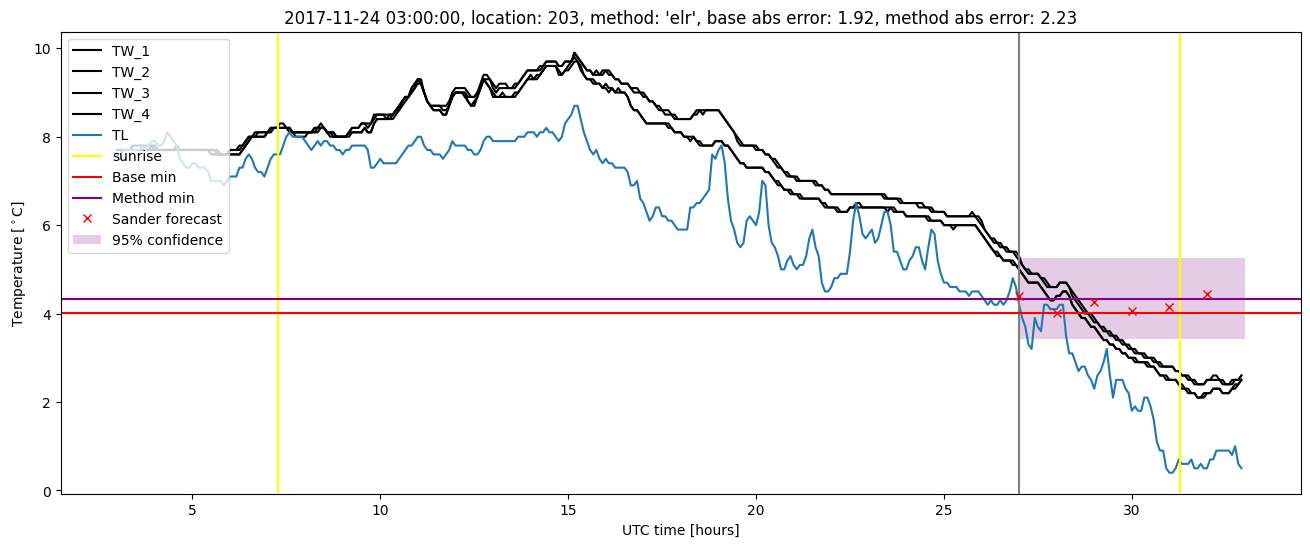
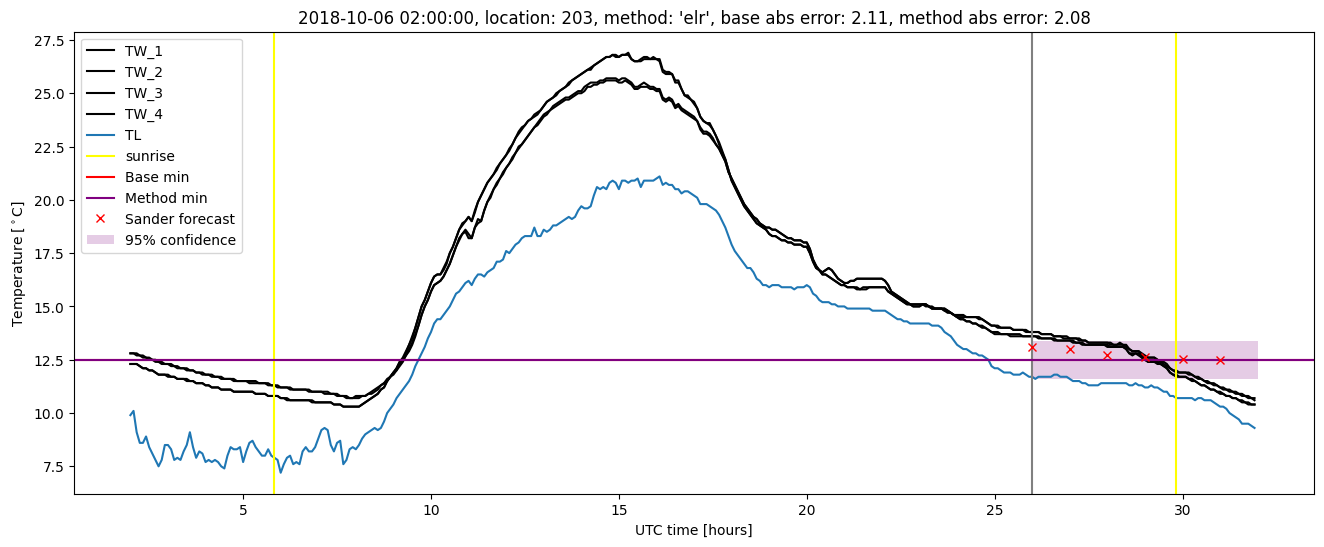
Extended logistic regression results
| names |
period |
power |
significance |
meanSquareError |
absError |
maxError |
CRPS |
IGN |
| baseline |
winter 2016 |
0.984 |
0.000e+00 |
0.445 |
0.507 |
2.897 |
NaN |
NaN |
| elr |
winter 2016 |
0.984 |
0.000e+00 |
0.363 |
0.463 |
2.380 |
0.551 |
4.864 |
| baseline |
winter 2017 |
0.967 |
0.094 |
0.486 |
0.528 |
2.411 |
NaN |
NaN |
| elr |
winter 2017 |
0.975 |
0.125 |
0.335 |
0.442 |
1.769 |
0.529 |
4.181 |
| baseline |
winter 2018 |
0.986 |
0.133 |
0.324 |
0.429 |
1.923 |
NaN |
NaN |
| elr |
winter 2018 |
0.993 |
0.133 |
0.298 |
0.411 |
2.228 |
0.530 |
3.590 |
| baseline |
winter 2019 |
0.993 |
0.077 |
0.375 |
0.455 |
2.413 |
NaN |
NaN |
| elr |
winter 2019 |
1.000 |
0.077 |
0.309 |
0.420 |
2.077 |
0.531 |
4.110 |
| baseline |
all |
0.983 |
0.087 |
0.408 |
0.480 |
2.897 |
NaN |
NaN |
| elr |
all |
0.988 |
0.098 |
0.328 |
0.435 |
2.380 |
0.536 |
4.219 |
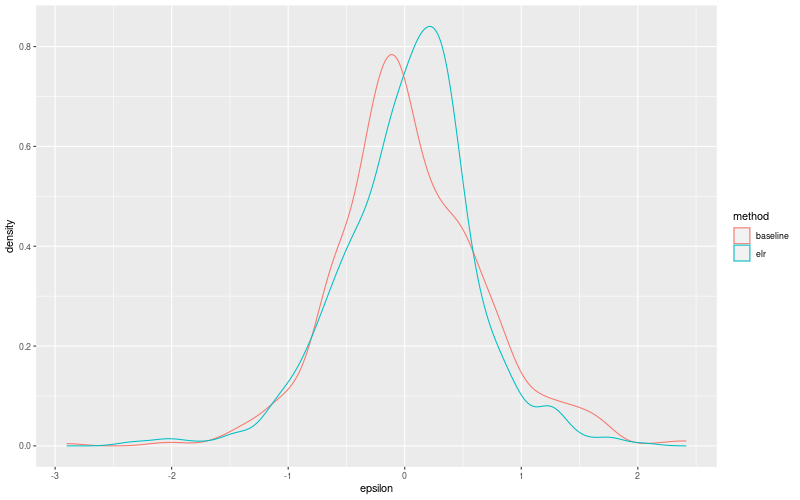
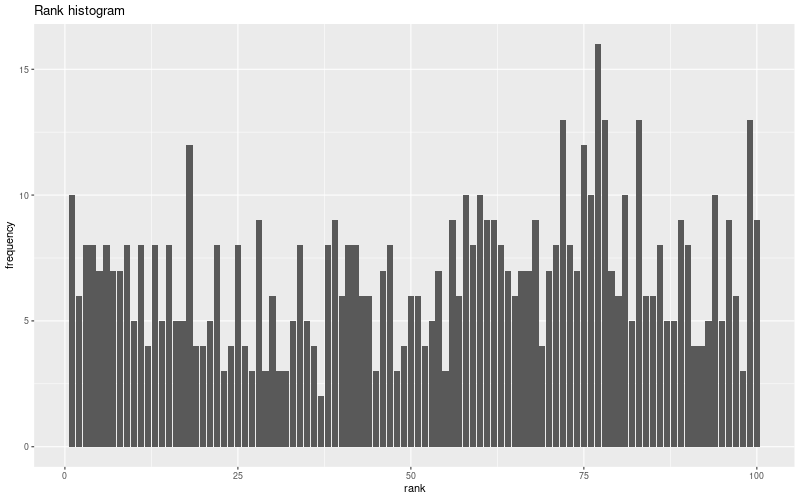
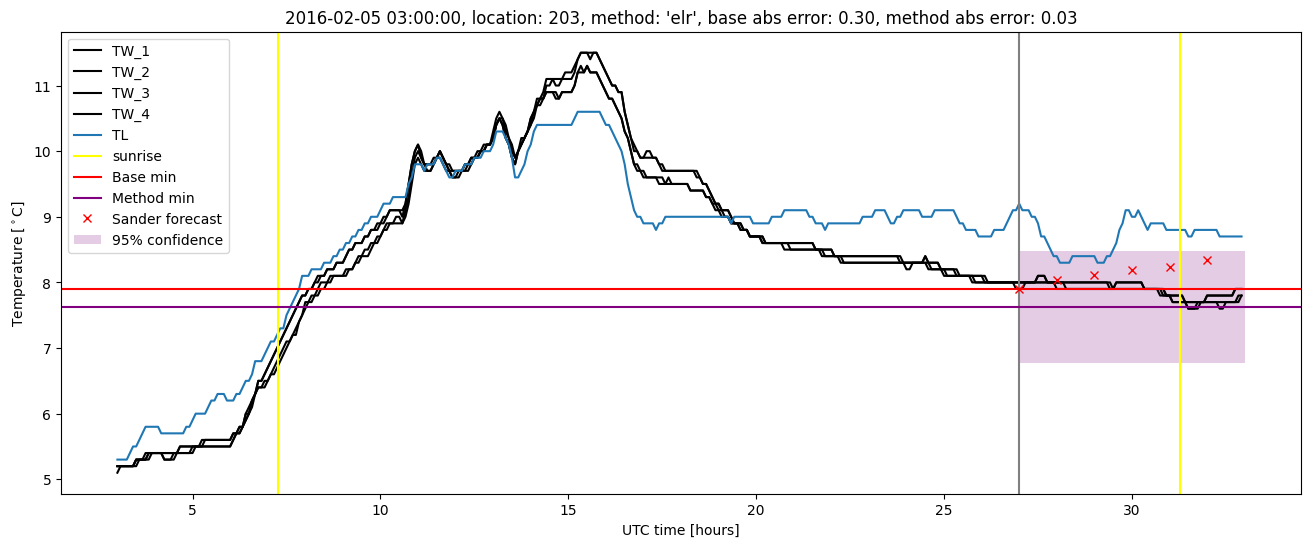
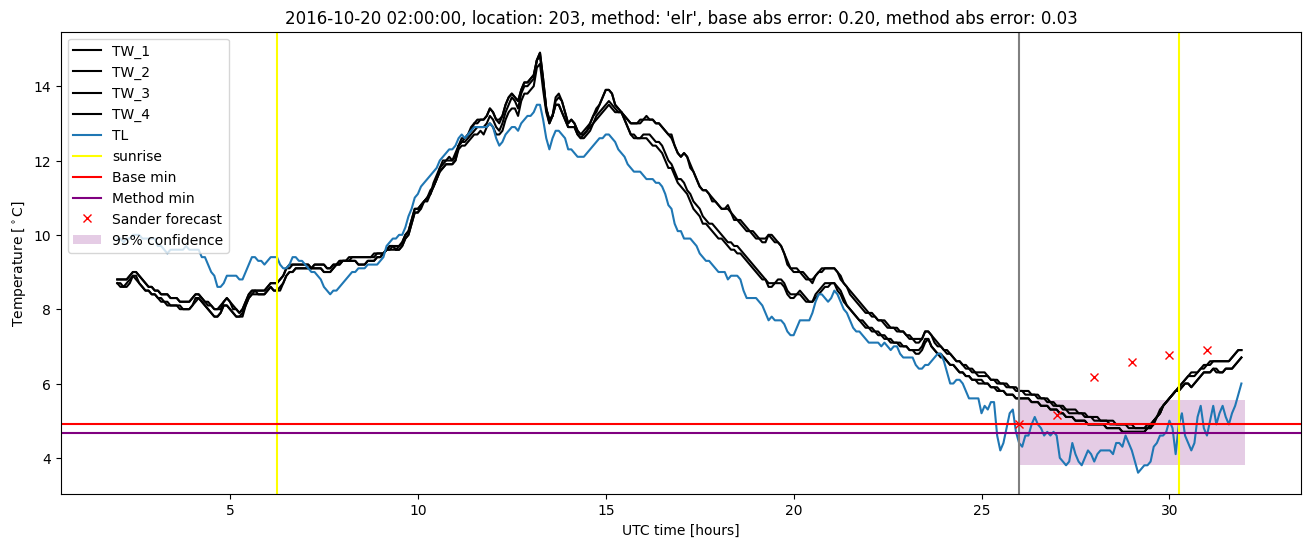
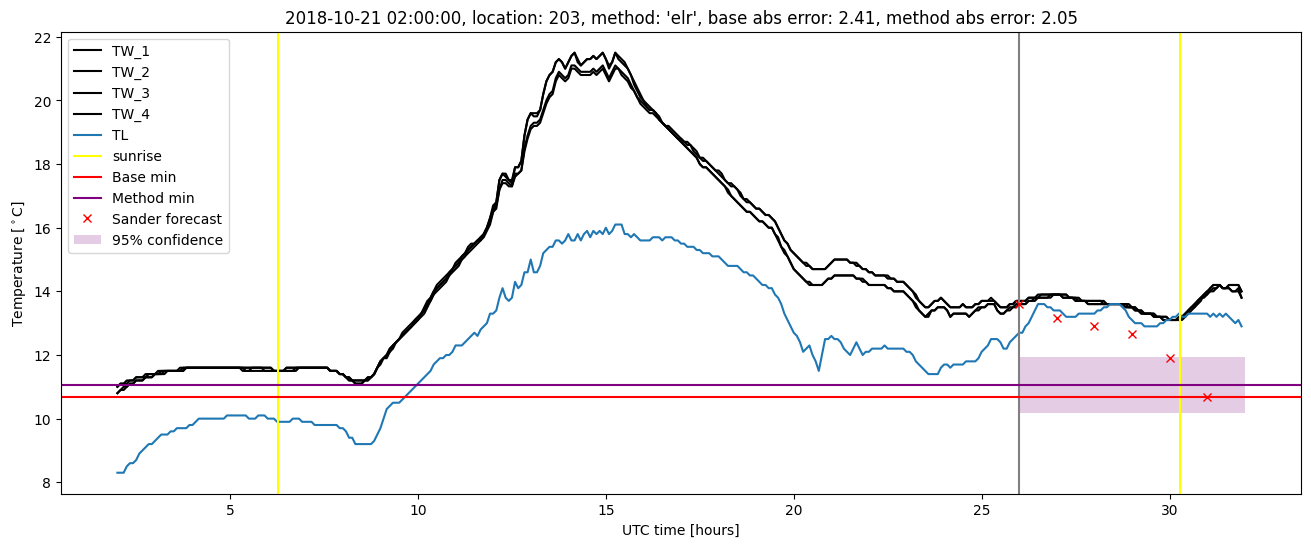
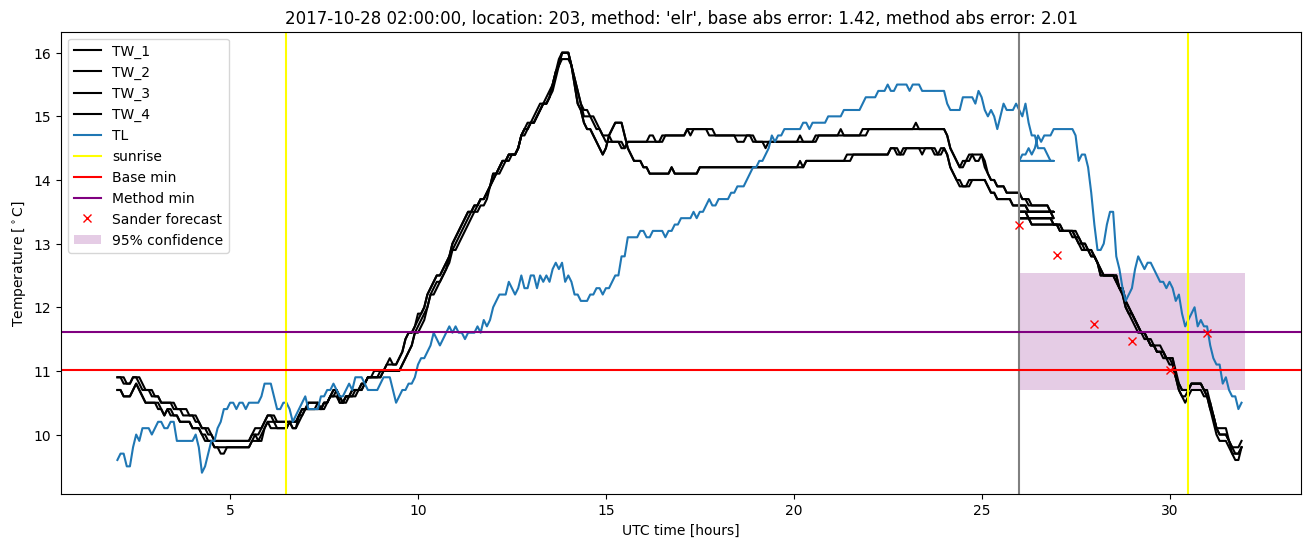
Extended logistic regression plots