GMS location: 202
Random forest results
| names |
period |
power |
significance |
meanSquareError |
absError |
maxError |
CRPS |
IGN |
| baseline |
winter 2016 |
0.984 |
0.000e+00 |
0.369 |
0.480 |
1.855 |
NaN |
NaN |
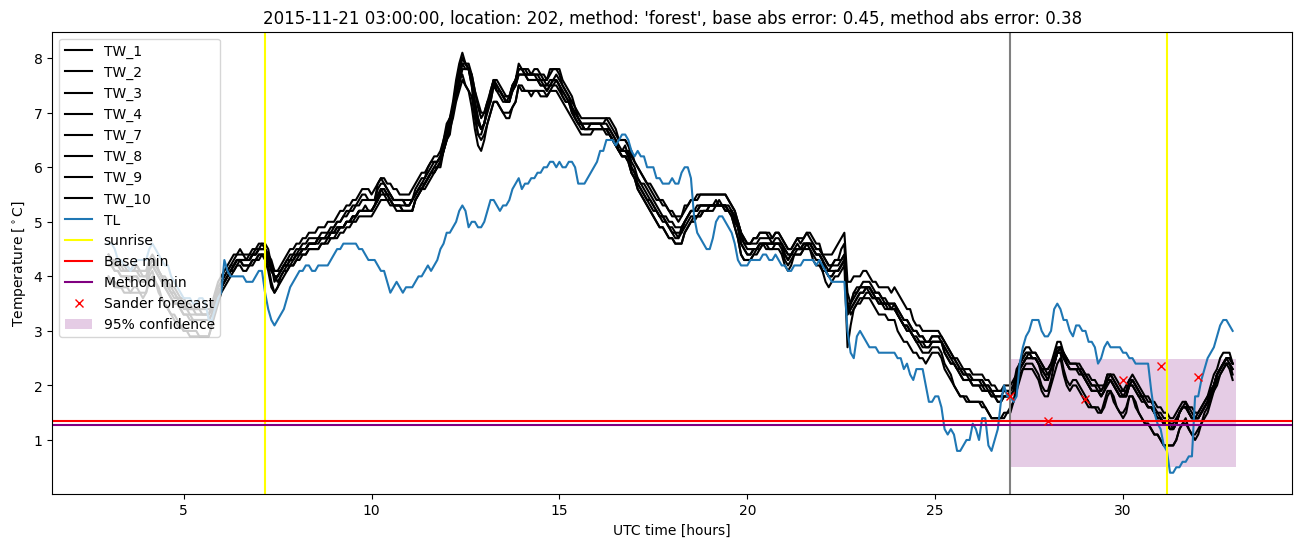
| forest |
winter 2016 |
0.995 |
0.105 |
0.260 |
0.394 |
1.388 |
0.460 |
4.193 |
| baseline |
winter 2017 |
0.960 |
0.138 |
0.470 |
0.521 |
2.313 |
NaN |
NaN |
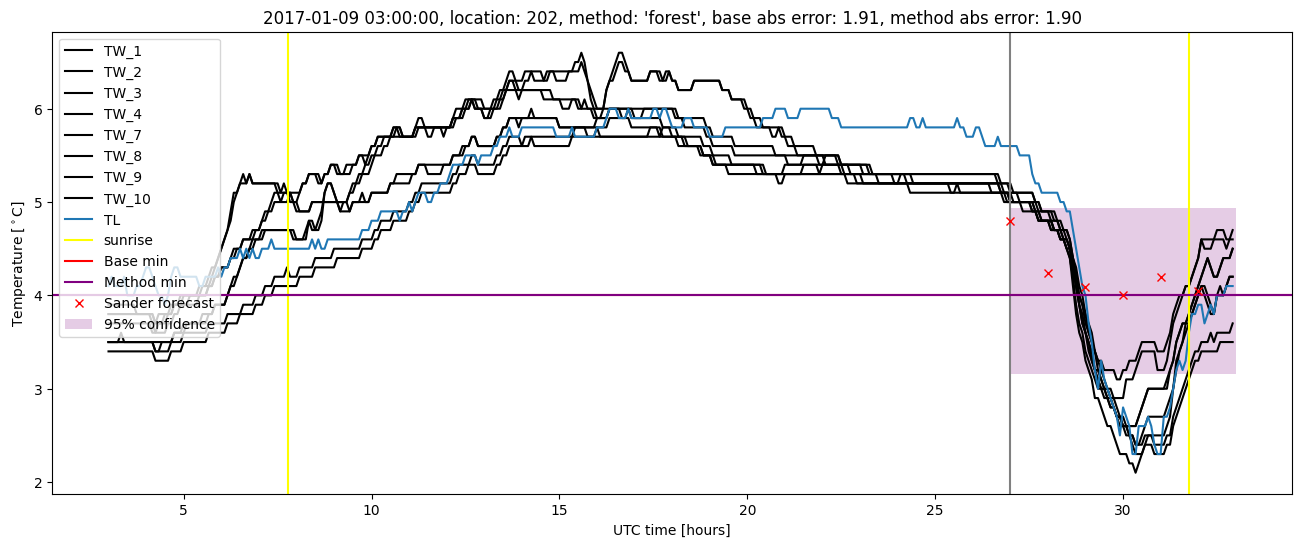
| forest |
winter 2017 |
0.960 |
0.103 |
0.303 |
0.425 |
1.901 |
0.476 |
4.976 |
| baseline |
winter 2018 |
0.987 |
0.107 |
0.350 |
0.468 |
1.558 |
NaN |
NaN |
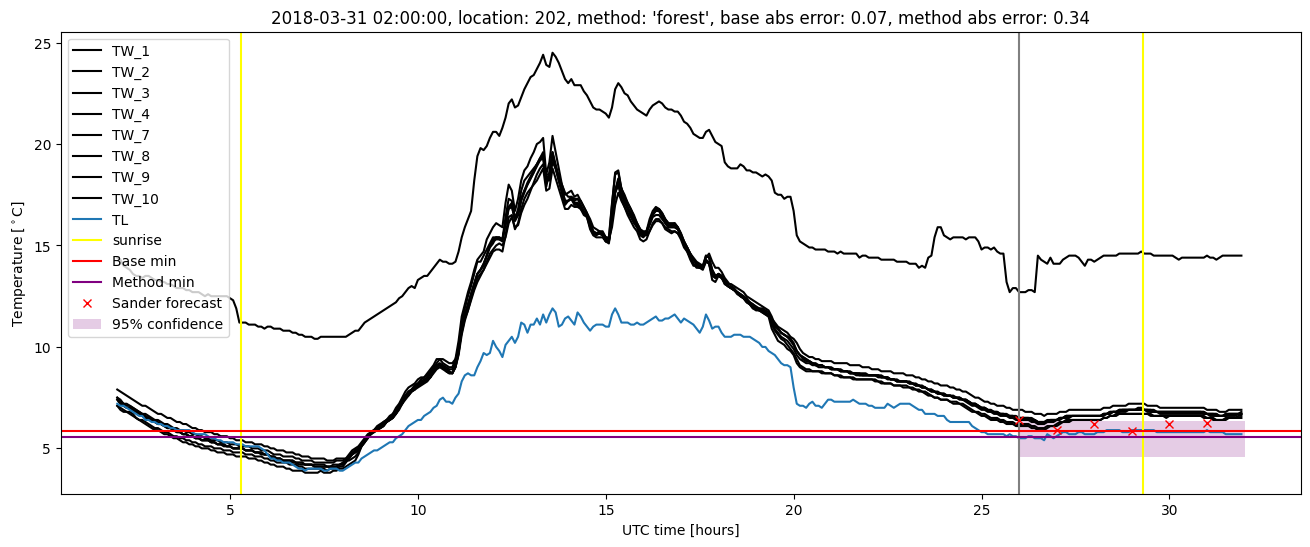
| forest |
winter 2018 |
0.980 |
0.107 |
0.262 |
0.405 |
1.536 |
0.478 |
3.077 |
| baseline |
winter 2019 |
0.993 |
0.000e+00 |
0.292 |
0.403 |
2.015 |
NaN |
NaN |
| forest |
winter 2019 |
0.993 |
0.083 |
0.234 |
0.358 |
1.735 |
0.468 |
3.492 |
| baseline |
all |
0.982 |
0.080 |
0.369 |
0.468 |
2.313 |
NaN |
NaN |
| forest |
all |
0.984 |
0.102 |
0.264 |
0.395 |
1.901 |
0.470 |
3.916 |
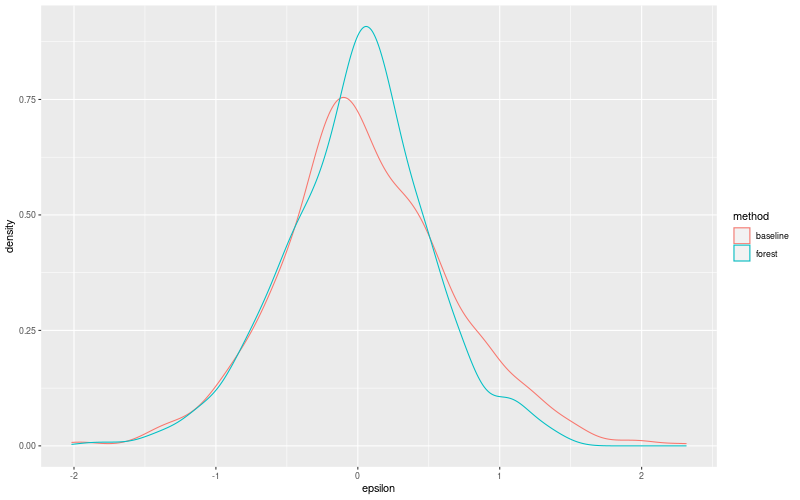
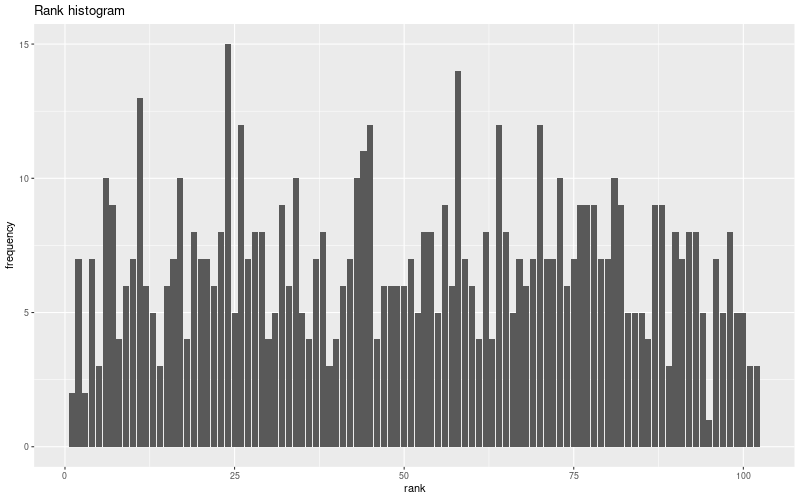
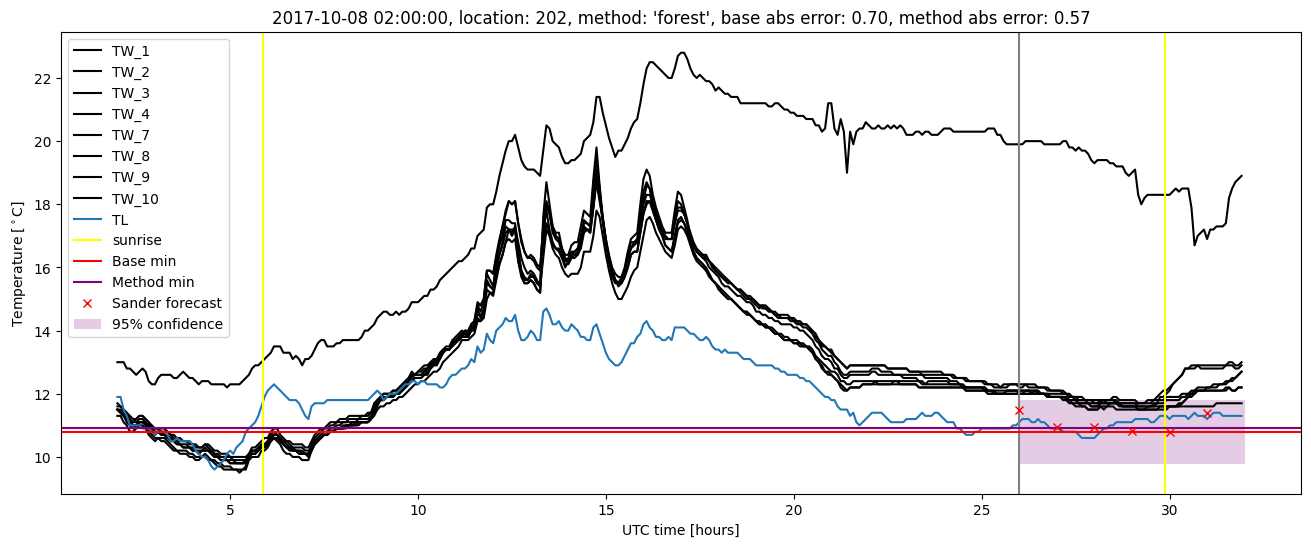
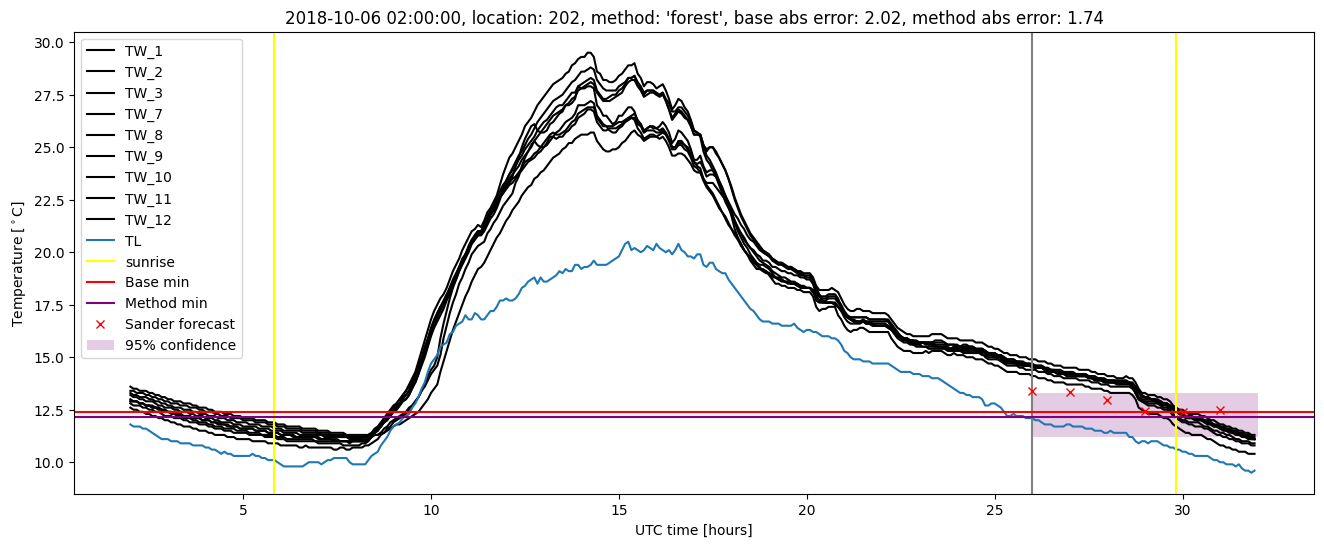
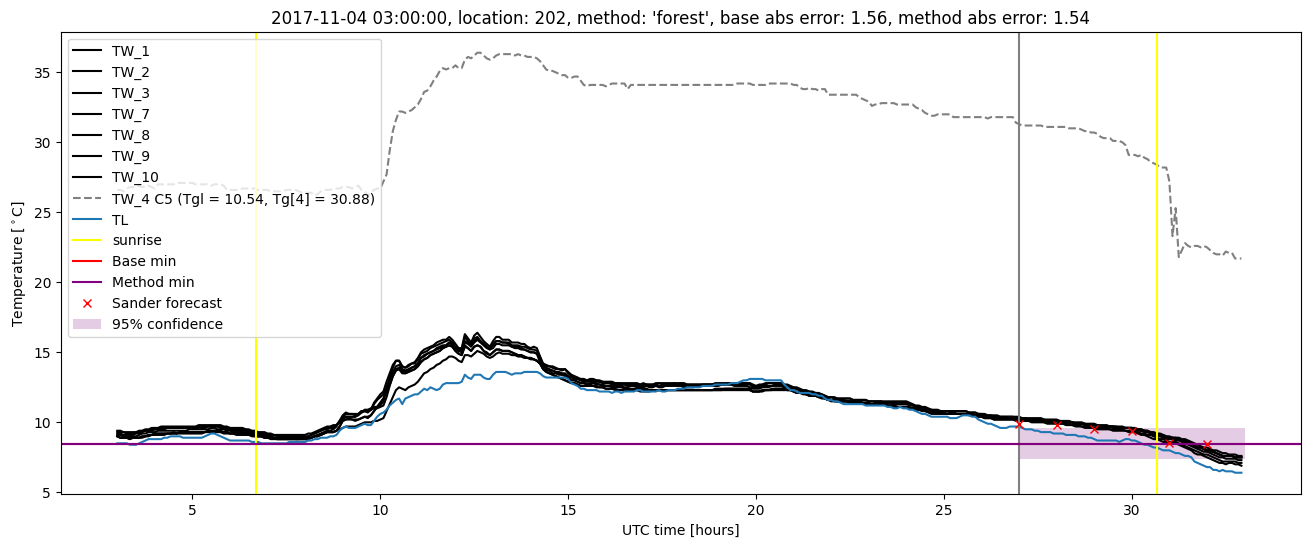
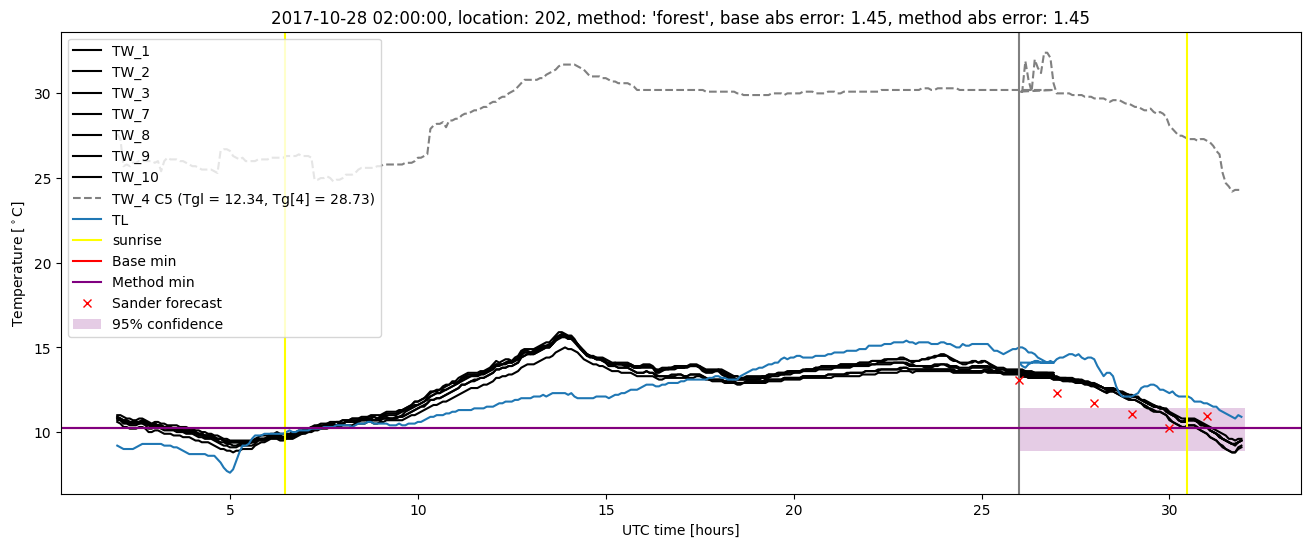
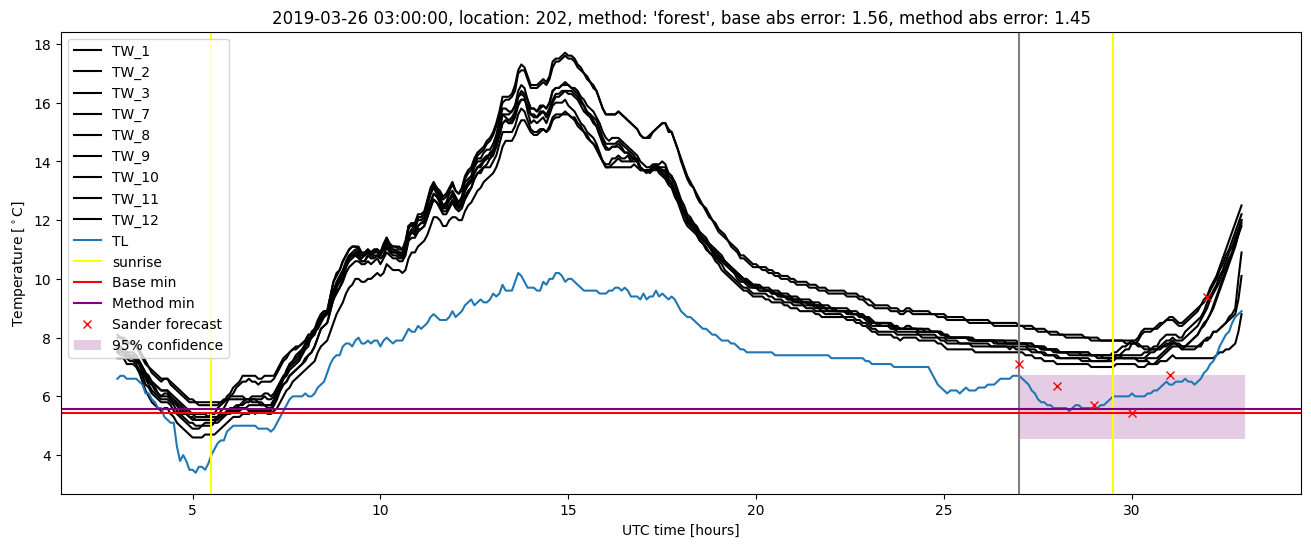
Random forest plots
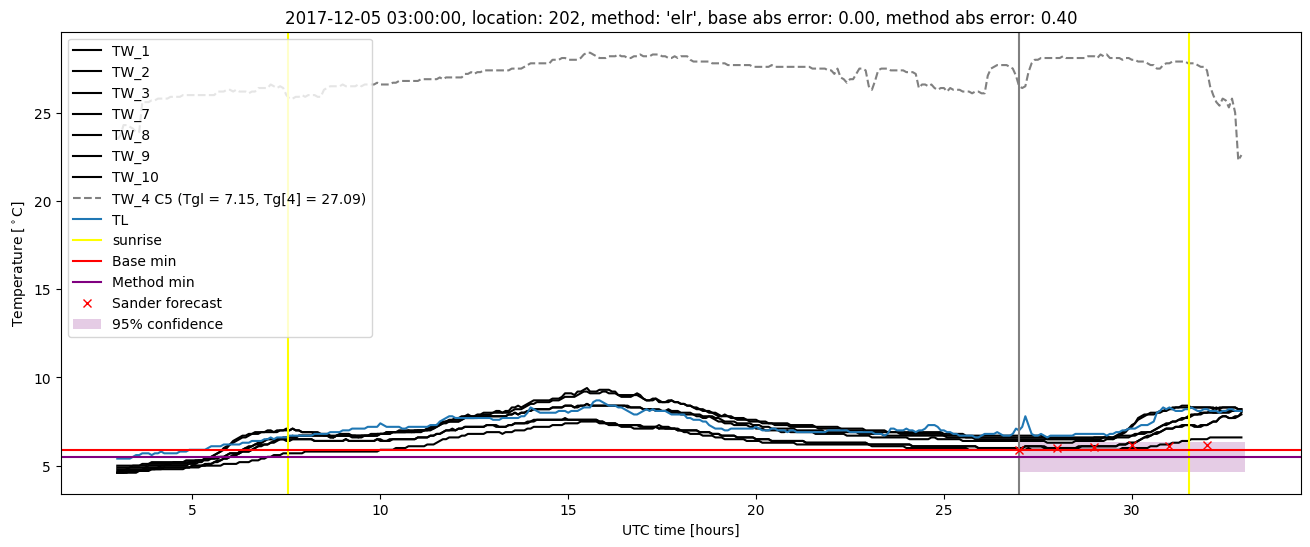
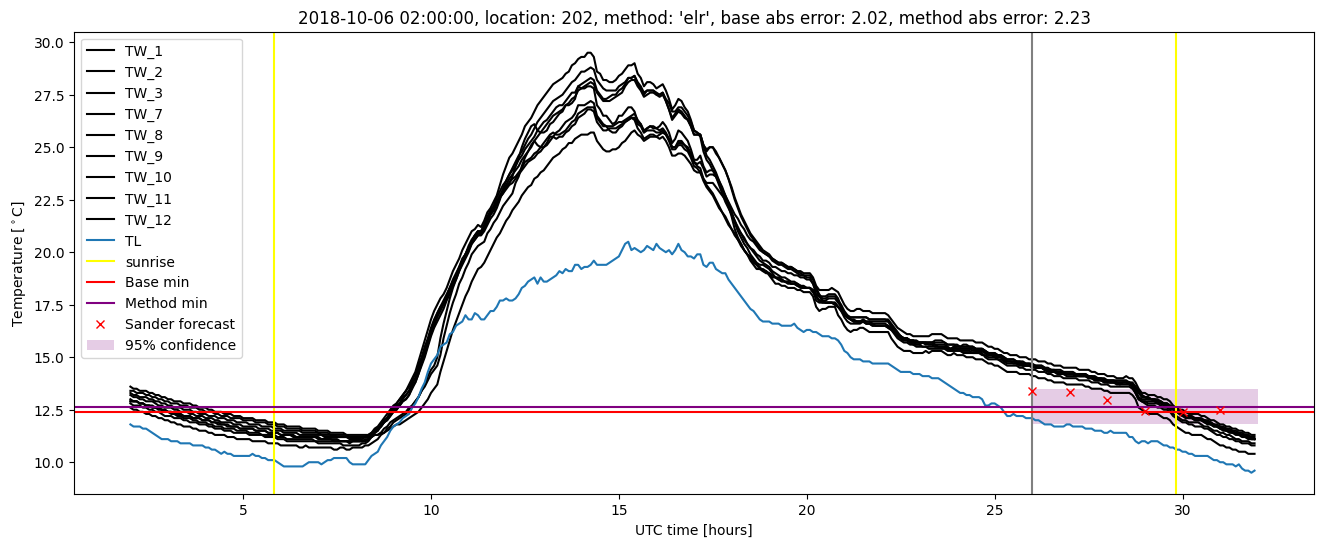
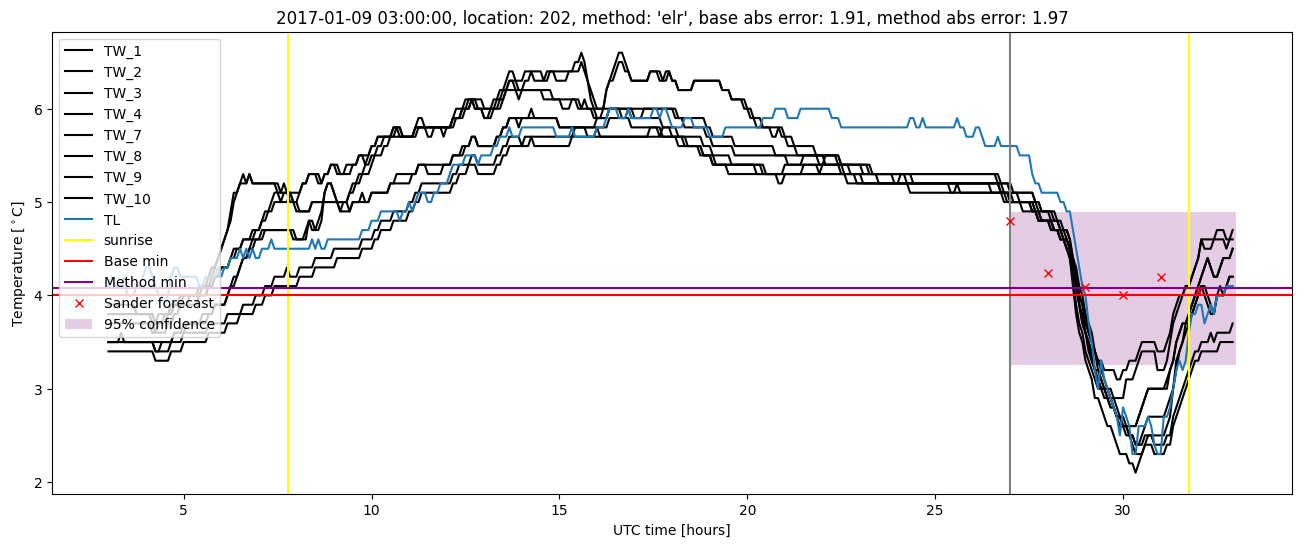
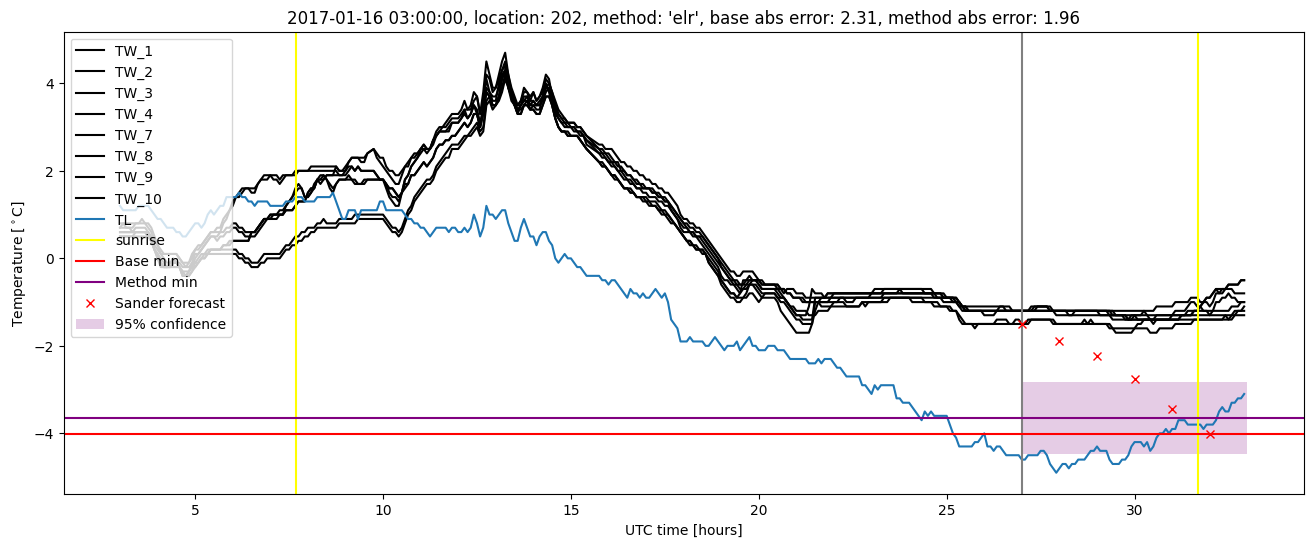
Extended logistic regression results
| names |
period |
power |
significance |
meanSquareError |
absError |
maxError |
CRPS |
IGN |
| baseline |
winter 2016 |
0.984 |
0.000e+00 |
0.369 |
0.480 |
1.855 |
NaN |
NaN |
| elr |
winter 2016 |
0.984 |
0.105 |
0.288 |
0.419 |
1.718 |
0.536 |
5.052 |
| baseline |
winter 2017 |
0.960 |
0.138 |
0.470 |
0.521 |
2.313 |
NaN |
NaN |
| elr |
winter 2017 |
0.976 |
0.069 |
0.344 |
0.442 |
1.975 |
0.519 |
5.133 |
| baseline |
winter 2018 |
0.987 |
0.107 |
0.350 |
0.468 |
1.558 |
NaN |
NaN |
| elr |
winter 2018 |
0.987 |
0.107 |
0.310 |
0.438 |
1.855 |
0.546 |
4.967 |
| baseline |
winter 2019 |
0.993 |
0.000e+00 |
0.292 |
0.403 |
2.015 |
NaN |
NaN |
| elr |
winter 2019 |
0.993 |
0.083 |
0.261 |
0.380 |
2.228 |
0.526 |
4.815 |
| baseline |
all |
0.982 |
0.080 |
0.369 |
0.468 |
2.313 |
NaN |
NaN |
| elr |
all |
0.985 |
0.091 |
0.300 |
0.420 |
2.228 |
0.533 |
4.994 |
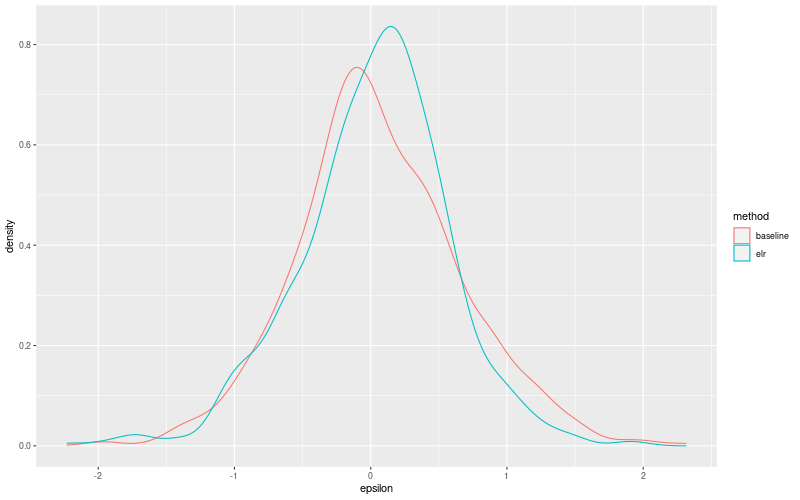
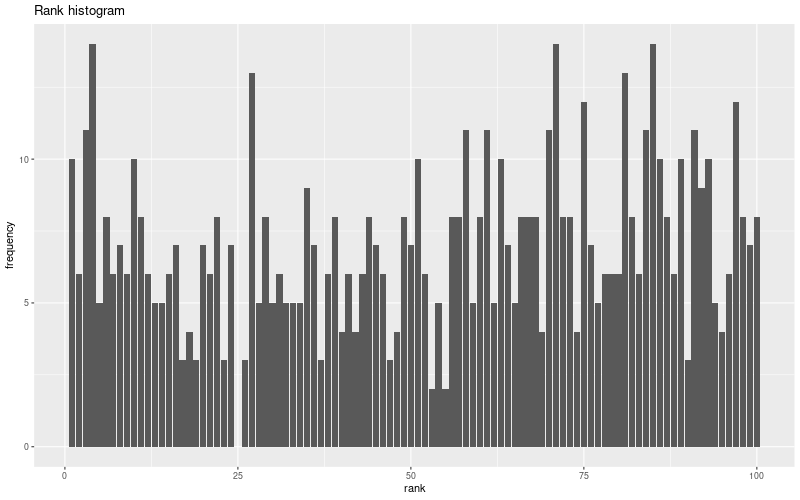
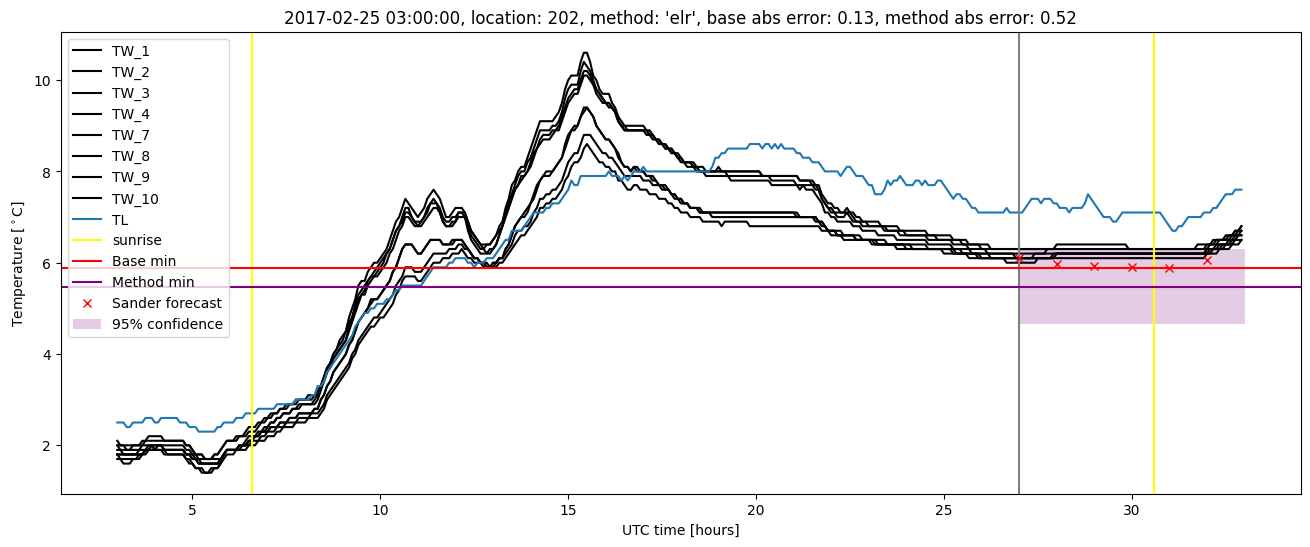
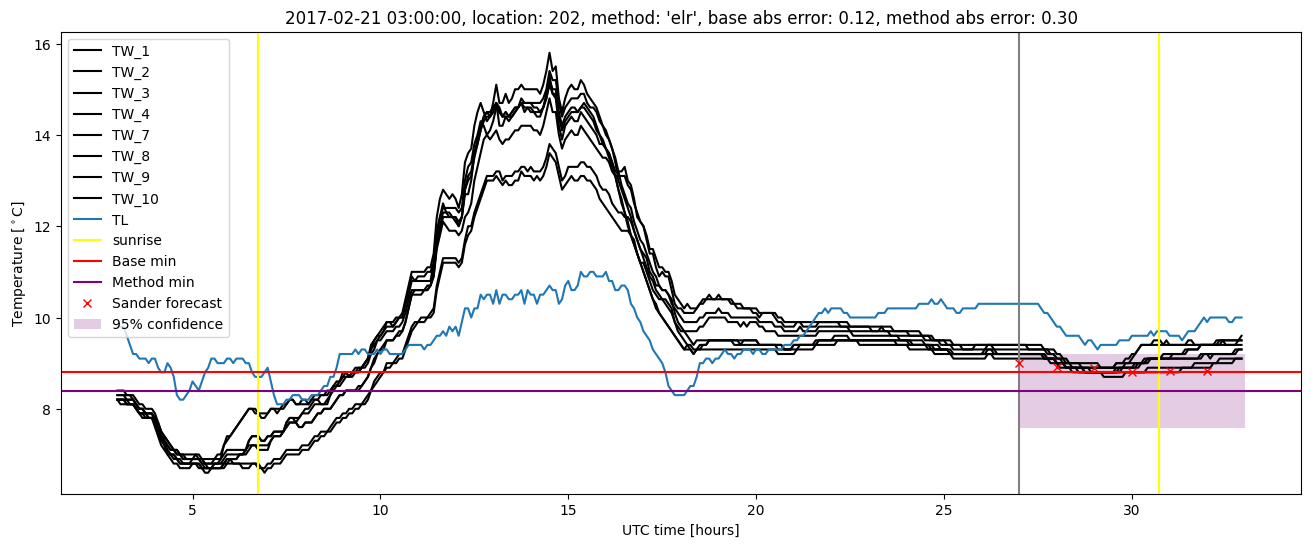
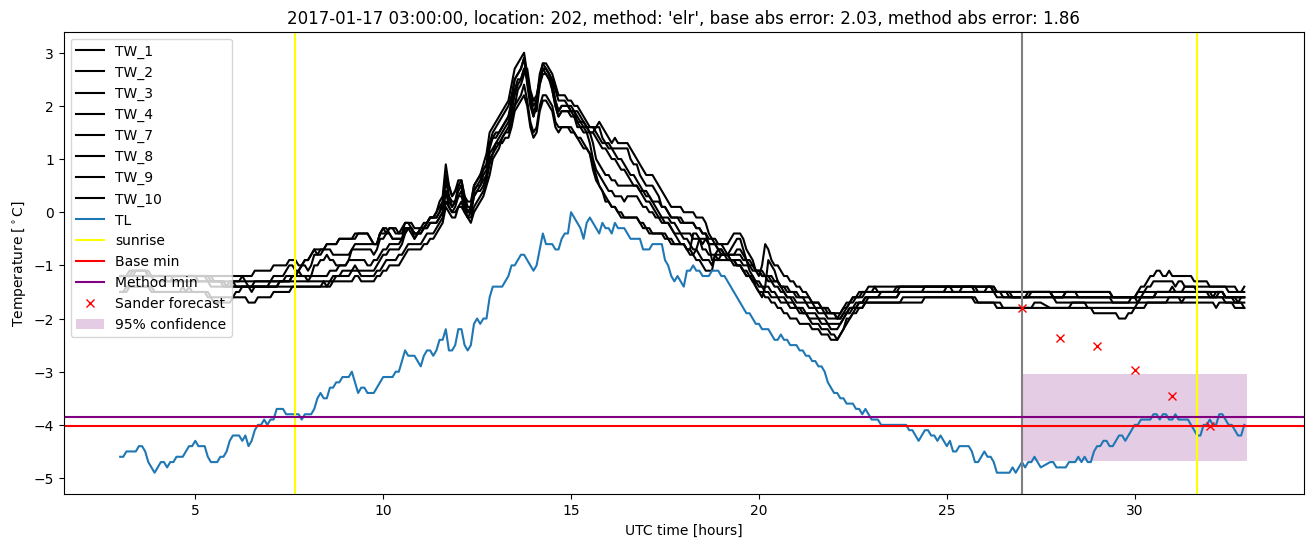
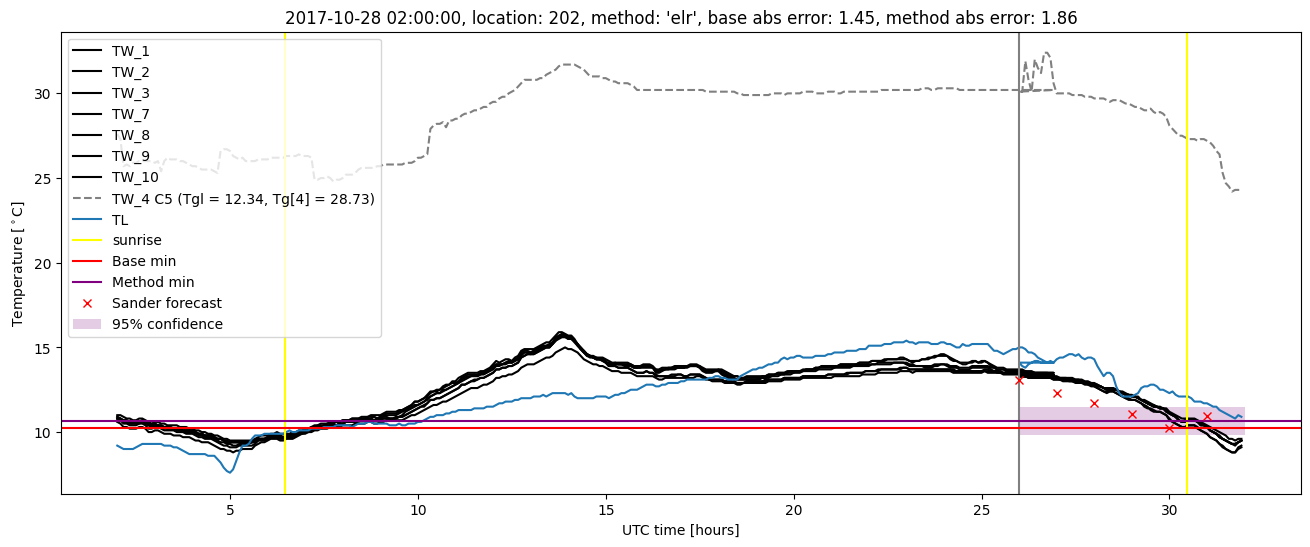
Extended logistic regression plots