GMS location: 201
Random forest results
| names |
period |
power |
significance |
meanSquareError |
absError |
maxError |
CRPS |
IGN |
| baseline |
winter 2016 |
0.961 |
0.067 |
0.382 |
0.473 |
1.919 |
NaN |
NaN |
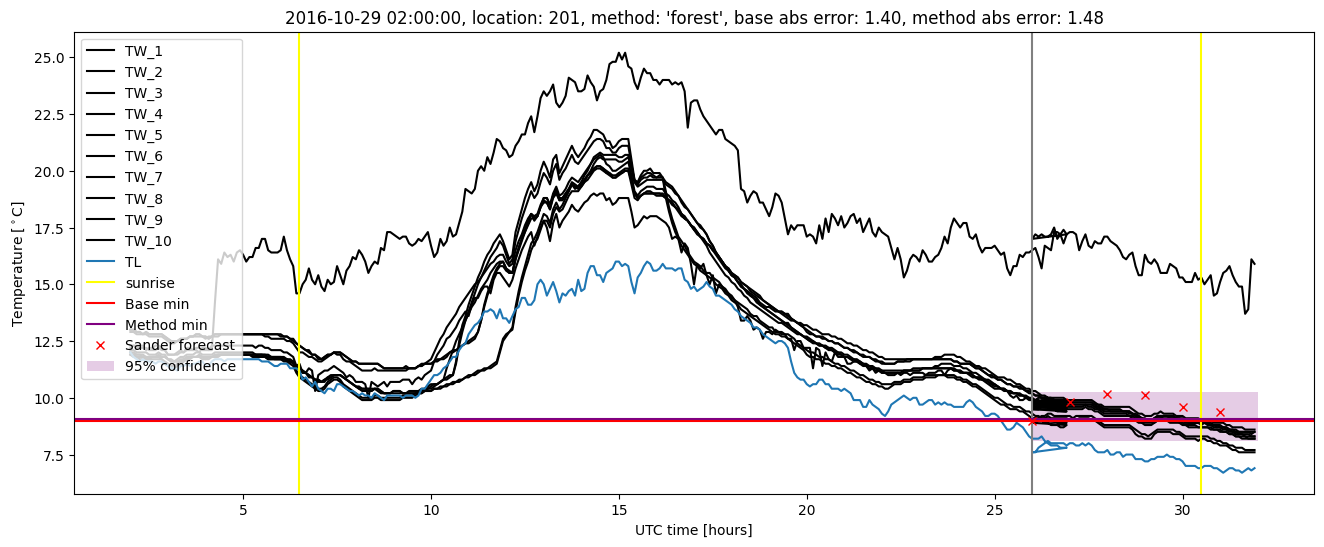
| forest |
winter 2016 |
0.990 |
0.067 |
0.264 |
0.391 |
1.426 |
0.438 |
4.066 |
| baseline |
winter 2017 |
0.968 |
0.074 |
0.494 |
0.526 |
2.080 |
NaN |
NaN |
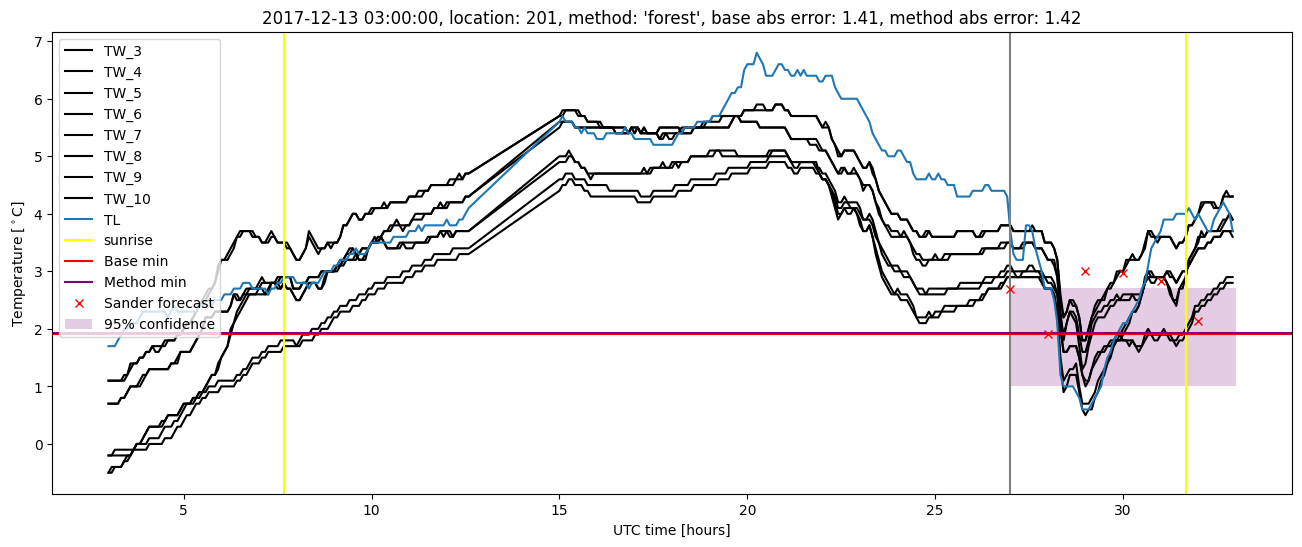
| forest |
winter 2017 |
0.968 |
0.074 |
0.329 |
0.442 |
1.626 |
0.474 |
5.036 |
| baseline |
winter 2018 |
0.986 |
0.151 |
0.335 |
0.445 |
1.718 |
NaN |
NaN |
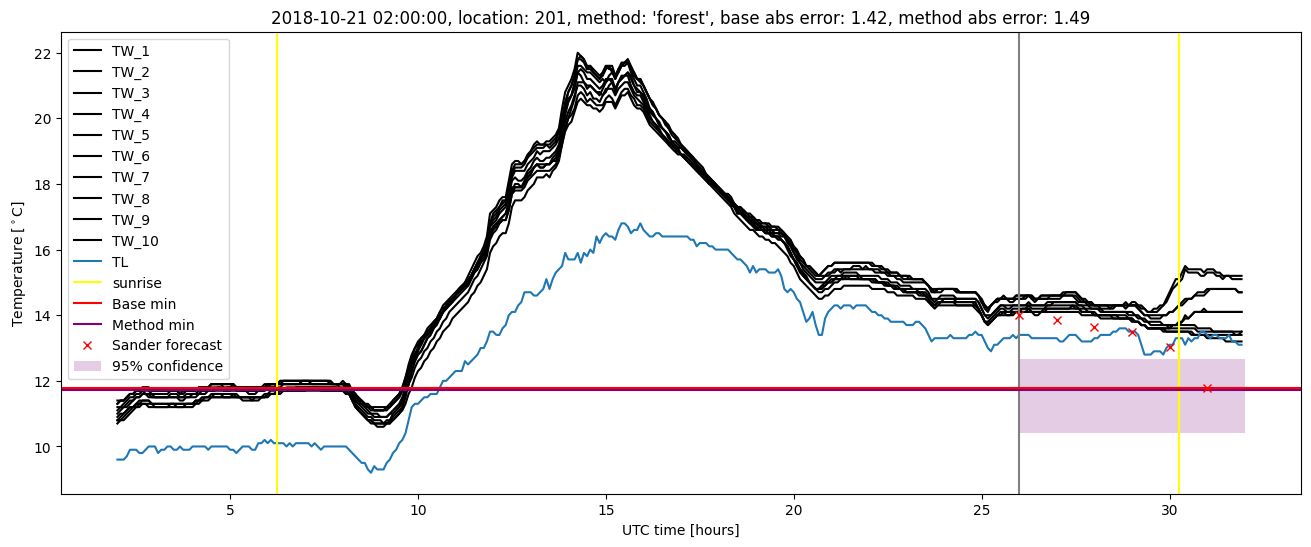
| forest |
winter 2018 |
1.000 |
0.091 |
0.273 |
0.398 |
1.421 |
0.474 |
2.926 |
| baseline |
winter 2019 |
0.993 |
0.071 |
0.284 |
0.411 |
1.453 |
NaN |
NaN |
| forest |
winter 2019 |
0.993 |
0.000e+00 |
0.223 |
0.354 |
1.492 |
0.456 |
3.014 |
| baseline |
all |
0.979 |
0.101 |
0.370 |
0.462 |
2.080 |
NaN |
NaN |
| forest |
all |
0.988 |
0.067 |
0.272 |
0.396 |
1.626 |
0.462 |
3.698 |
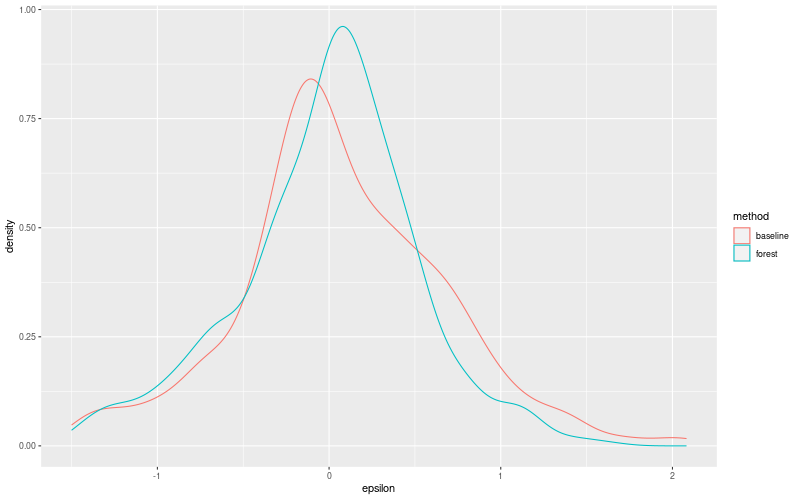
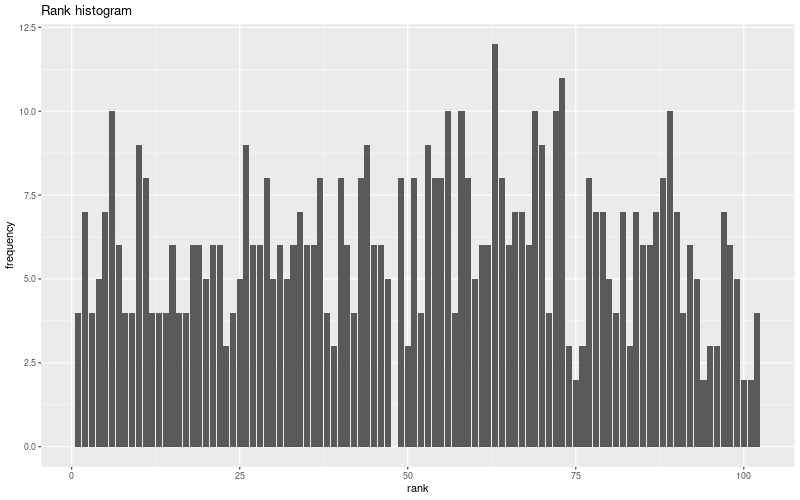
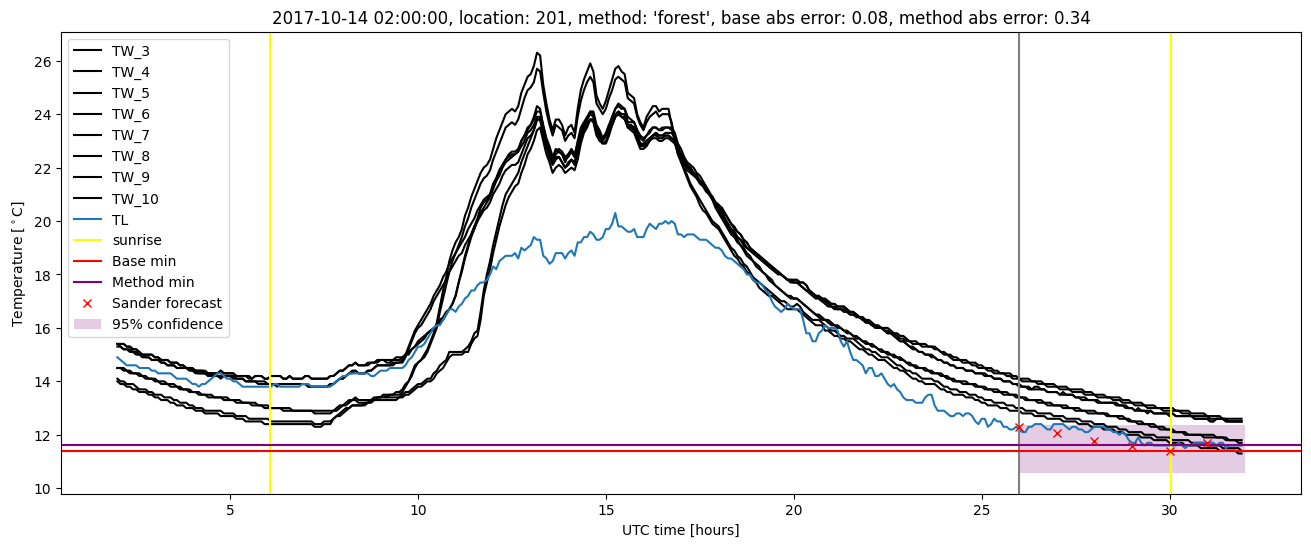
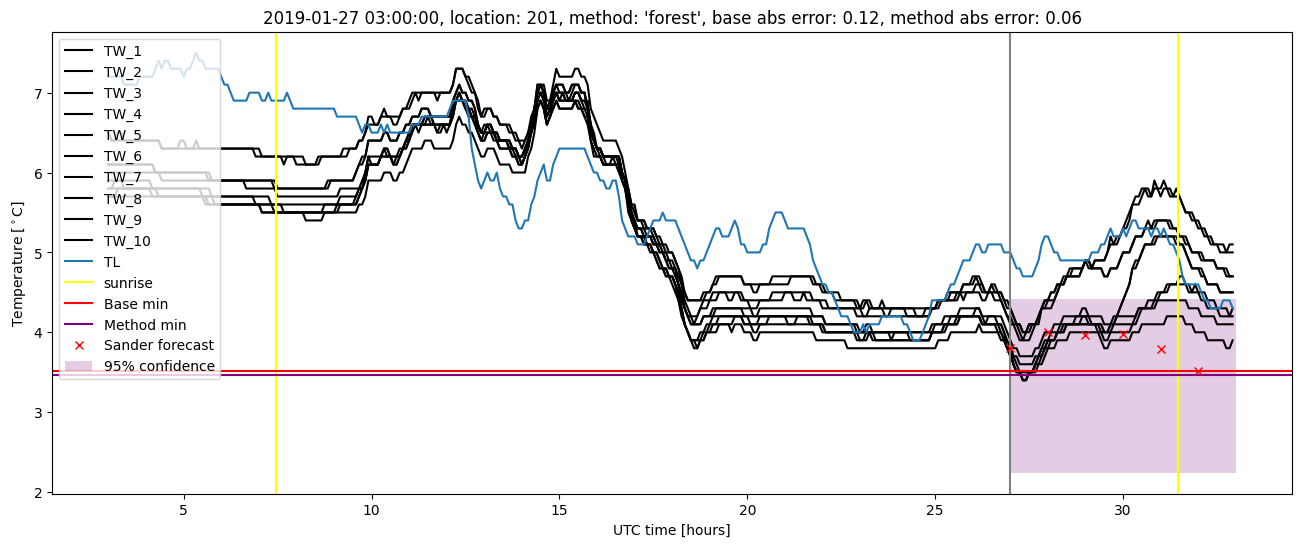
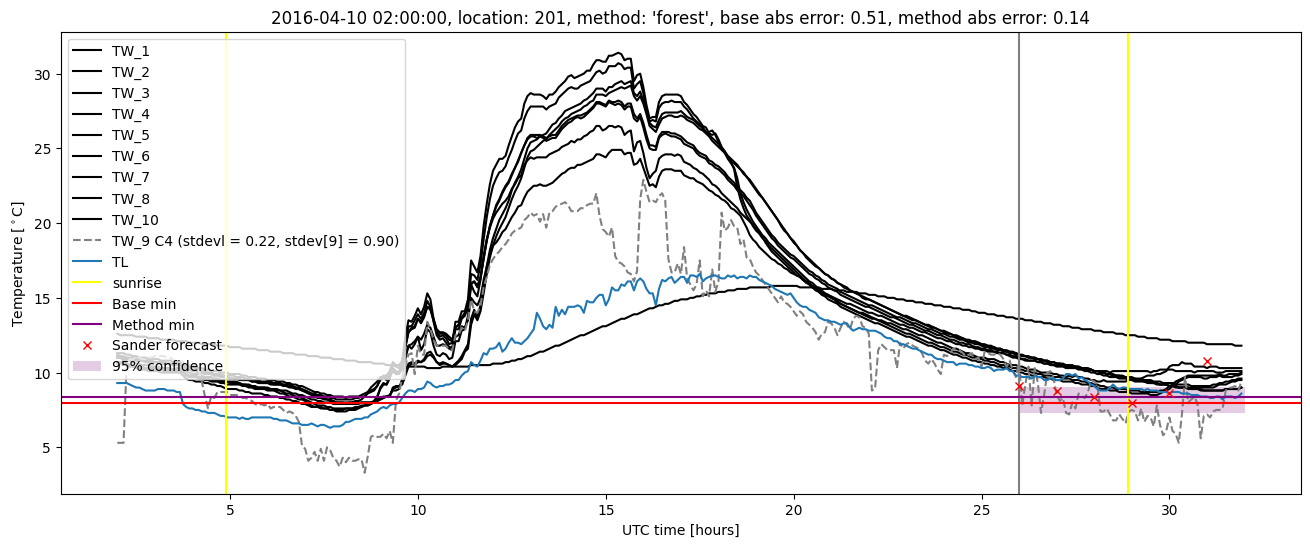
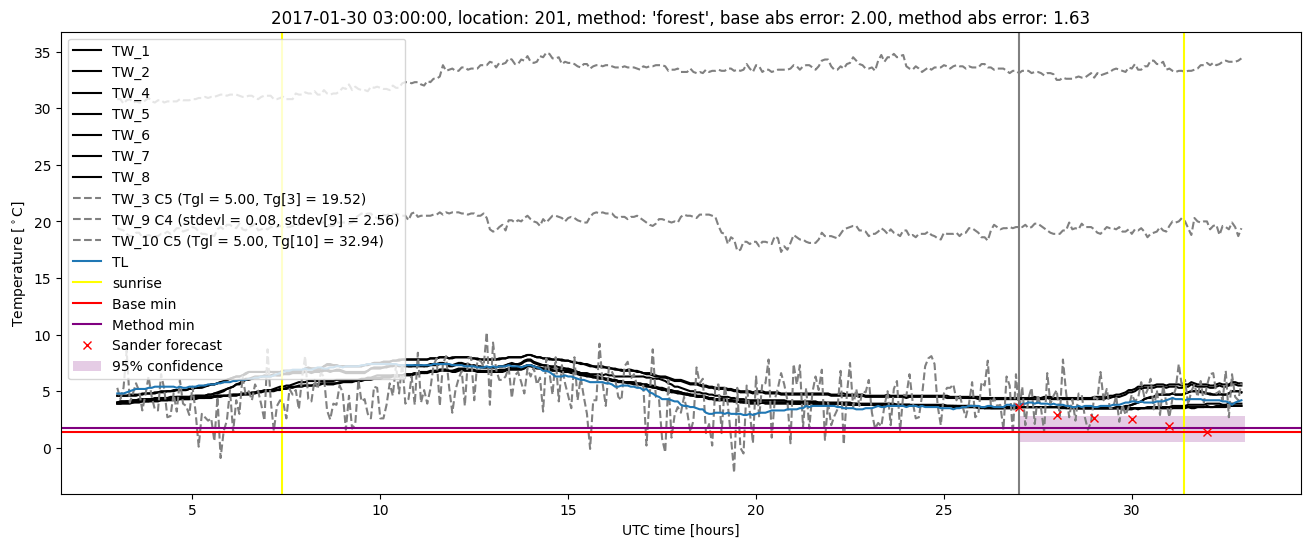
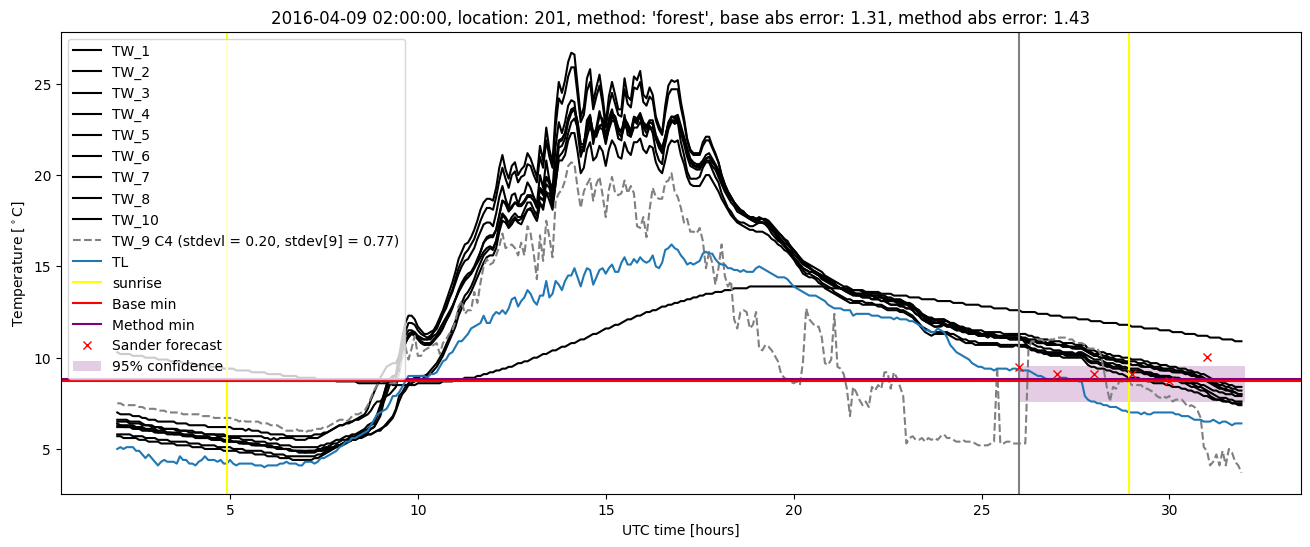
Random forest plots
Extended logistic regression results
| names |
period |
power |
significance |
meanSquareError |
absError |
maxError |
CRPS |
IGN |
| baseline |
winter 2016 |
0.961 |
0.067 |
0.382 |
0.473 |
1.919 |
NaN |
NaN |
| elr |
winter 2016 |
0.990 |
0.067 |
0.301 |
0.426 |
1.671 |
0.504 |
3.853 |
| baseline |
winter 2017 |
0.968 |
0.074 |
0.494 |
0.526 |
2.080 |
NaN |
NaN |
| elr |
winter 2017 |
0.968 |
0.037 |
0.423 |
0.504 |
2.032 |
0.554 |
5.397 |
| baseline |
winter 2018 |
0.986 |
0.151 |
0.335 |
0.445 |
1.718 |
NaN |
NaN |
| elr |
winter 2018 |
1.000 |
0.151 |
0.293 |
0.426 |
1.613 |
0.548 |
4.524 |
| baseline |
winter 2019 |
0.993 |
0.071 |
0.284 |
0.411 |
1.453 |
NaN |
NaN |
| elr |
winter 2019 |
1.000 |
0.071 |
0.267 |
0.399 |
1.582 |
0.512 |
3.821 |
| baseline |
all |
0.979 |
0.101 |
0.370 |
0.462 |
2.080 |
NaN |
NaN |
| elr |
all |
0.990 |
0.090 |
0.320 |
0.438 |
2.032 |
0.531 |
4.426 |
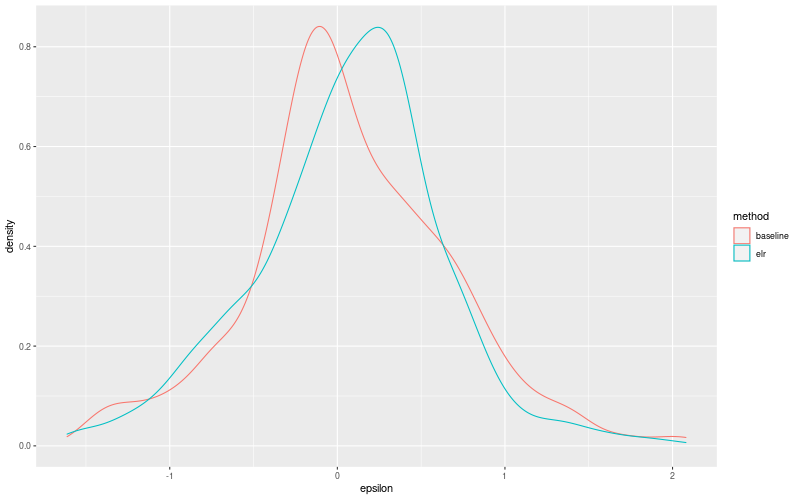
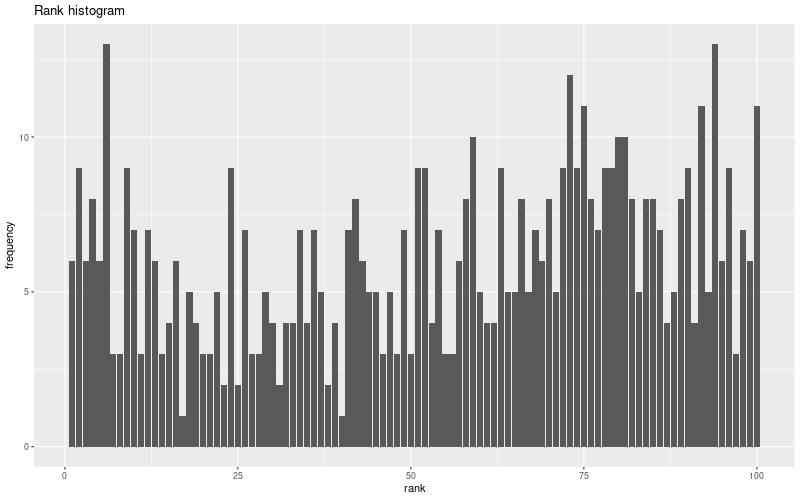
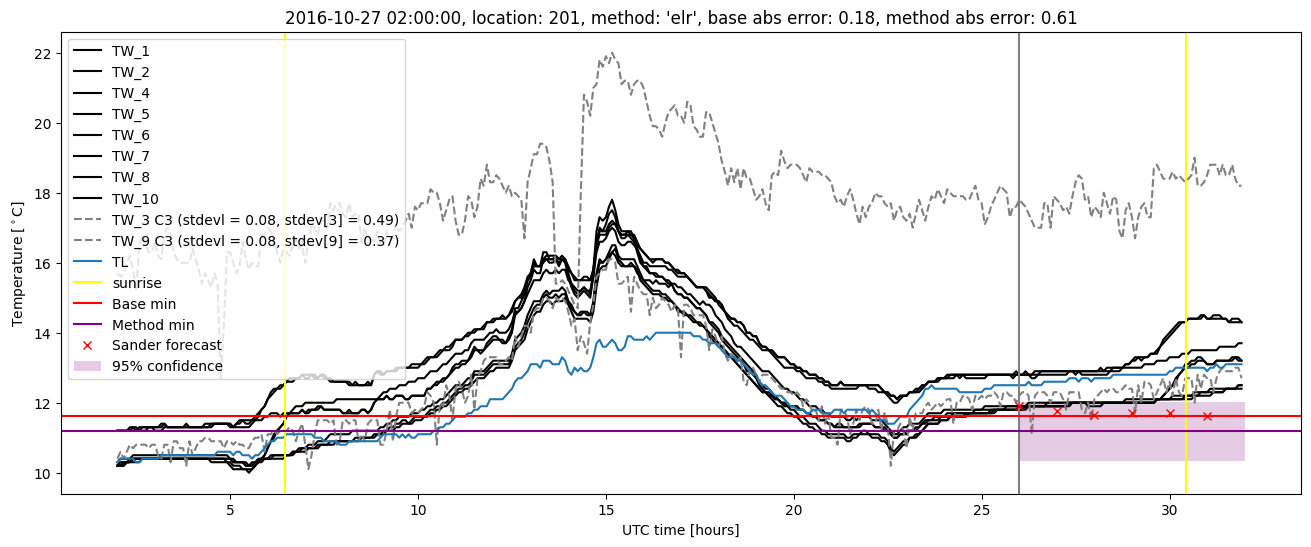
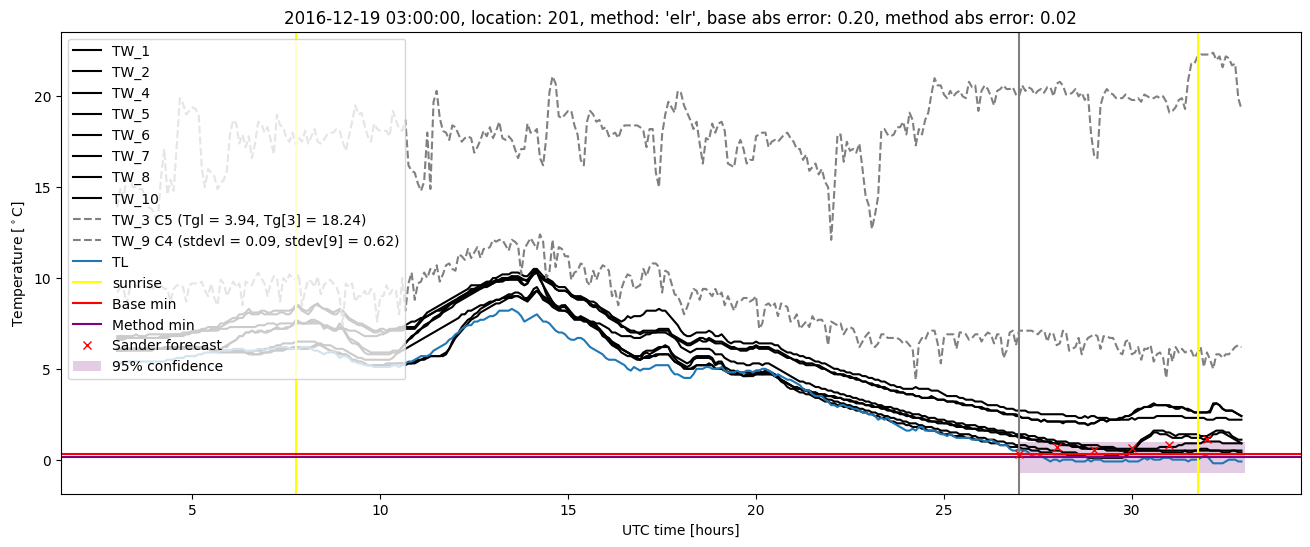
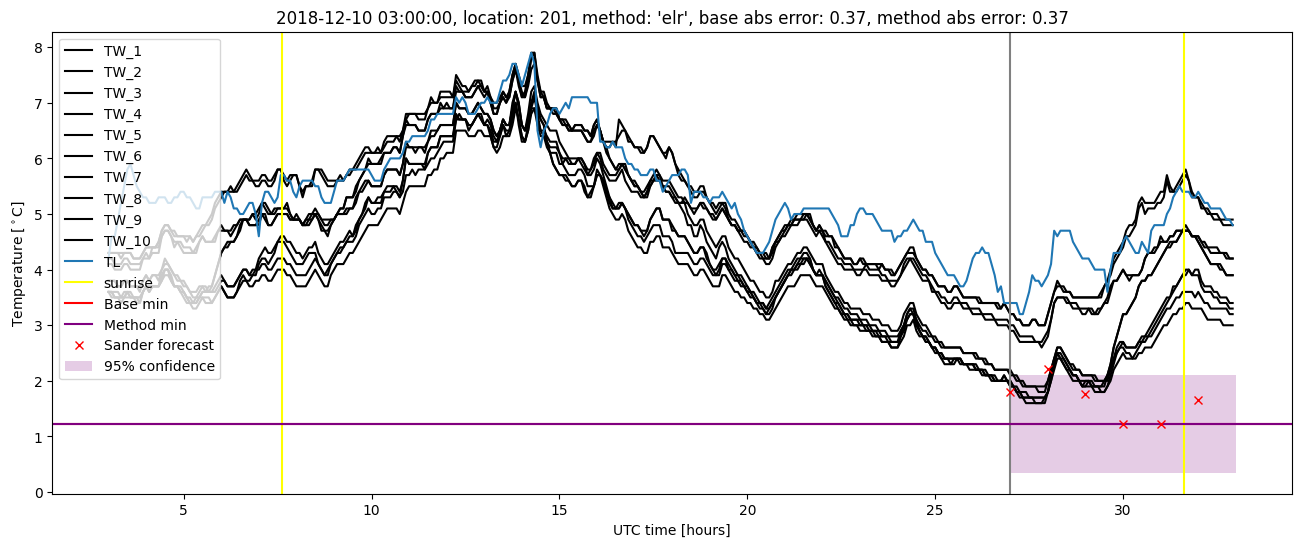
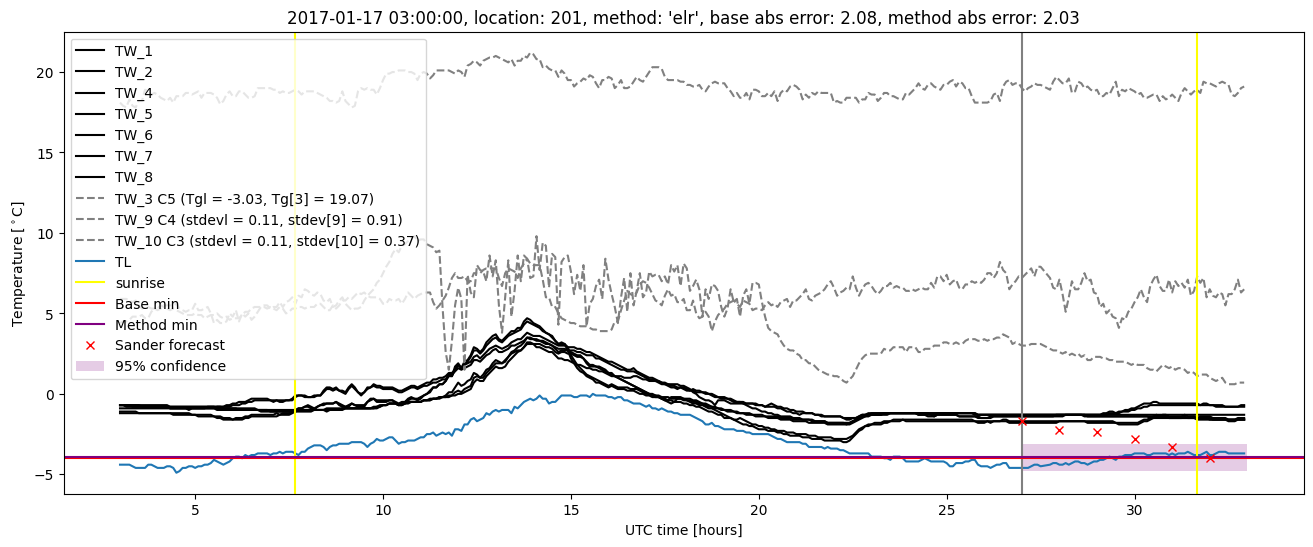
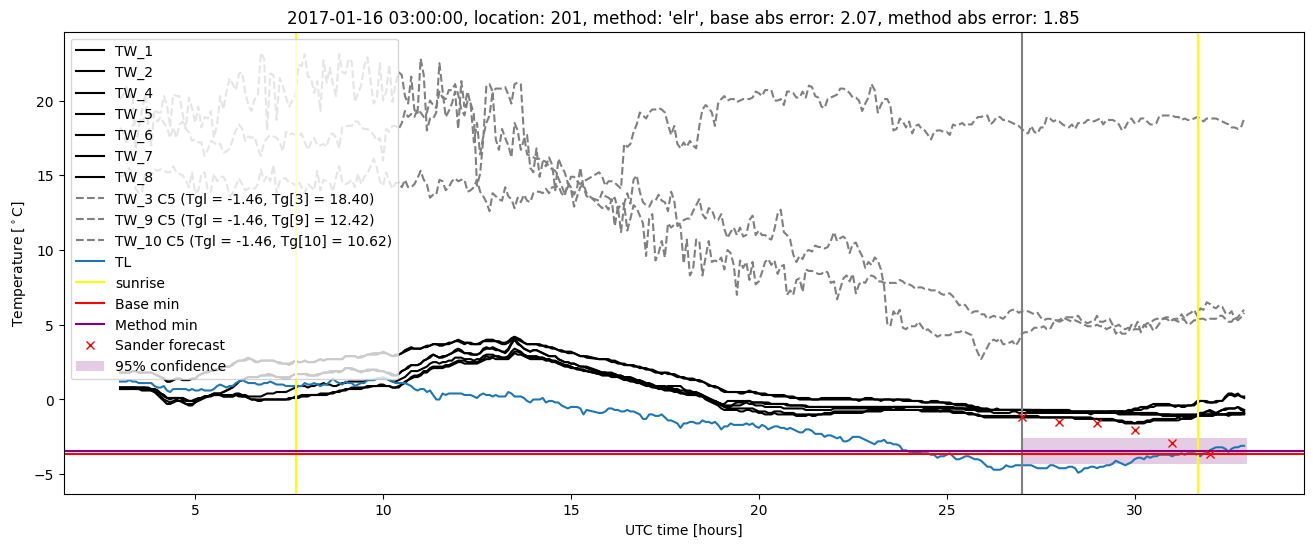
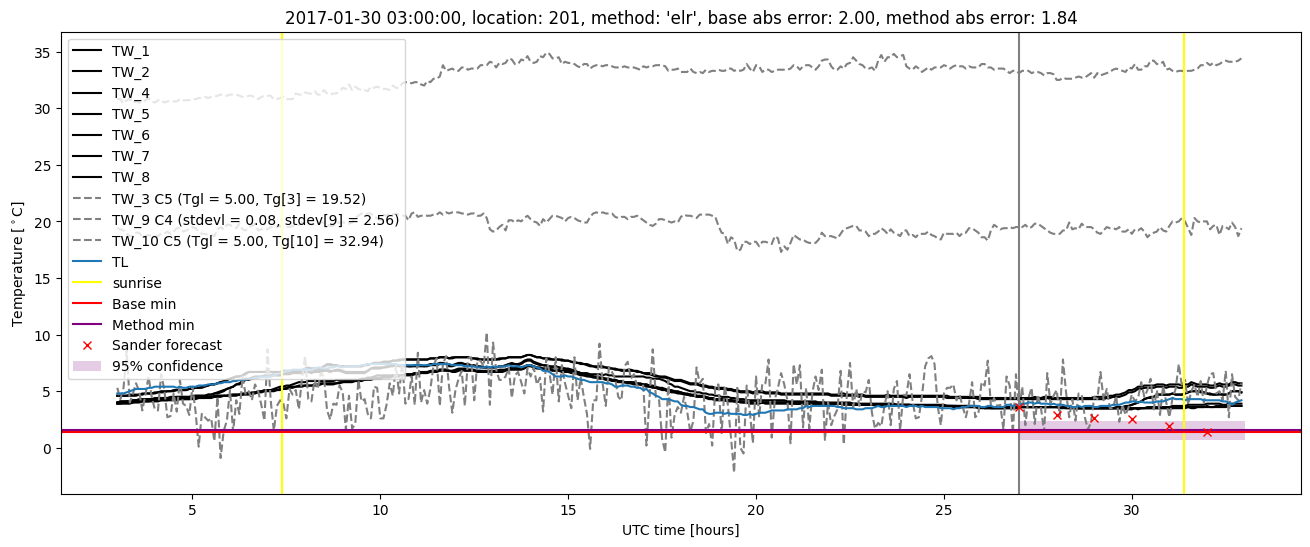
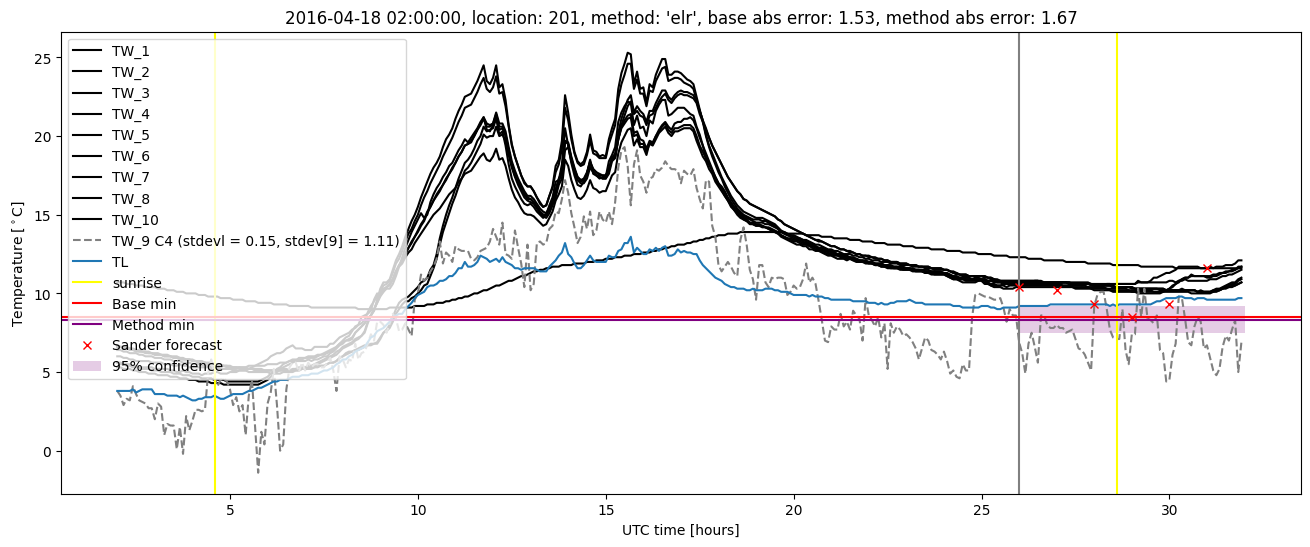
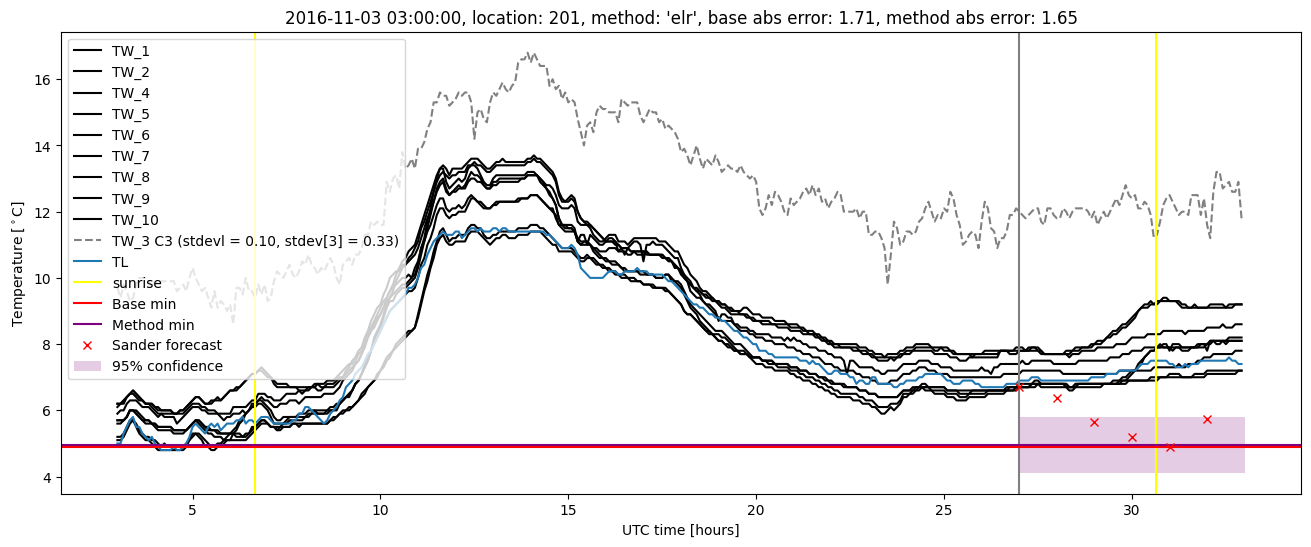
Extended logistic regression plots