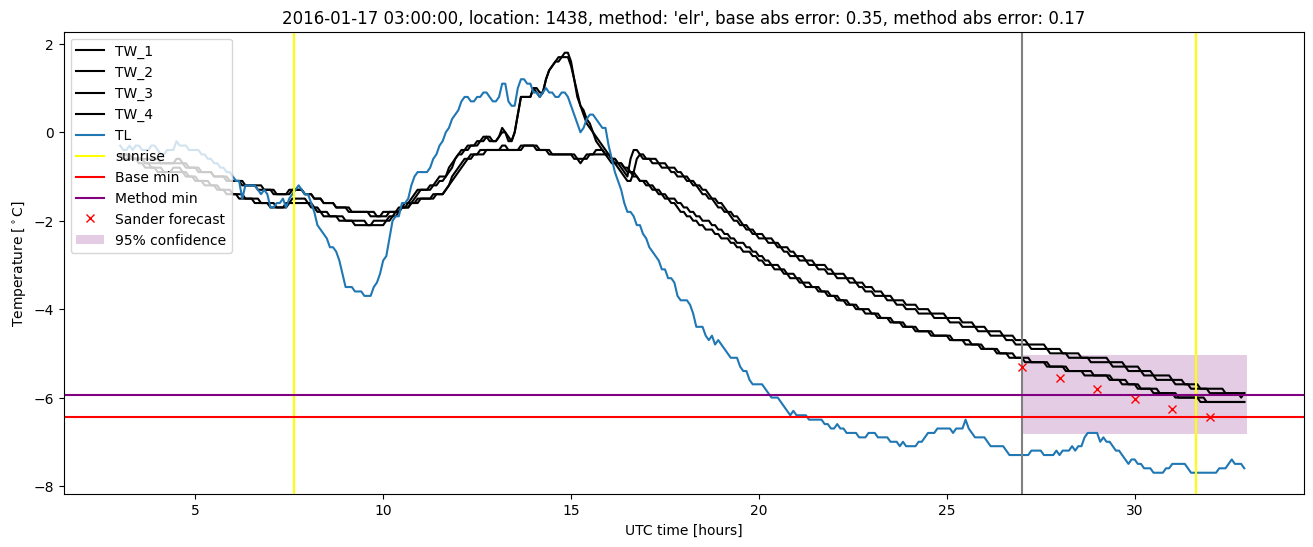
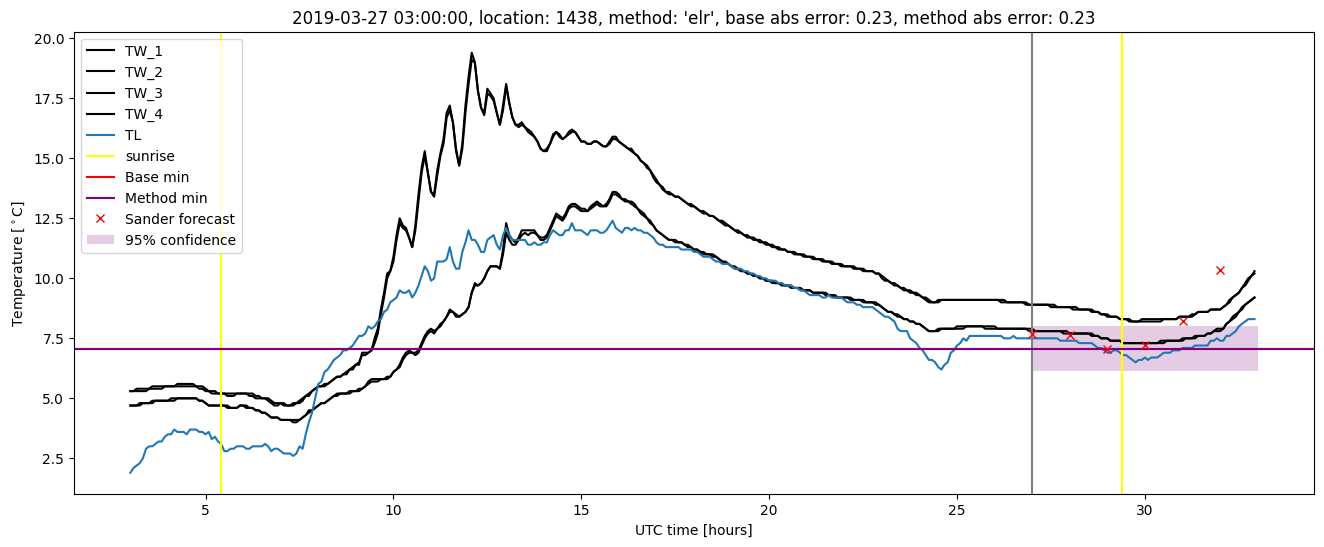
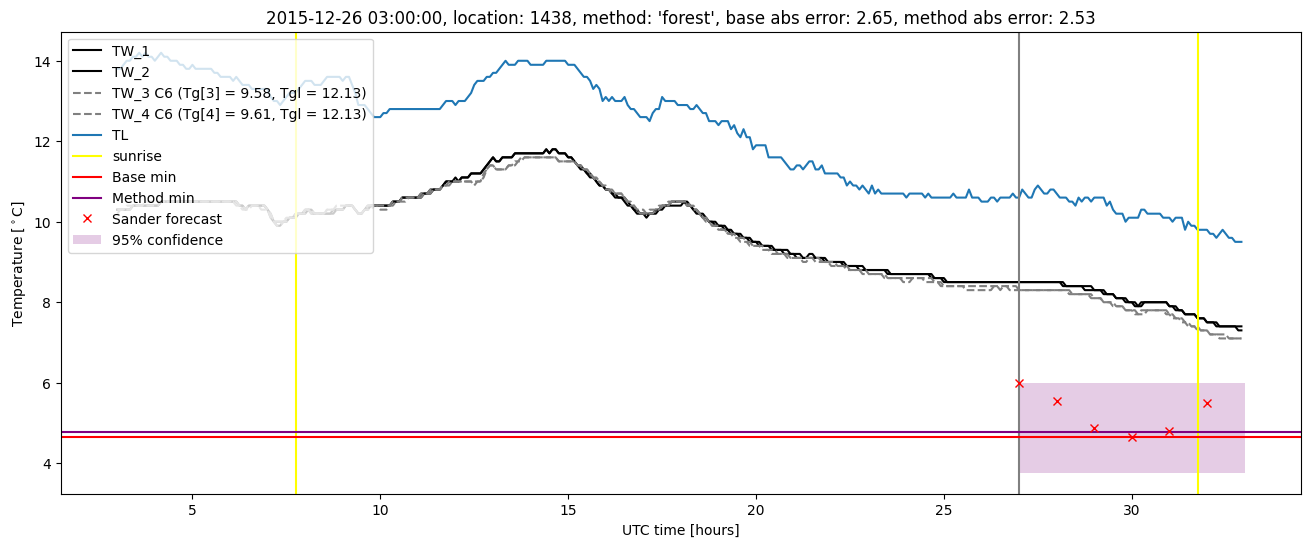
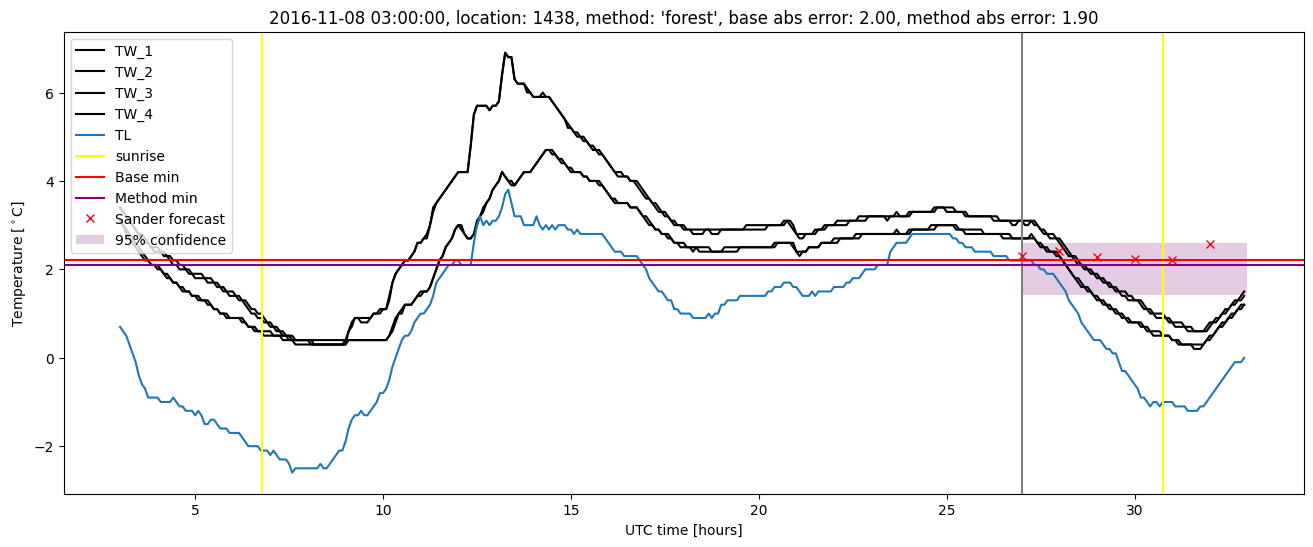
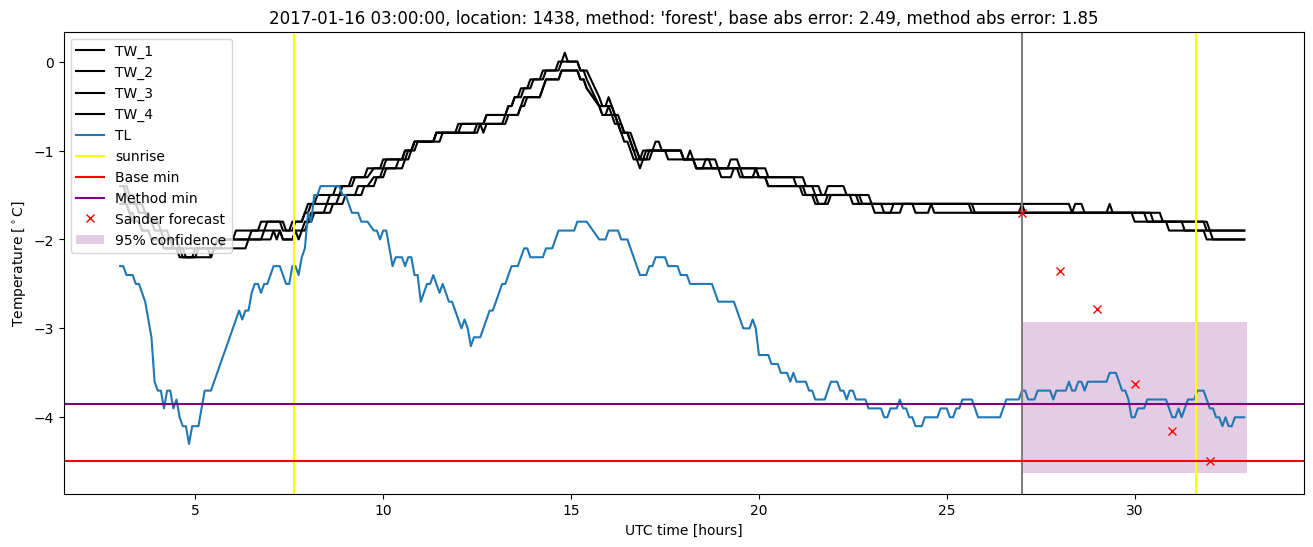
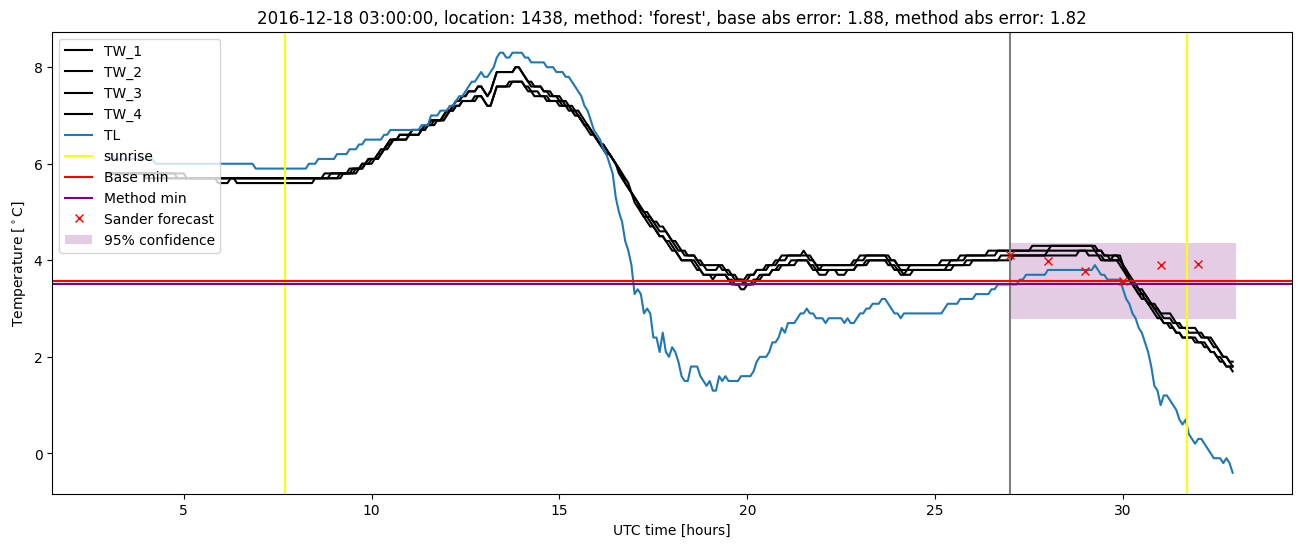
GMS location: 1438
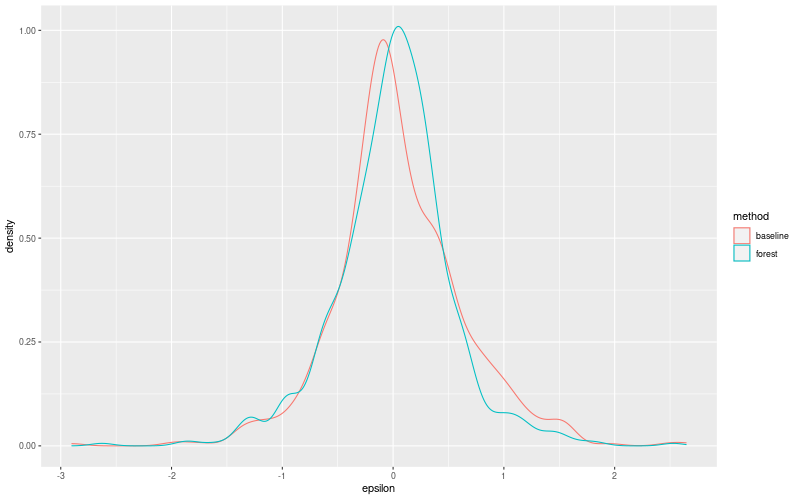
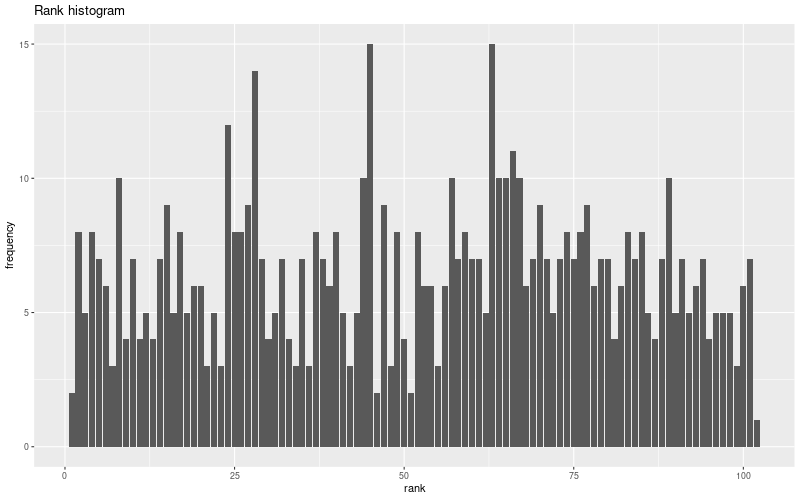
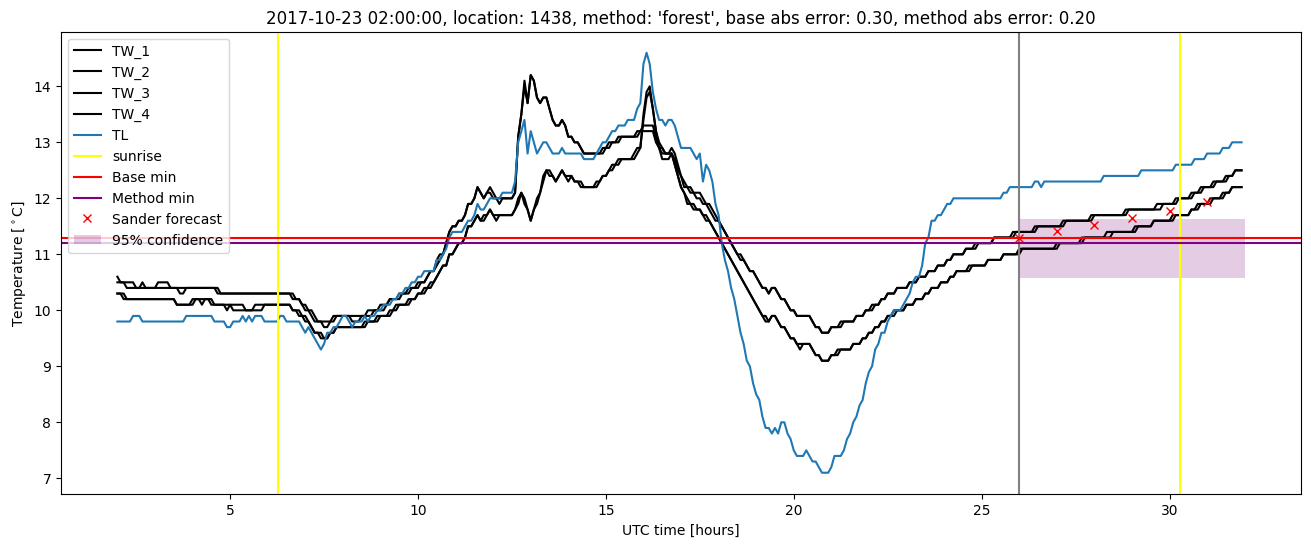
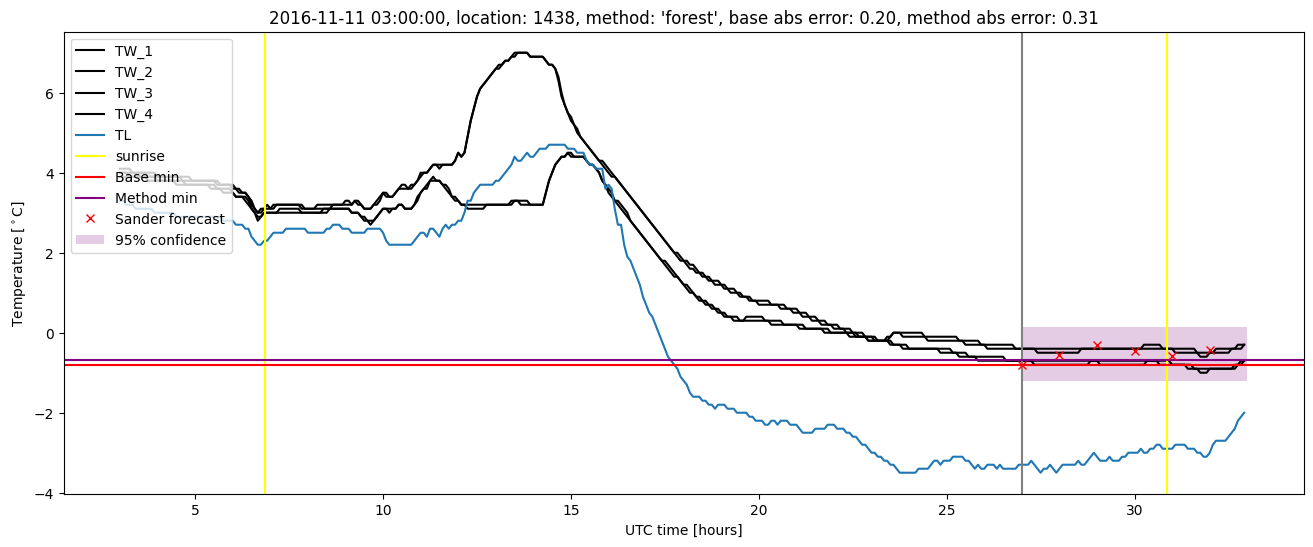
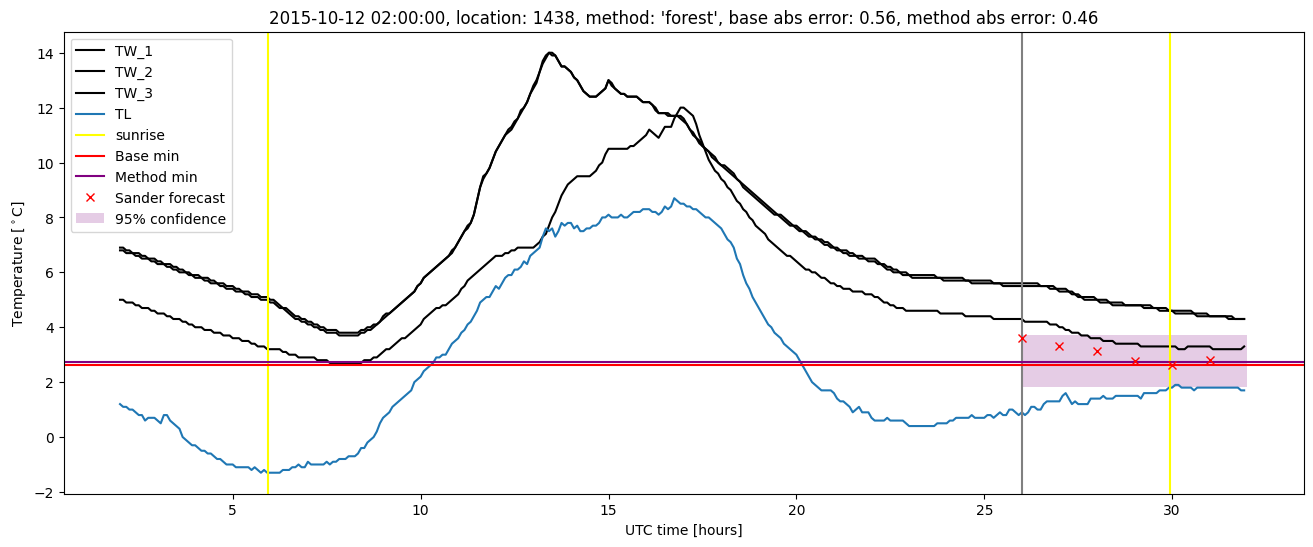
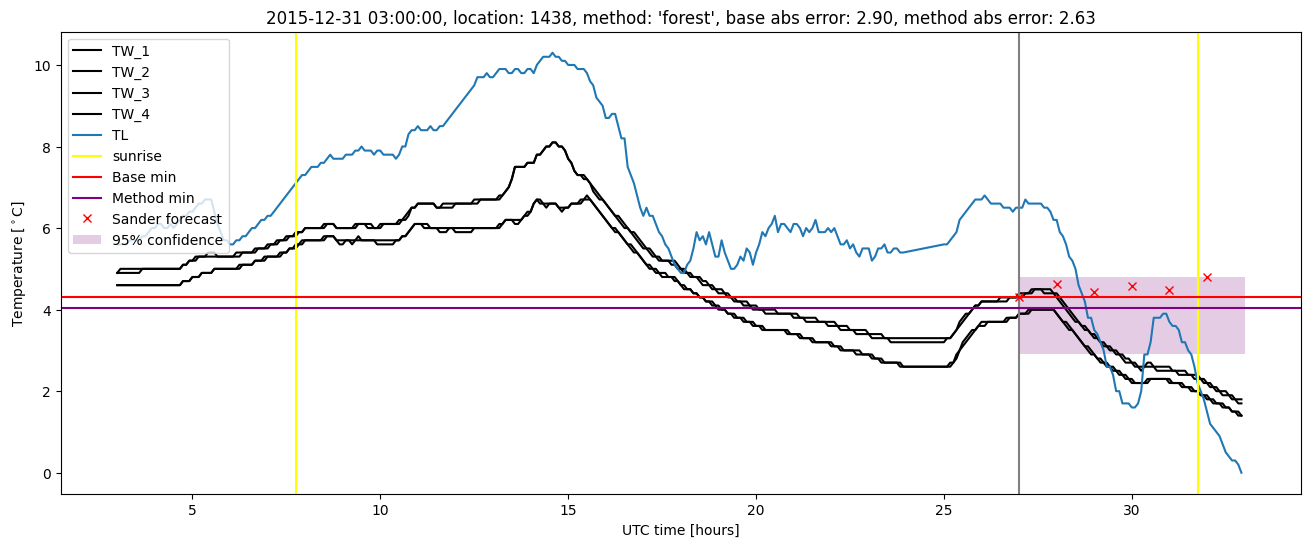
Random forest results
| names |
period |
power |
significance |
meanSquareError |
absError |
maxError |
CRPS |
IGN |
| baseline |
winter 2016 |
1.000 |
0.083 |
0.351 |
0.429 |
2.900 |
NaN |
NaN |
| forest |
winter 2016 |
0.979 |
0.056 |
0.285 |
0.366 |
2.628 |
0.466 |
4.956 |
| baseline |
winter 2017 |
0.971 |
0.087 |
0.387 |
0.446 |
2.489 |
NaN |
NaN |
| forest |
winter 2017 |
0.981 |
0.087 |
0.343 |
0.436 |
1.898 |
0.460 |
4.816 |
| baseline |
winter 2018 |
0.986 |
0.081 |
0.351 |
0.430 |
1.953 |
NaN |
NaN |
| forest |
winter 2018 |
0.993 |
0.081 |
0.277 |
0.384 |
1.737 |
0.454 |
3.077 |
| baseline |
winter 2019 |
0.985 |
0.091 |
0.276 |
0.391 |
1.623 |
NaN |
NaN |
| forest |
winter 2019 |
0.985 |
0.045 |
0.193 |
0.331 |
1.503 |
0.448 |
3.713 |
| baseline |
all |
0.987 |
0.085 |
0.342 |
0.425 |
2.900 |
NaN |
NaN |
| forest |
all |
0.985 |
0.071 |
0.275 |
0.379 |
2.628 |
0.457 |
4.132 |
Random forest plots
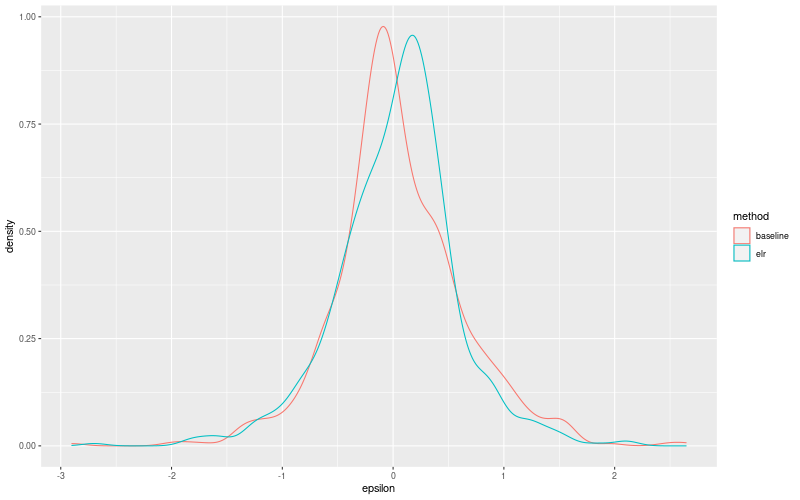
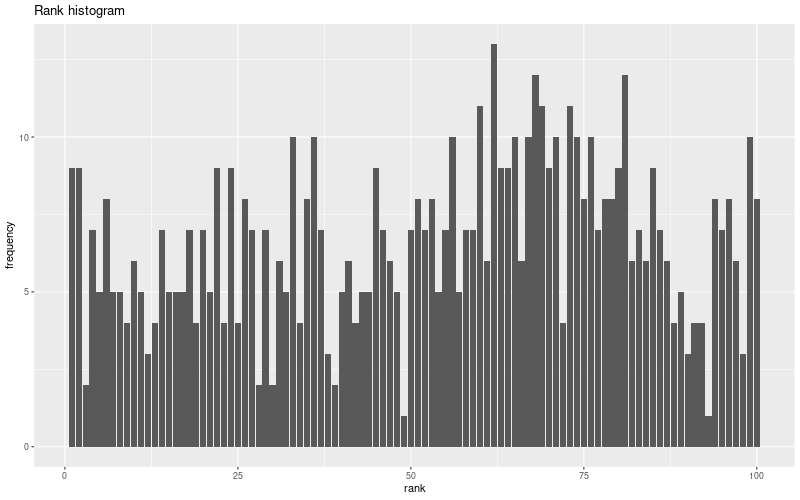
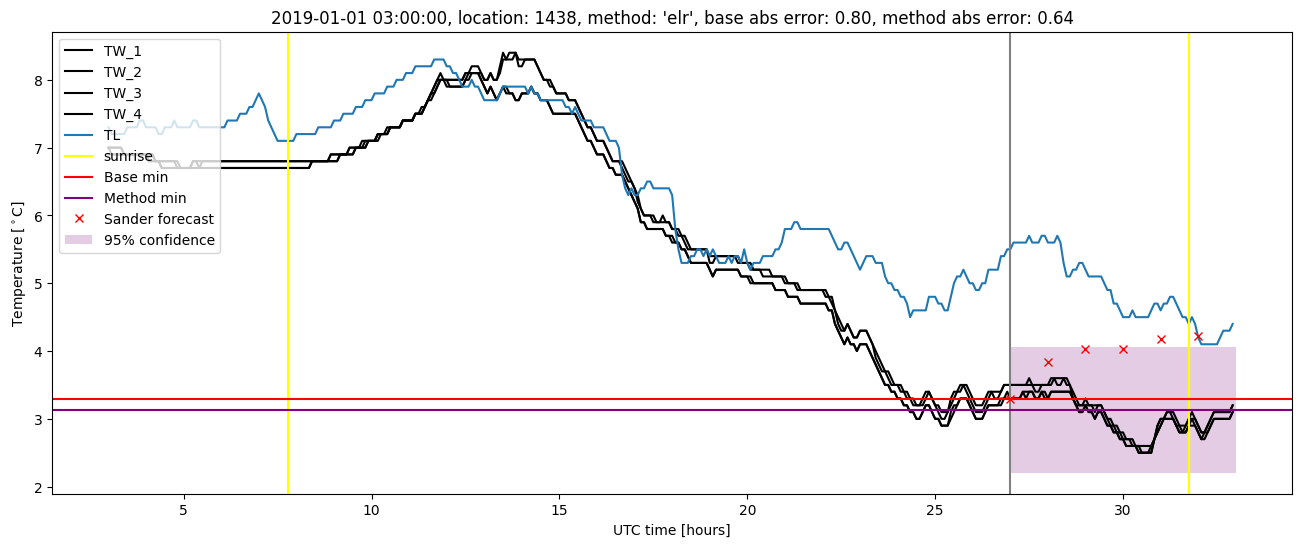
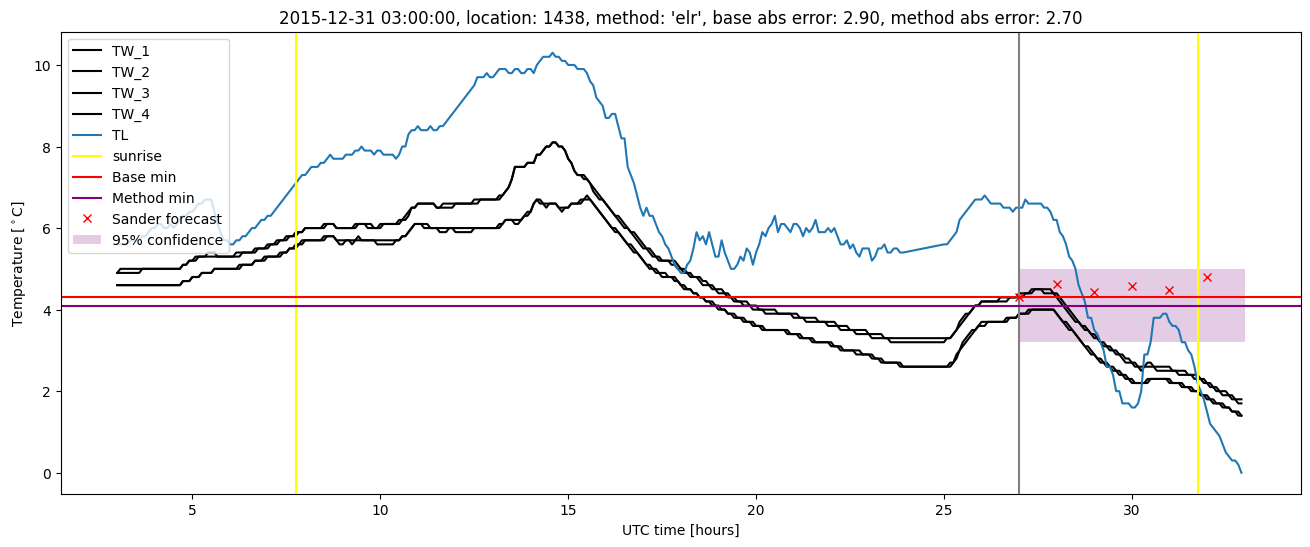
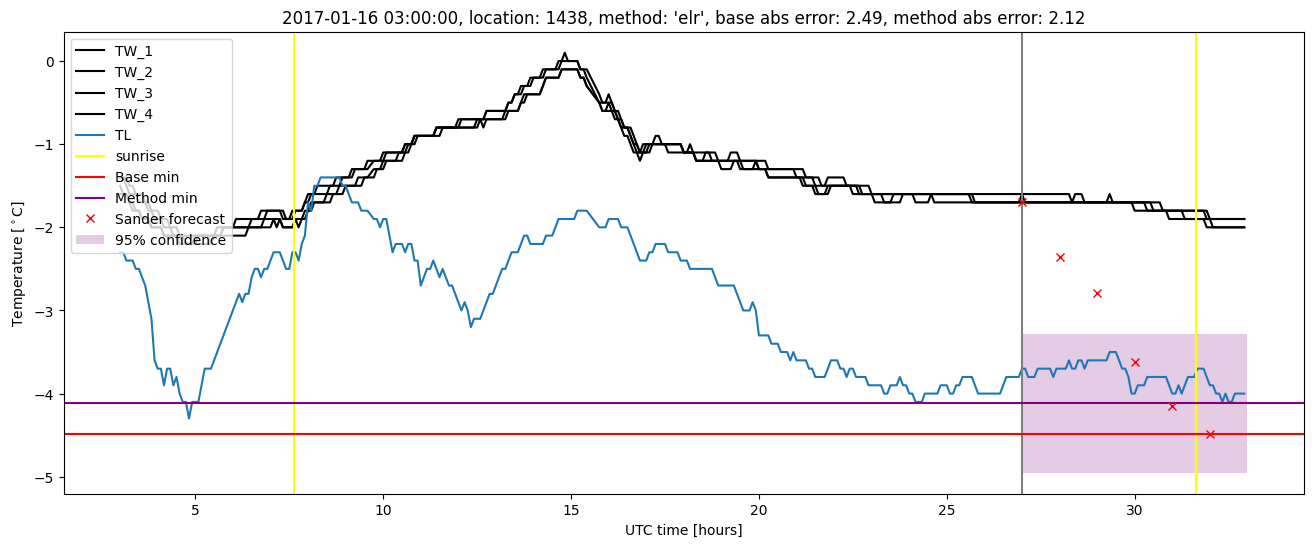
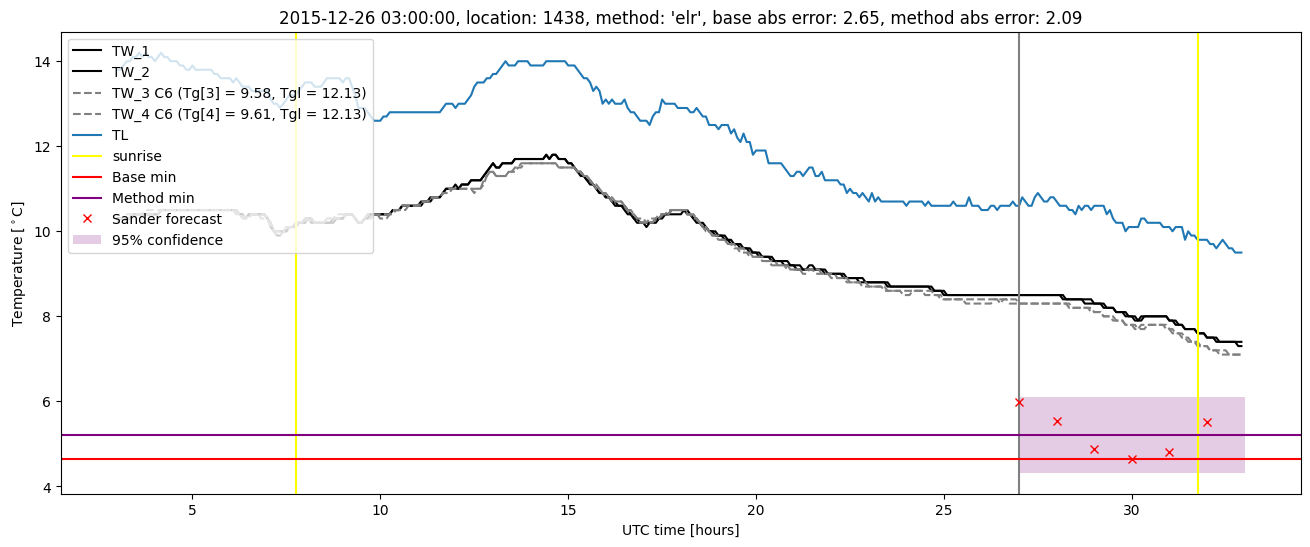
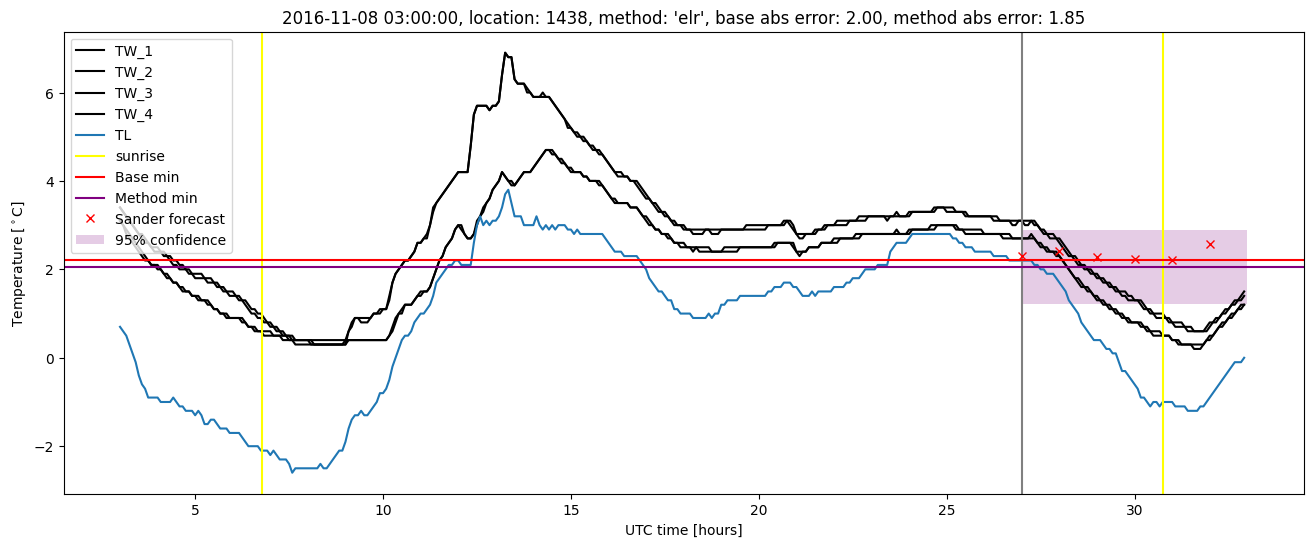
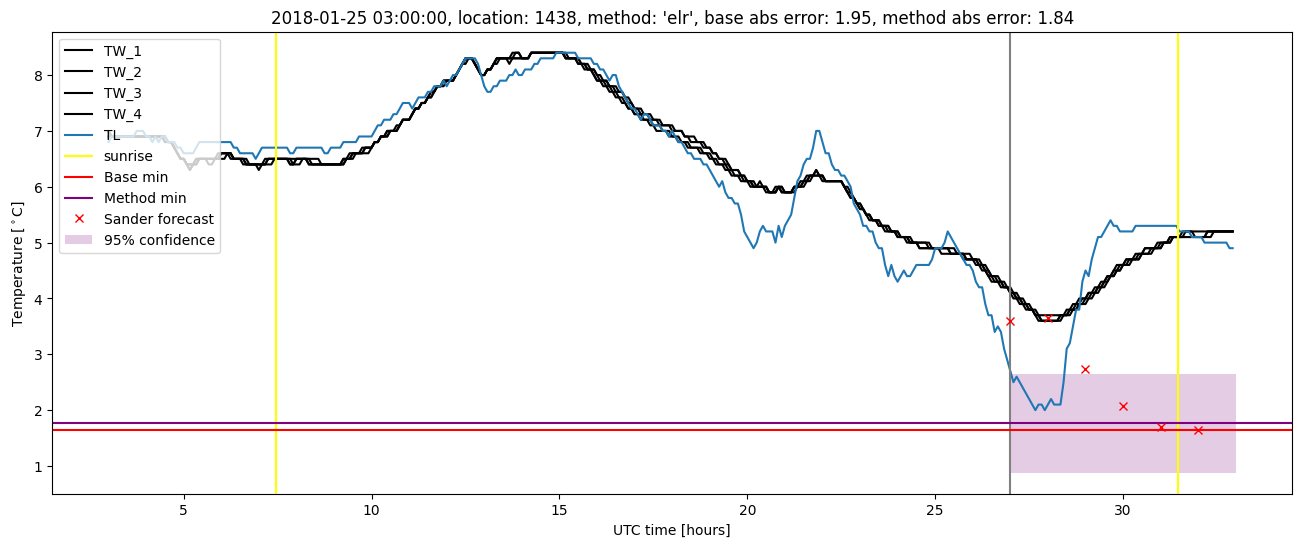
Extended logistic regression results
| names |
period |
power |
significance |
meanSquareError |
absError |
maxError |
CRPS |
IGN |
| baseline |
winter 2016 |
1.000 |
0.083 |
0.351 |
0.429 |
2.900 |
NaN |
NaN |
| elr |
winter 2016 |
0.979 |
0.083 |
0.295 |
0.404 |
2.699 |
0.505 |
3.589 |
| baseline |
winter 2017 |
0.971 |
0.087 |
0.387 |
0.446 |
2.489 |
NaN |
NaN |
| elr |
winter 2017 |
0.971 |
0.065 |
0.346 |
0.436 |
2.118 |
0.507 |
4.512 |
| baseline |
winter 2018 |
0.986 |
0.081 |
0.351 |
0.430 |
1.953 |
NaN |
NaN |
| elr |
winter 2018 |
0.979 |
0.081 |
0.323 |
0.412 |
1.838 |
0.499 |
3.652 |
| baseline |
winter 2019 |
0.985 |
0.091 |
0.276 |
0.391 |
1.623 |
NaN |
NaN |
| elr |
winter 2019 |
0.985 |
0.091 |
0.220 |
0.369 |
1.544 |
0.492 |
2.981 |
| baseline |
all |
0.987 |
0.085 |
0.342 |
0.425 |
2.900 |
NaN |
NaN |
| elr |
all |
0.979 |
0.078 |
0.297 |
0.406 |
2.699 |
0.501 |
3.677 |
Extended logistic regression plots