GMS location: 1437
Random forest results
| names |
period |
power |
significance |
meanSquareError |
absError |
maxError |
CRPS |
IGN |
| baseline |
winter 2016 |
0.994 |
0.030 |
0.346 |
0.427 |
2.197 |
NaN |
NaN |
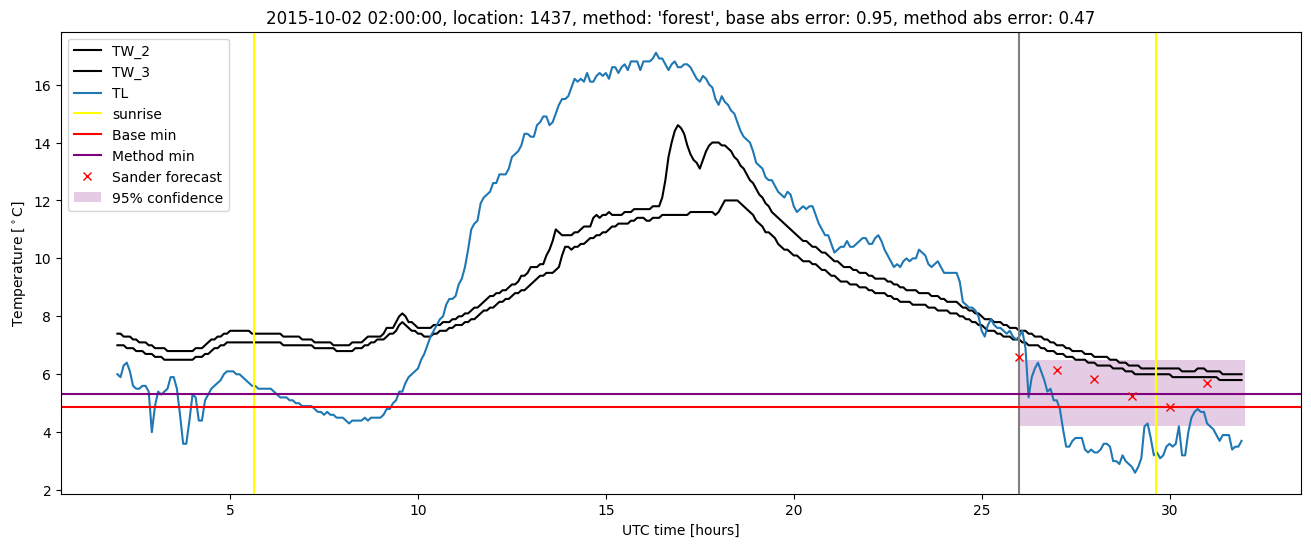
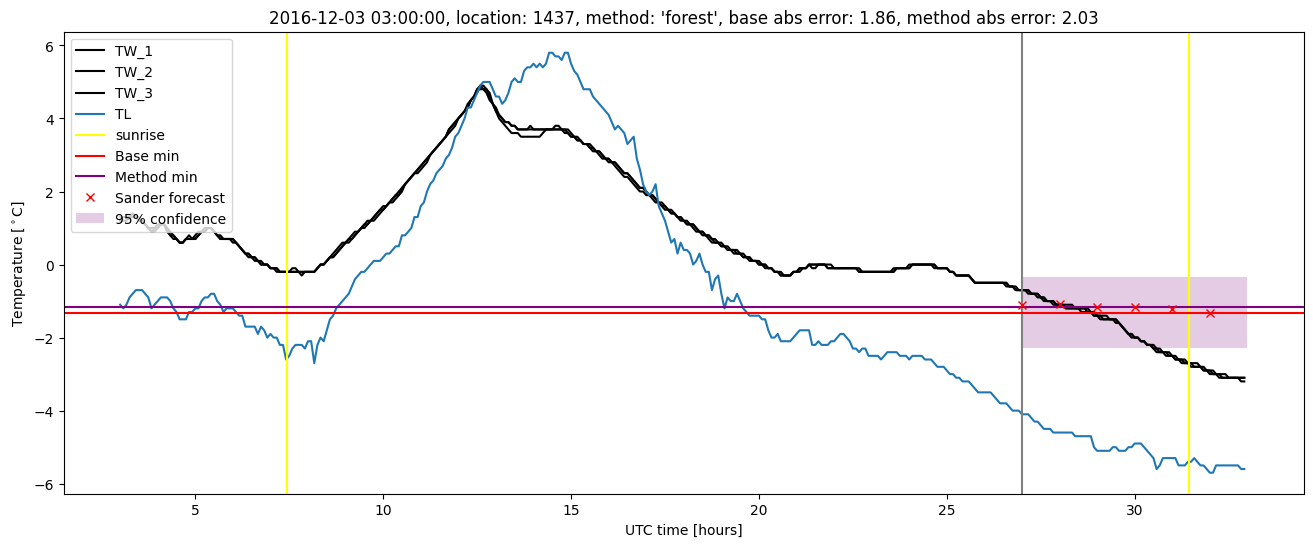
| forest |
winter 2016 |
0.988 |
0.030 |
0.277 |
0.384 |
1.898 |
0.481 |
4.052 |
| baseline |
winter 2017 |
0.981 |
0.000e+00 |
0.567 |
0.540 |
3.151 |
NaN |
NaN |
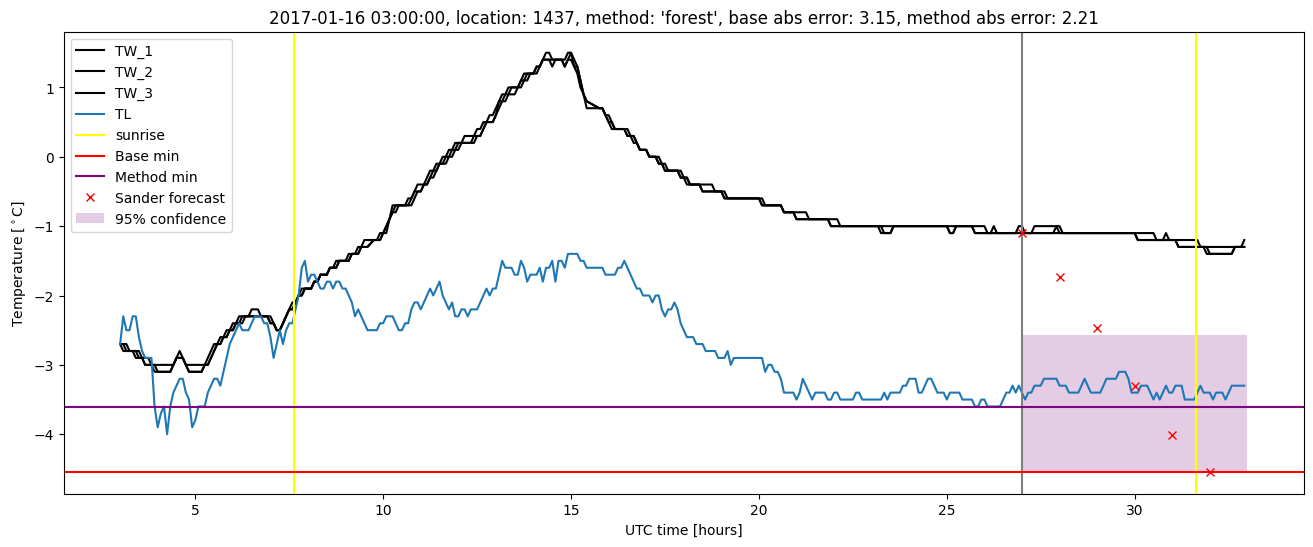
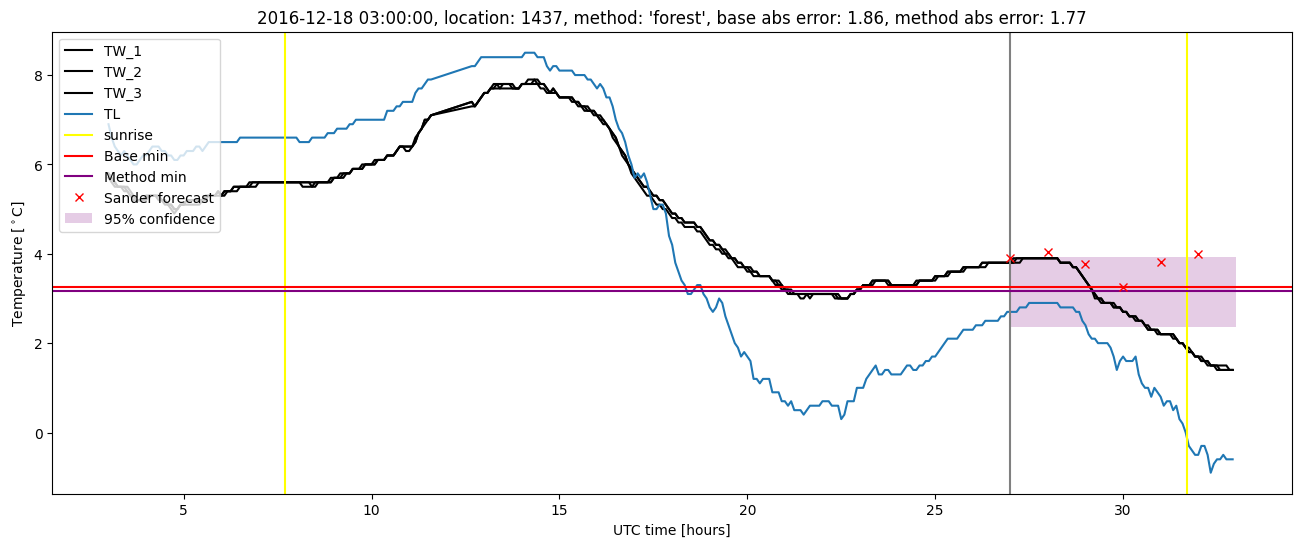
| forest |
winter 2017 |
0.981 |
0.000e+00 |
0.459 |
0.489 |
2.206 |
0.483 |
3.716 |
| baseline |
winter 2018 |
0.977 |
0.061 |
0.281 |
0.399 |
1.634 |
NaN |
NaN |
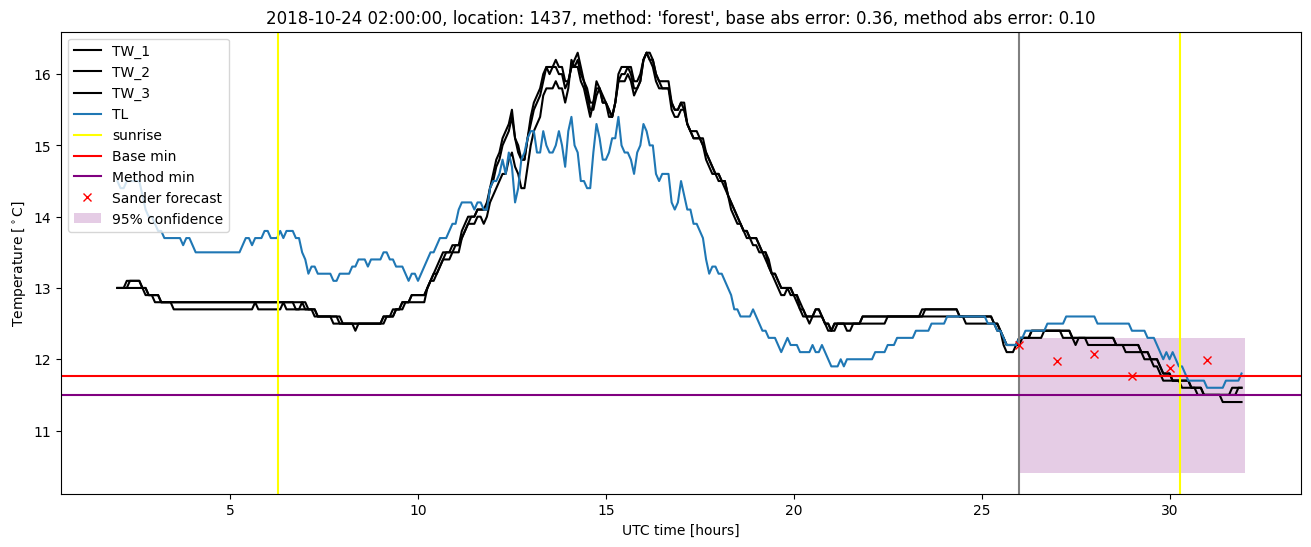
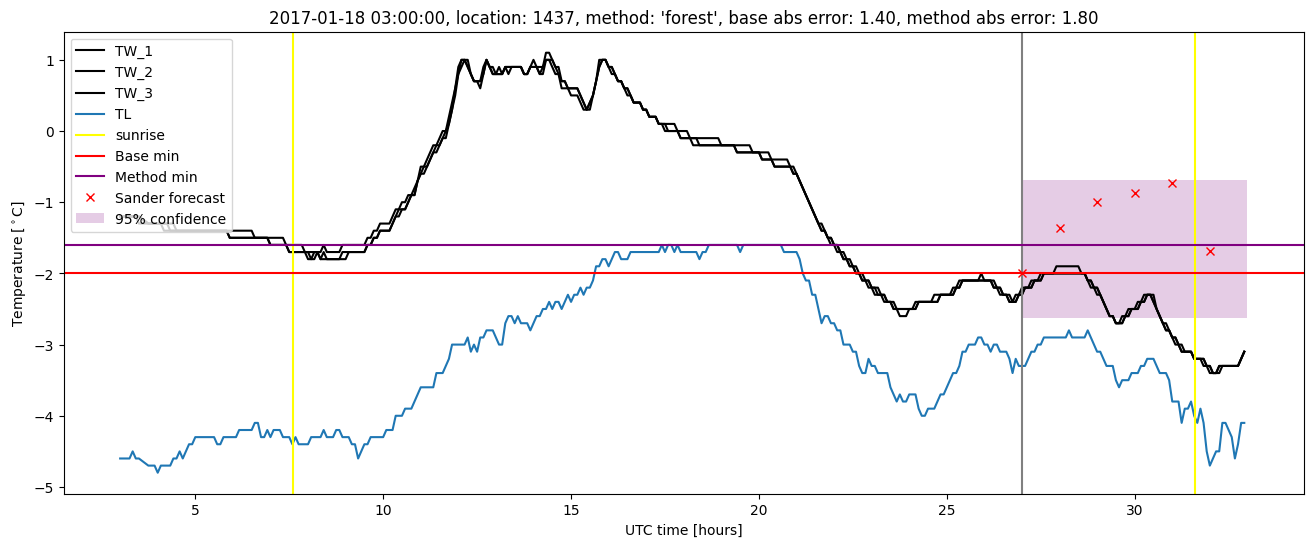
| forest |
winter 2018 |
0.977 |
0.061 |
0.228 |
0.369 |
1.419 |
0.479 |
3.349 |
| baseline |
winter 2019 |
0.965 |
0.000e+00 |
0.305 |
0.424 |
1.982 |
NaN |
NaN |
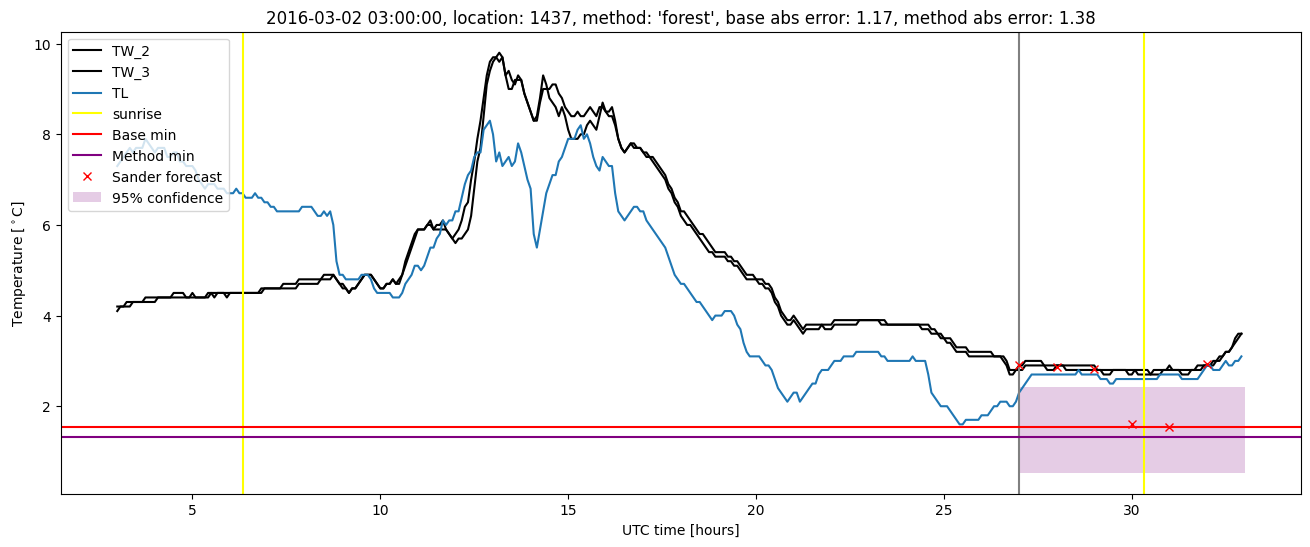
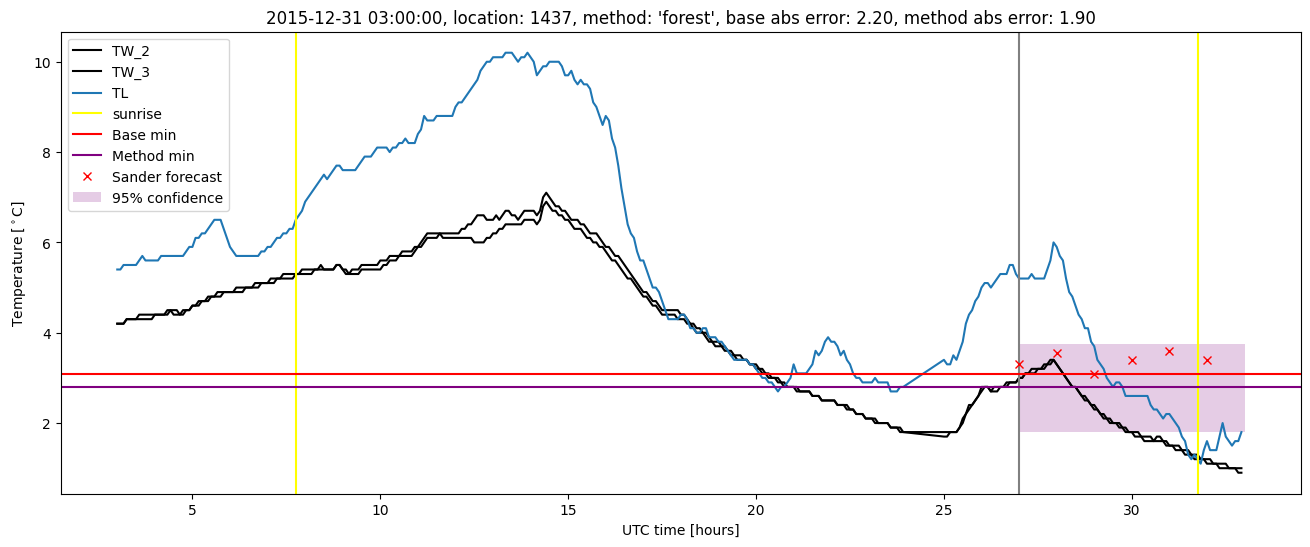
| forest |
winter 2019 |
0.983 |
0.000e+00 |
0.210 |
0.354 |
1.290 |
0.471 |
3.104 |
| baseline |
all |
0.981 |
0.026 |
0.372 |
0.445 |
3.151 |
NaN |
NaN |
| forest |
all |
0.983 |
0.026 |
0.293 |
0.399 |
2.206 |
0.479 |
3.608 |
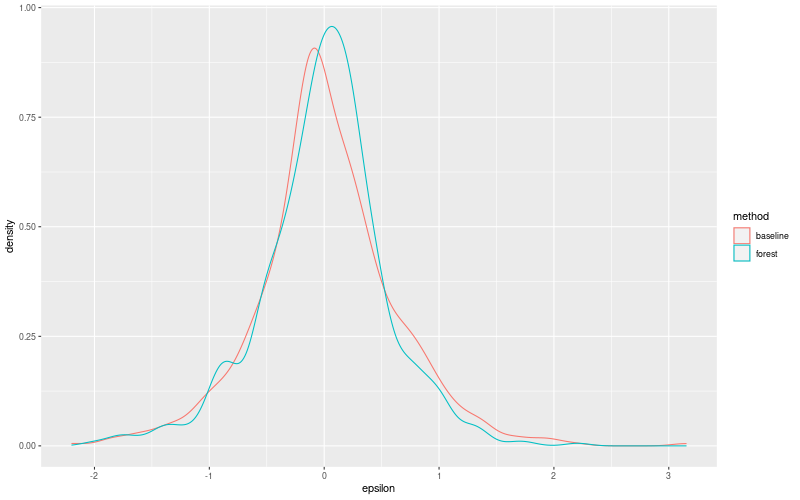
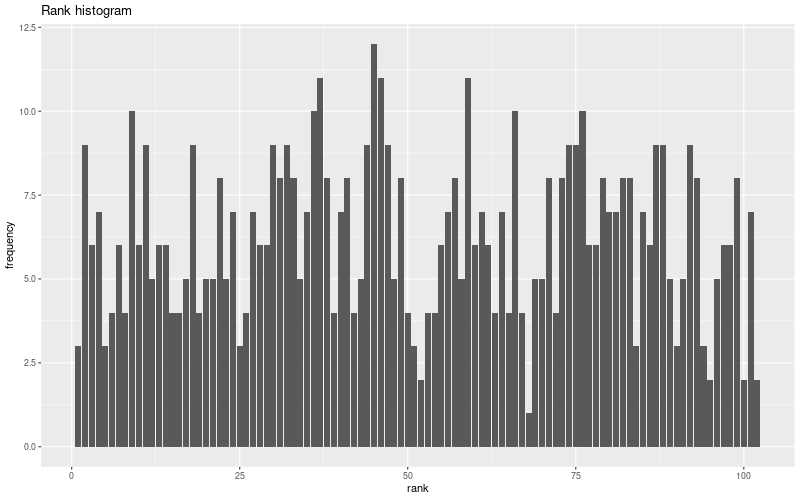
Random forest plots
Extended logistic regression results
| names |
period |
power |
significance |
meanSquareError |
absError |
maxError |
CRPS |
IGN |
| baseline |
winter 2016 |
0.994 |
0.030 |
0.346 |
0.427 |
2.197 |
NaN |
NaN |
| elr |
winter 2016 |
0.982 |
0.000e+00 |
0.338 |
0.450 |
2.038 |
0.565 |
5.315 |
| baseline |
winter 2017 |
0.981 |
0.000e+00 |
0.567 |
0.540 |
3.151 |
NaN |
NaN |
| elr |
winter 2017 |
0.981 |
0.025 |
0.455 |
0.480 |
2.174 |
0.503 |
4.540 |
| baseline |
winter 2018 |
0.977 |
0.061 |
0.281 |
0.399 |
1.634 |
NaN |
NaN |
| elr |
winter 2018 |
0.985 |
0.061 |
0.262 |
0.404 |
1.647 |
0.556 |
4.670 |
| baseline |
winter 2019 |
0.965 |
0.000e+00 |
0.305 |
0.424 |
1.982 |
NaN |
NaN |
| elr |
winter 2019 |
0.983 |
0.000e+00 |
0.245 |
0.404 |
1.088 |
0.523 |
3.719 |
| baseline |
all |
0.981 |
0.026 |
0.372 |
0.445 |
3.151 |
NaN |
NaN |
| elr |
all |
0.983 |
0.026 |
0.327 |
0.436 |
2.174 |
0.540 |
4.660 |
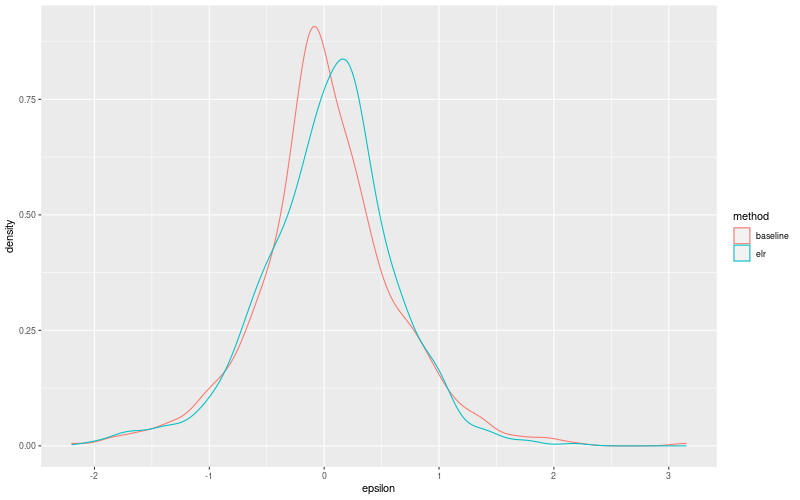
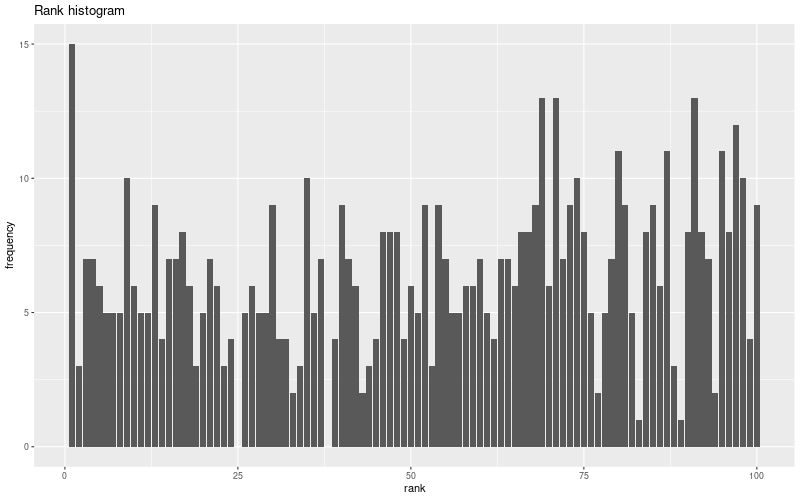
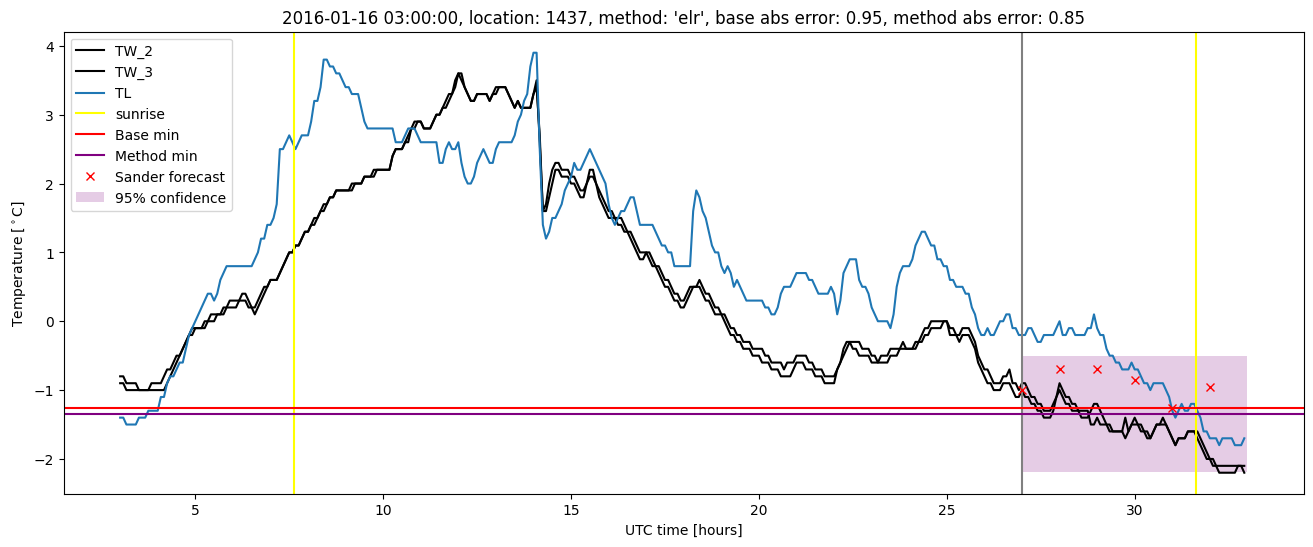
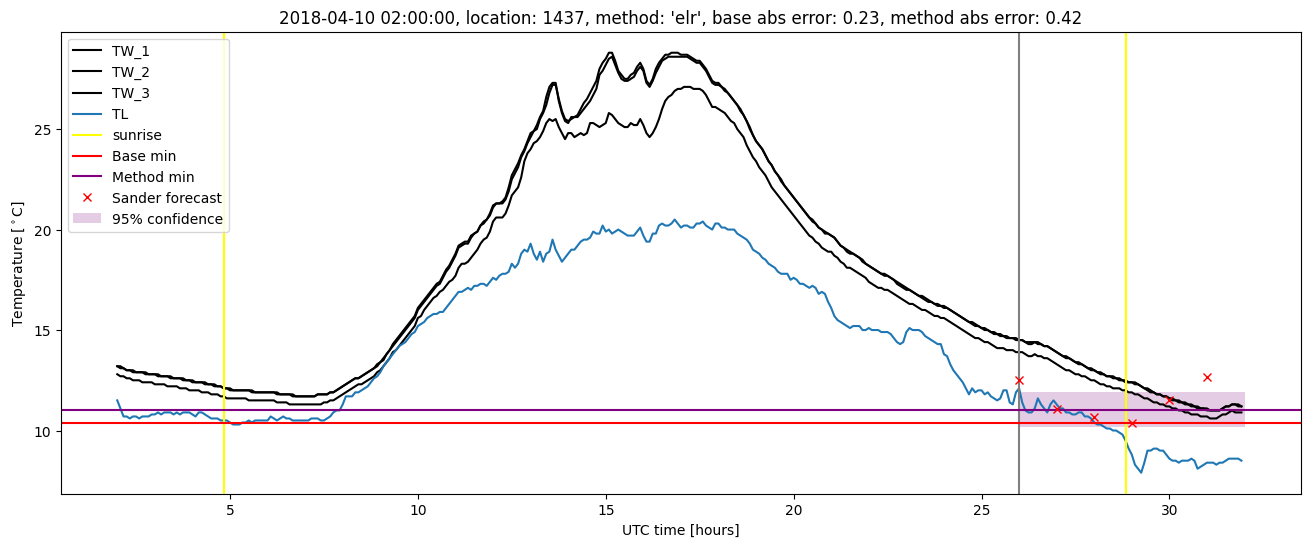
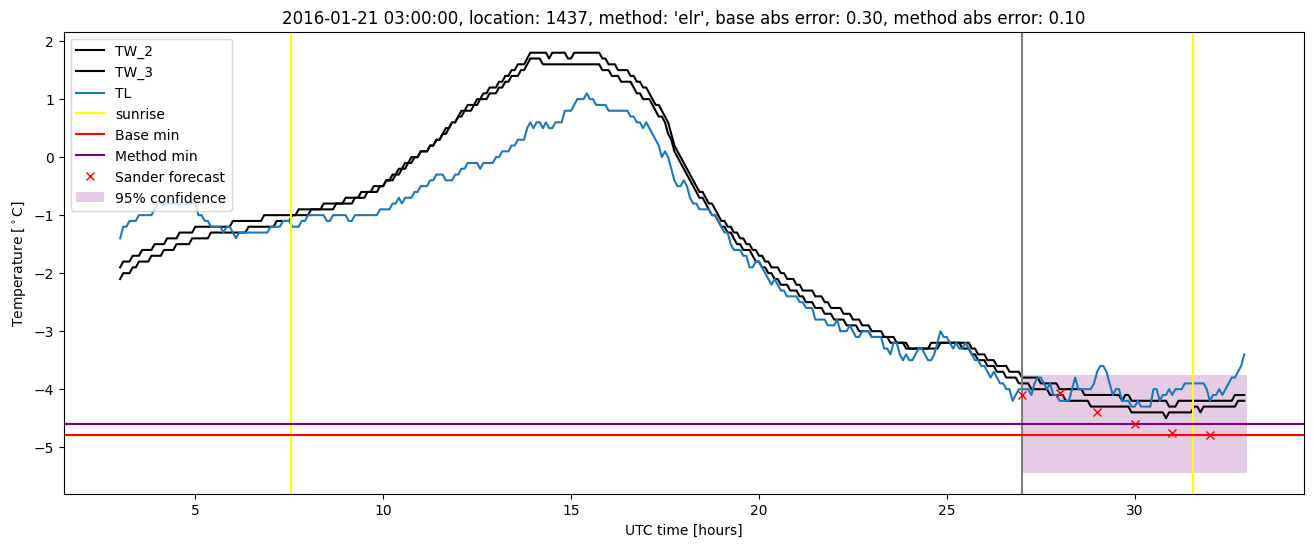
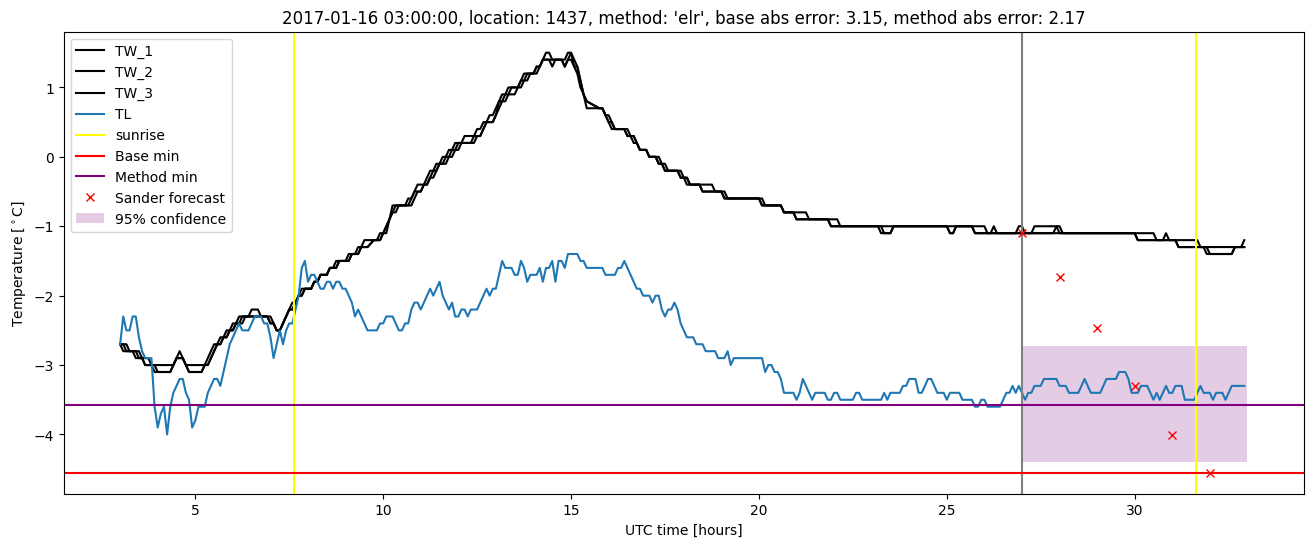
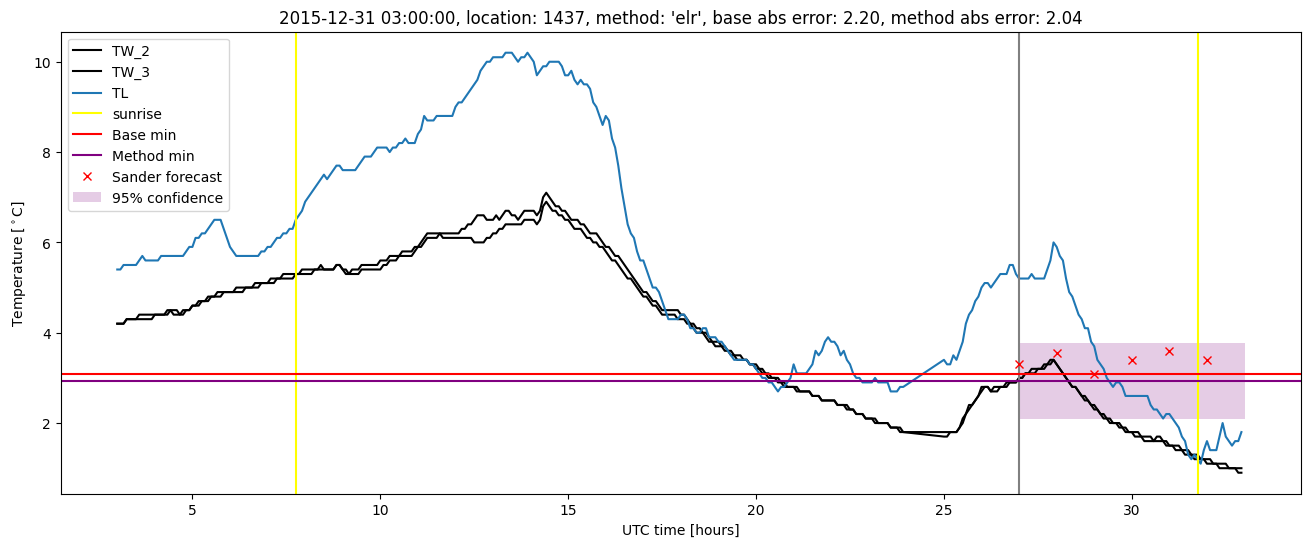
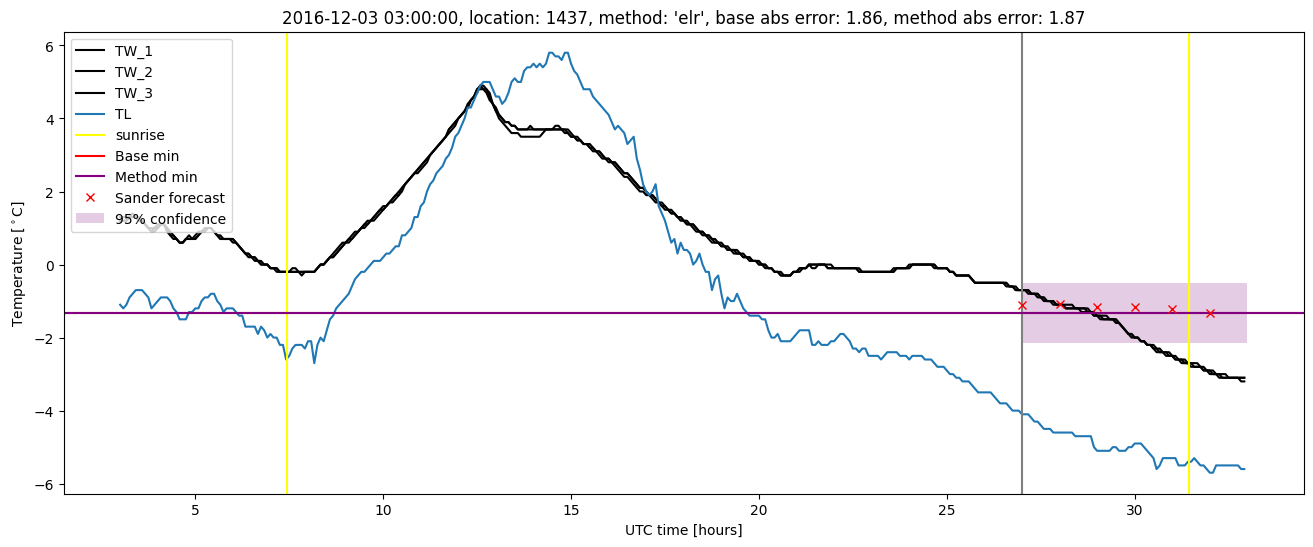
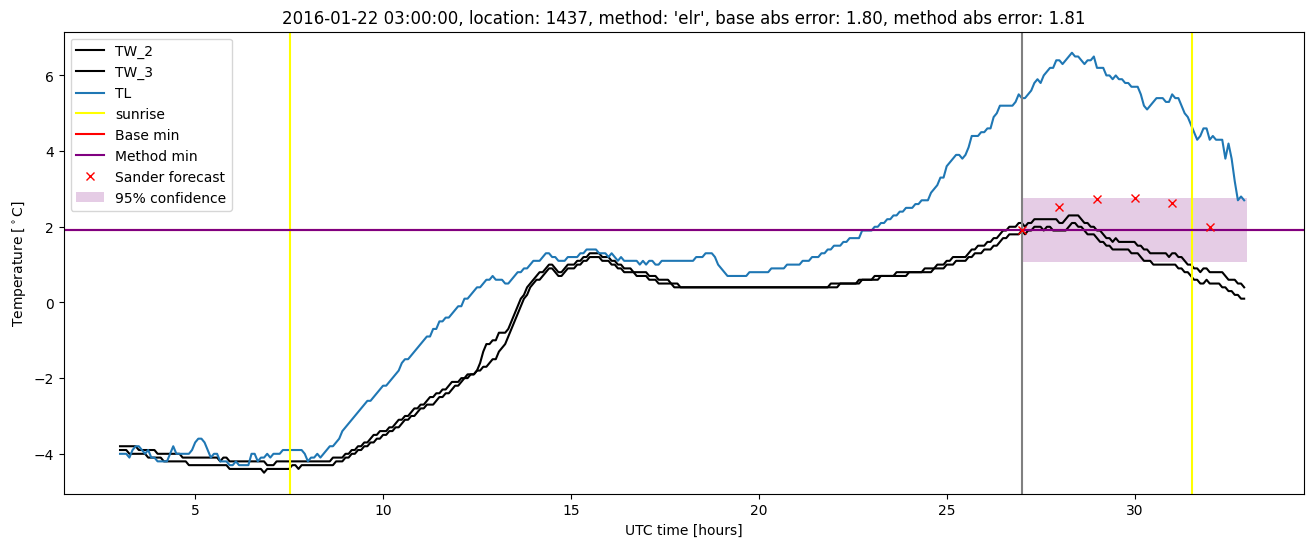
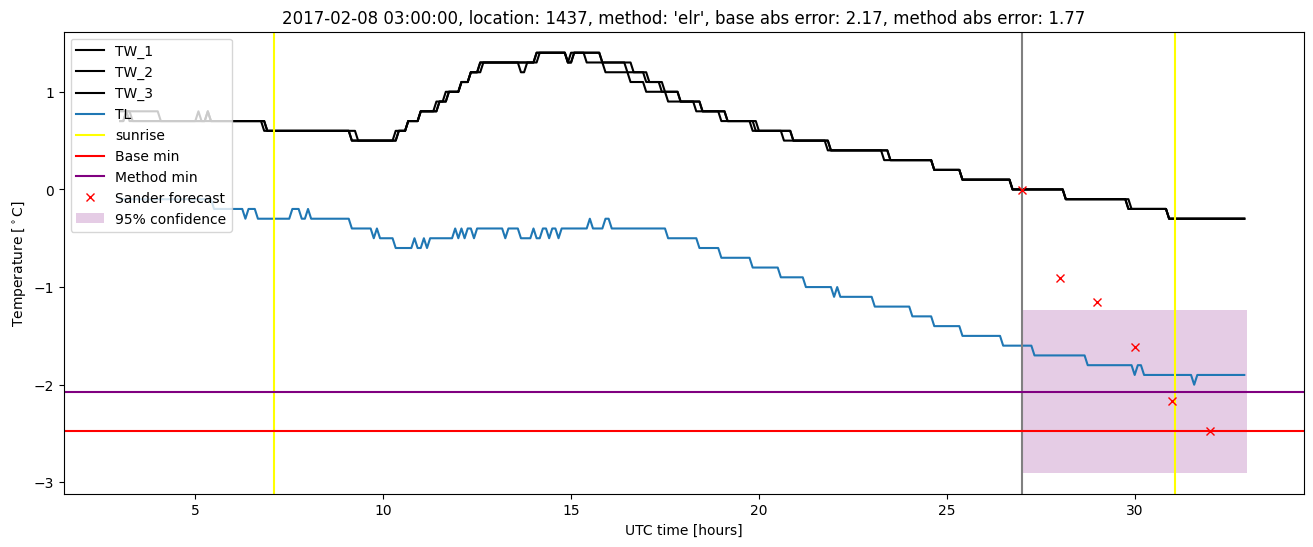
Extended logistic regression plots