GMS location: 1436
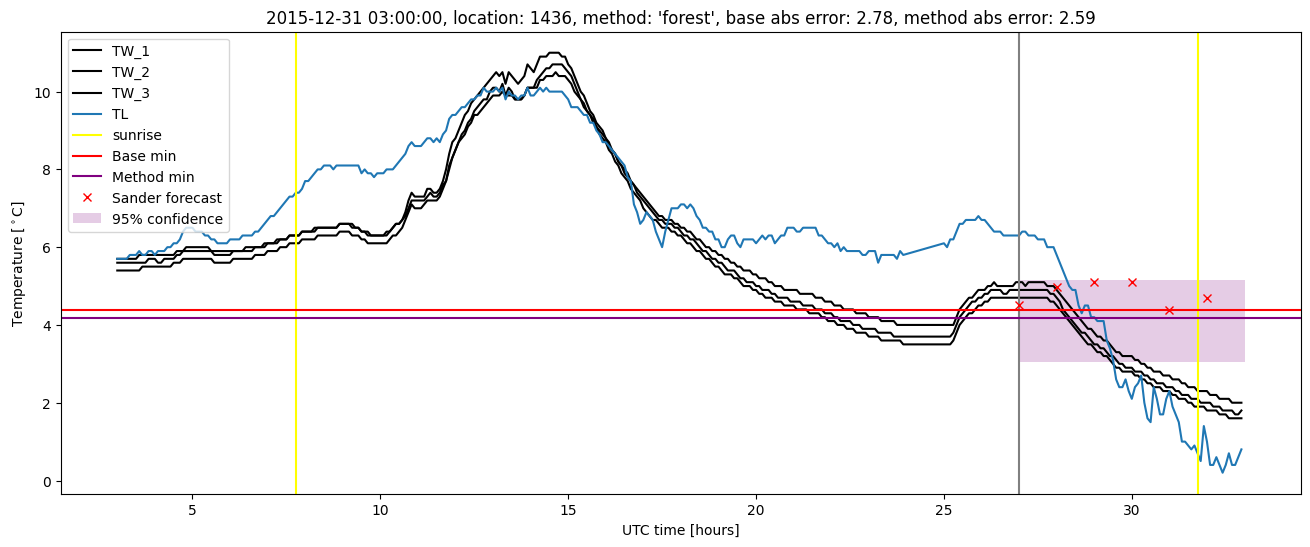
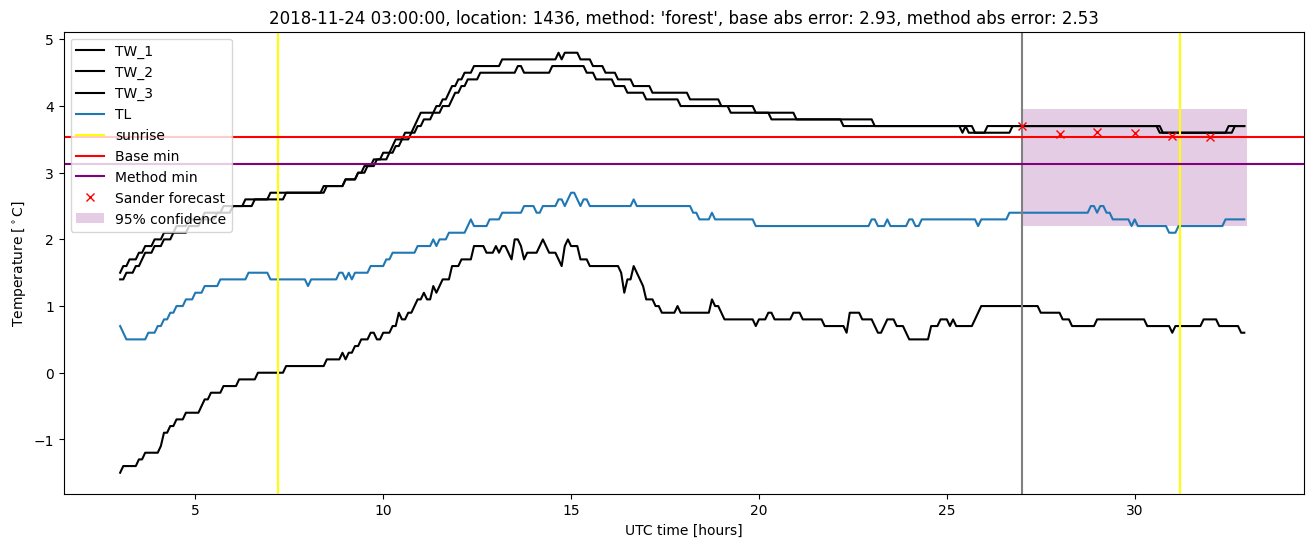
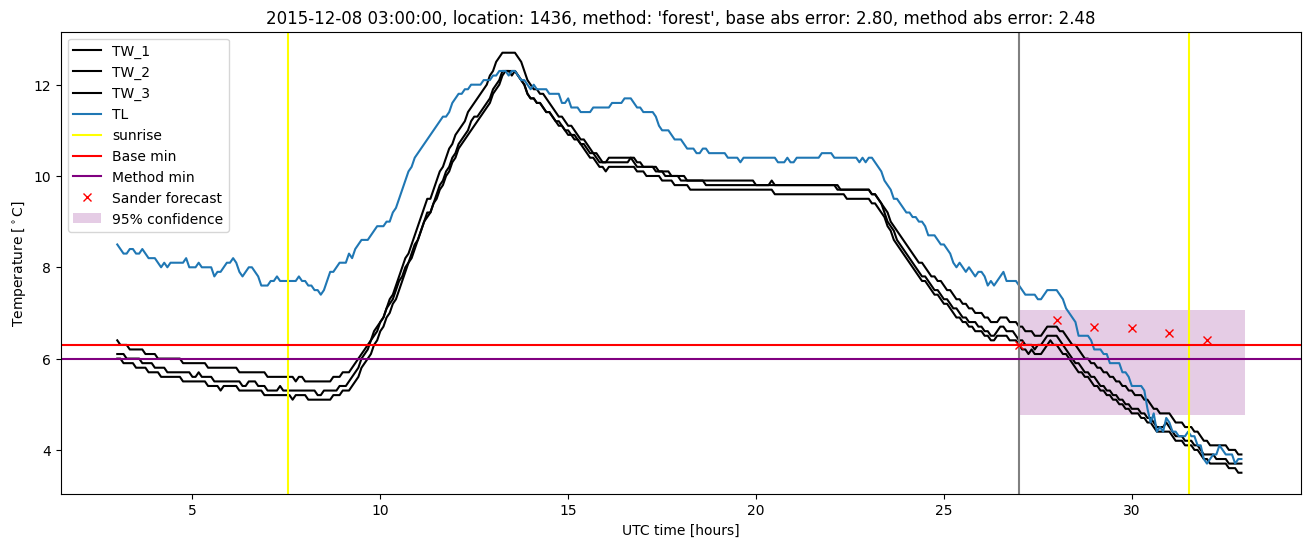
Random forest results
| names |
period |
power |
significance |
meanSquareError |
absError |
maxError |
CRPS |
IGN |
| baseline |
winter 2016 |
0.994 |
0.111 |
0.362 |
0.426 |
2.801 |
NaN |
NaN |
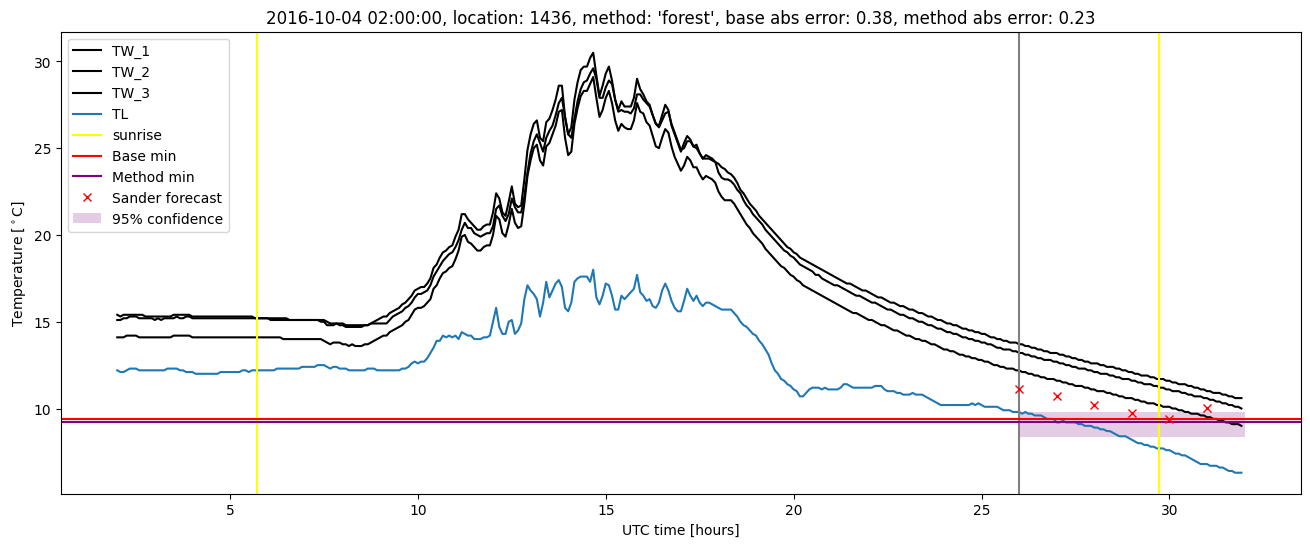
| forest |
winter 2016 |
0.970 |
0.111 |
0.324 |
0.401 |
2.585 |
0.566 |
2.106 |
| baseline |
winter 2017 |
0.990 |
0.000e+00 |
0.442 |
0.492 |
2.399 |
NaN |
NaN |
| forest |
winter 2017 |
0.971 |
0.000e+00 |
0.395 |
0.454 |
1.976 |
0.553 |
1.983 |
| baseline |
winter 2018 |
1.000 |
0.106 |
0.514 |
0.506 |
2.479 |
NaN |
NaN |
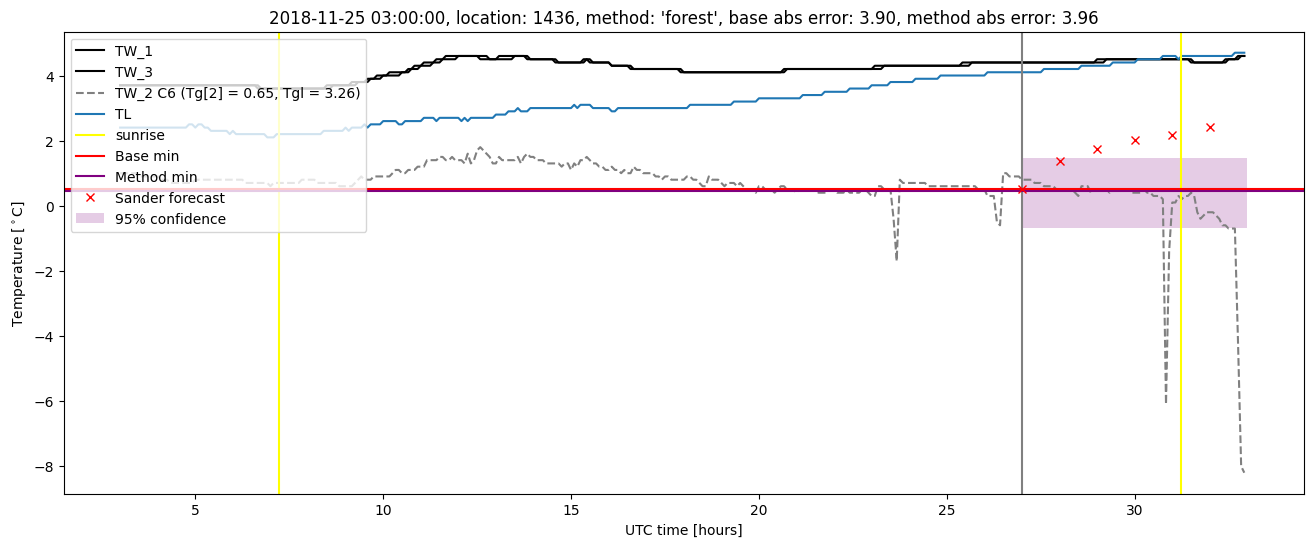
| forest |
winter 2018 |
0.983 |
0.043 |
0.415 |
0.471 |
2.251 |
0.559 |
2.135 |
| baseline |
winter 2019 |
0.993 |
0.125 |
0.608 |
0.499 |
3.896 |
NaN |
NaN |
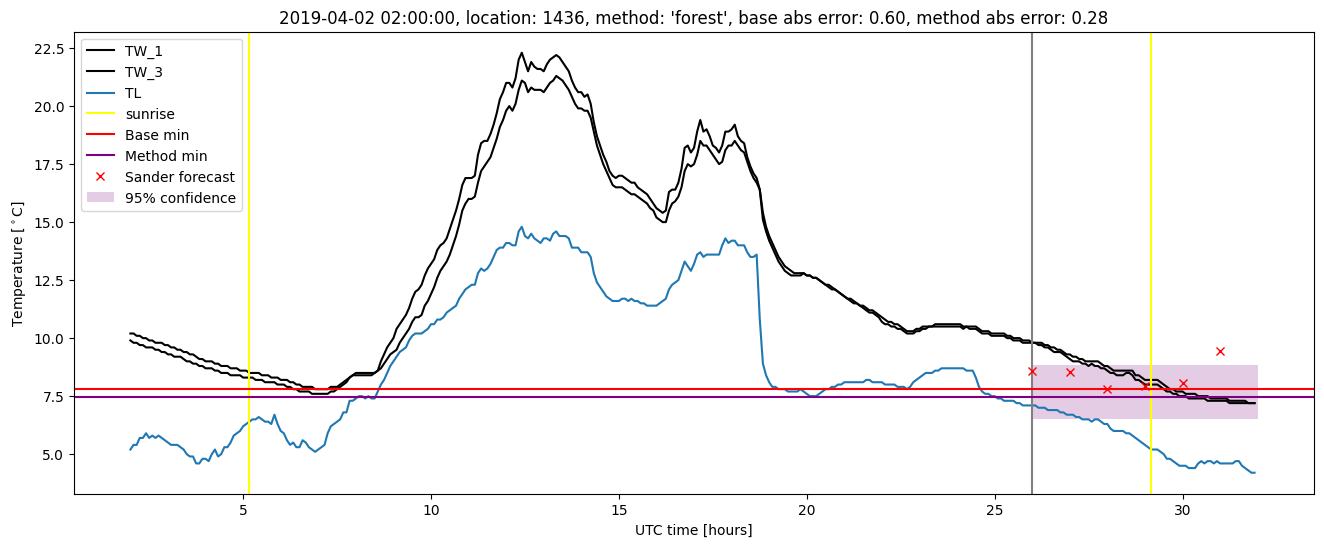
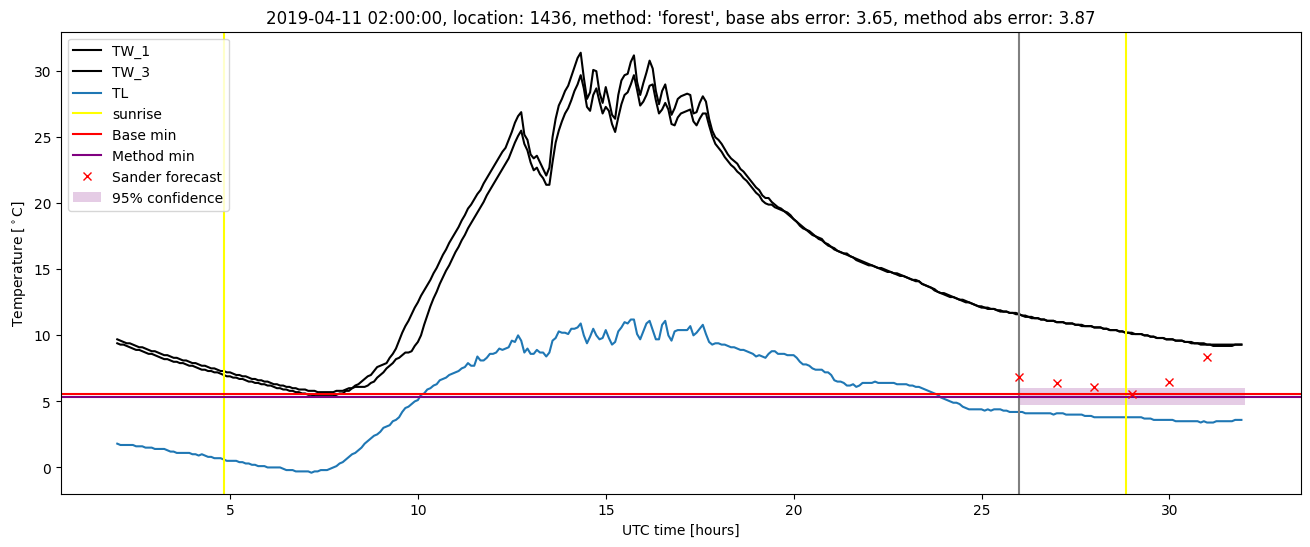
| forest |
winter 2019 |
0.985 |
0.125 |
0.552 |
0.472 |
3.961 |
0.591 |
3.165 |
| baseline |
all |
0.994 |
0.072 |
0.475 |
0.478 |
3.896 |
NaN |
NaN |
| forest |
all |
0.977 |
0.050 |
0.415 |
0.447 |
3.961 |
0.567 |
2.328 |
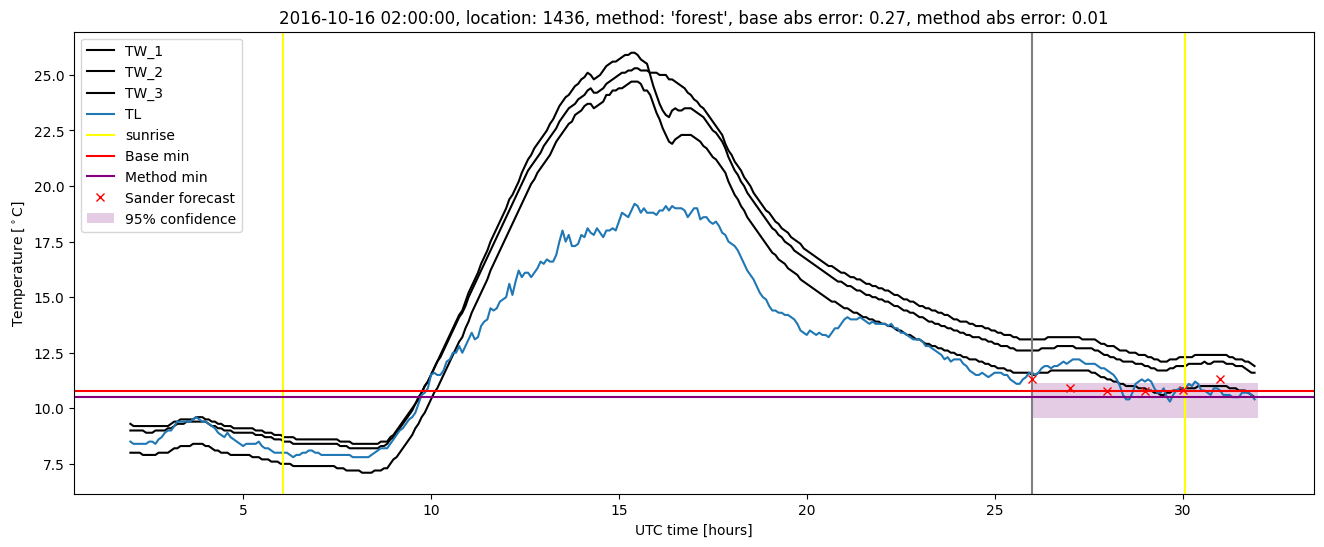
Random forest plots
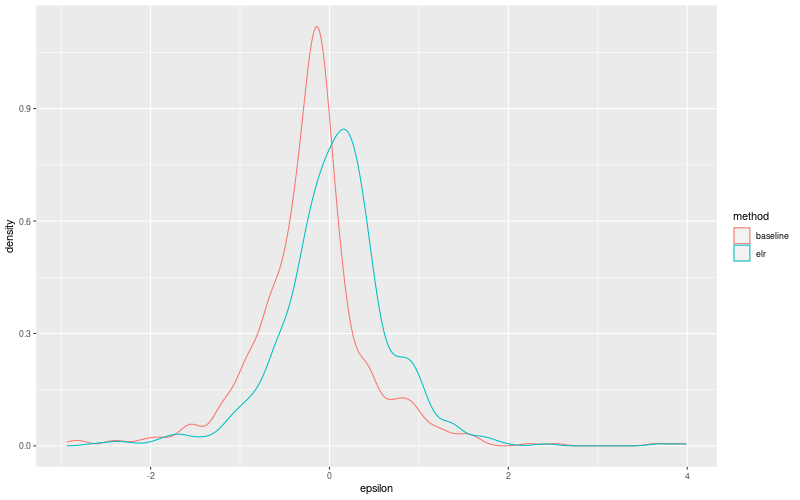
Extended logistic regression results
| names |
period |
power |
significance |
meanSquareError |
absError |
maxError |
CRPS |
IGN |
| baseline |
winter 2016 |
0.994 |
0.111 |
0.362 |
0.426 |
2.801 |
NaN |
NaN |
| elr |
winter 2016 |
0.957 |
0.037 |
0.326 |
0.419 |
2.422 |
0.677 |
3.789 |
| baseline |
winter 2017 |
0.990 |
0.000e+00 |
0.442 |
0.492 |
2.399 |
NaN |
NaN |
| elr |
winter 2017 |
0.961 |
0.000e+00 |
0.399 |
0.464 |
2.195 |
0.648 |
3.752 |
| baseline |
winter 2018 |
1.000 |
0.106 |
0.514 |
0.506 |
2.479 |
NaN |
NaN |
| elr |
winter 2018 |
0.975 |
0.064 |
0.410 |
0.477 |
1.915 |
0.678 |
4.182 |
| baseline |
winter 2019 |
0.993 |
0.125 |
0.608 |
0.499 |
3.896 |
NaN |
NaN |
| elr |
winter 2019 |
0.993 |
0.125 |
0.555 |
0.479 |
3.985 |
0.663 |
4.646 |
| baseline |
all |
0.994 |
0.072 |
0.475 |
0.478 |
3.896 |
NaN |
NaN |
| elr |
all |
0.971 |
0.043 |
0.416 |
0.458 |
3.985 |
0.667 |
4.077 |
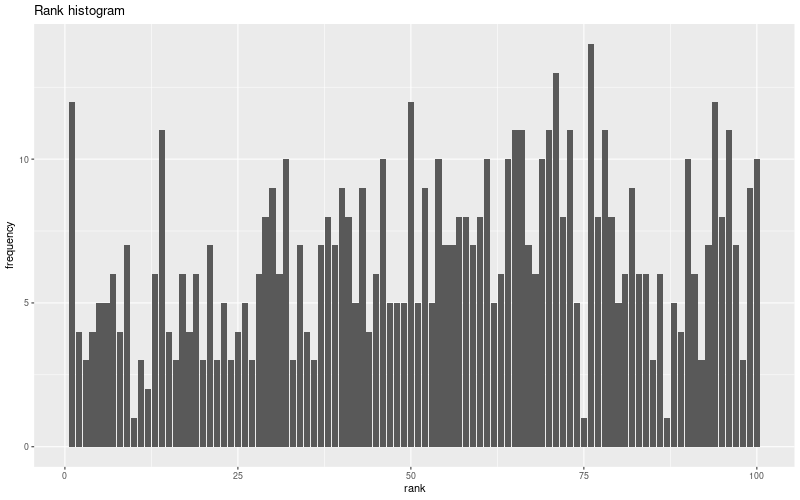
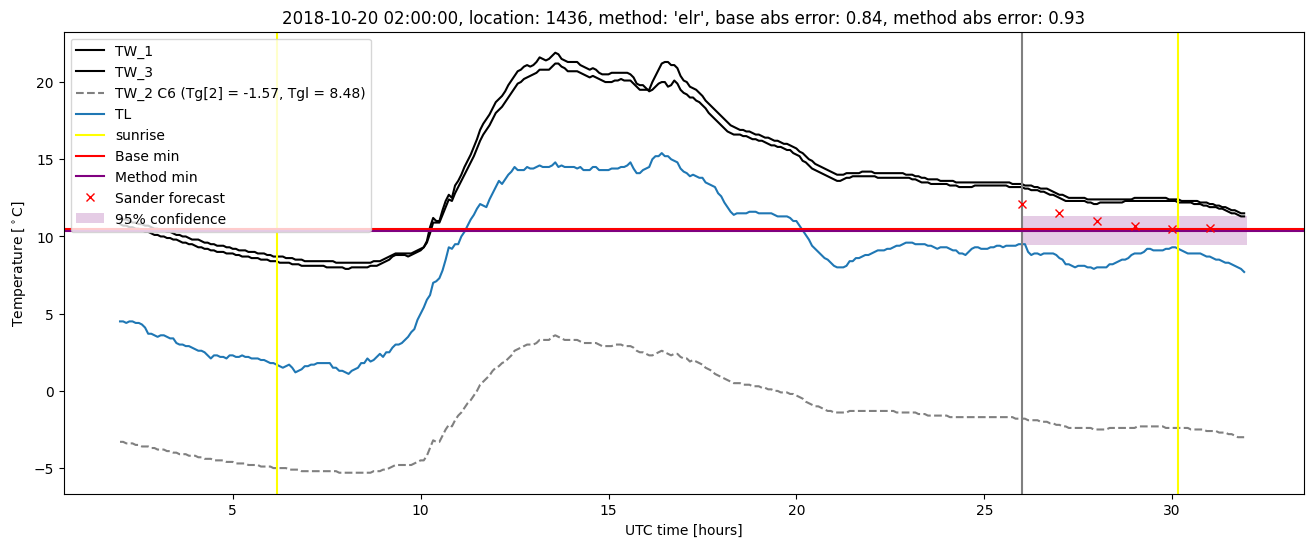
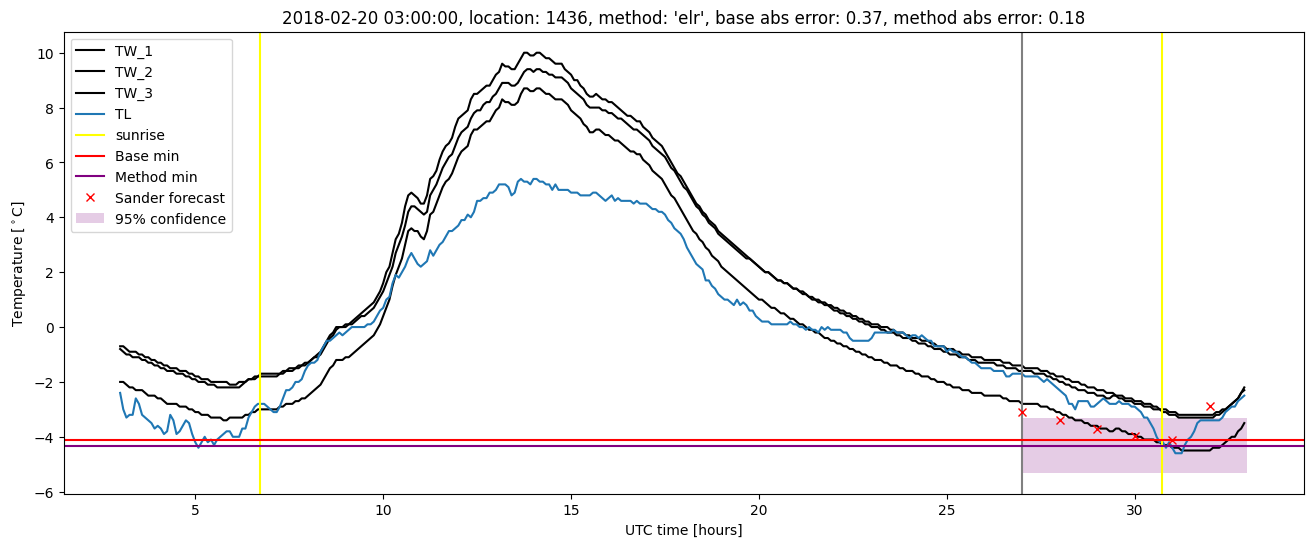
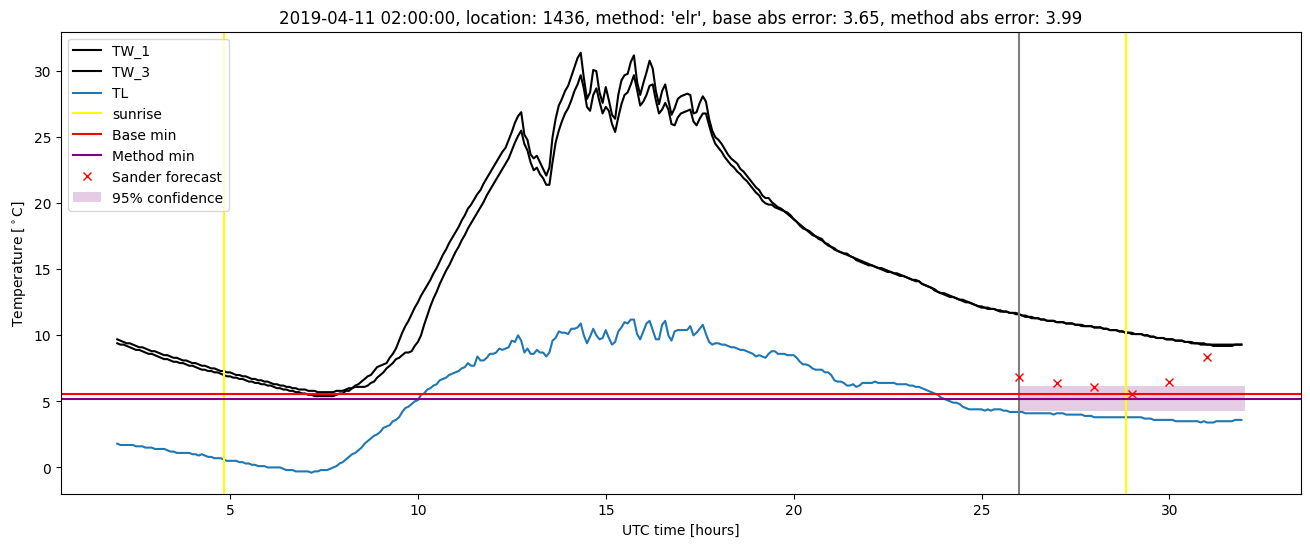
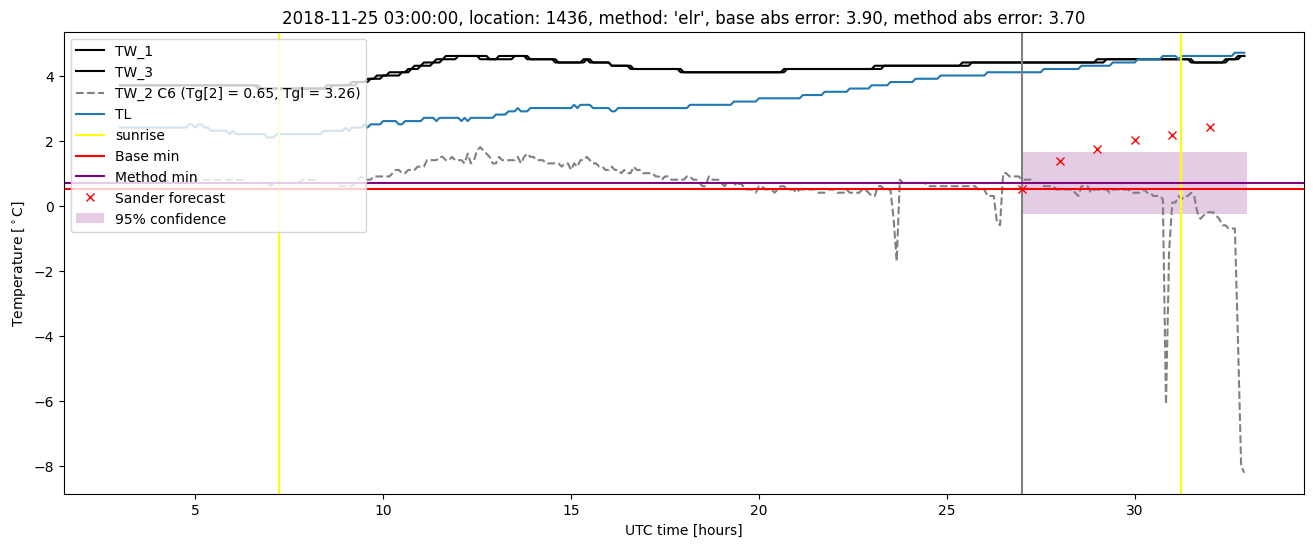
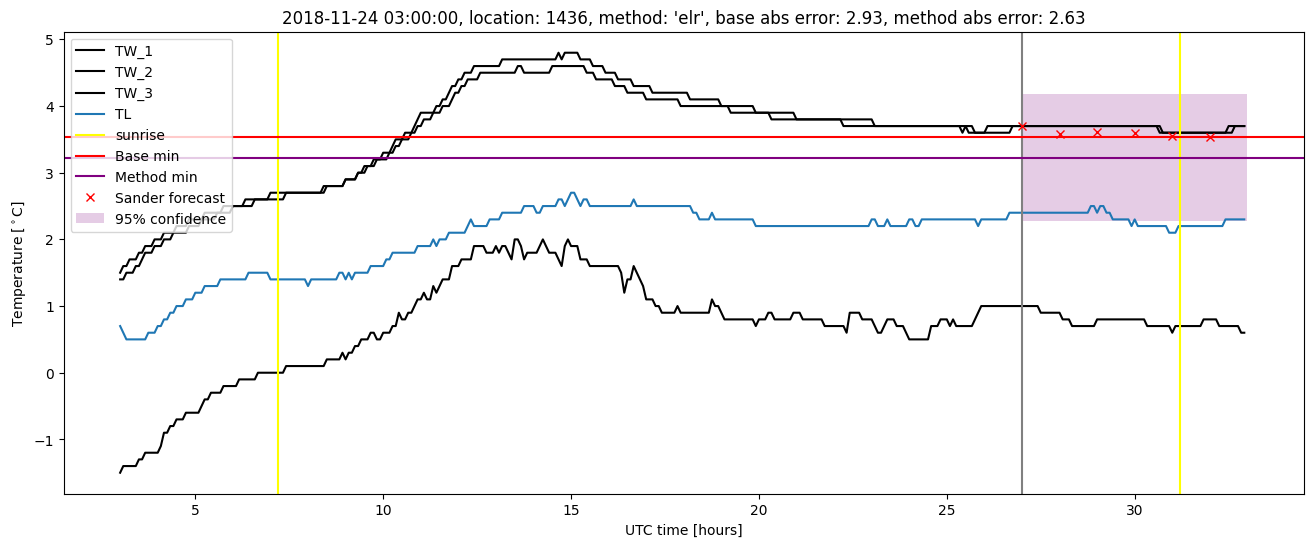
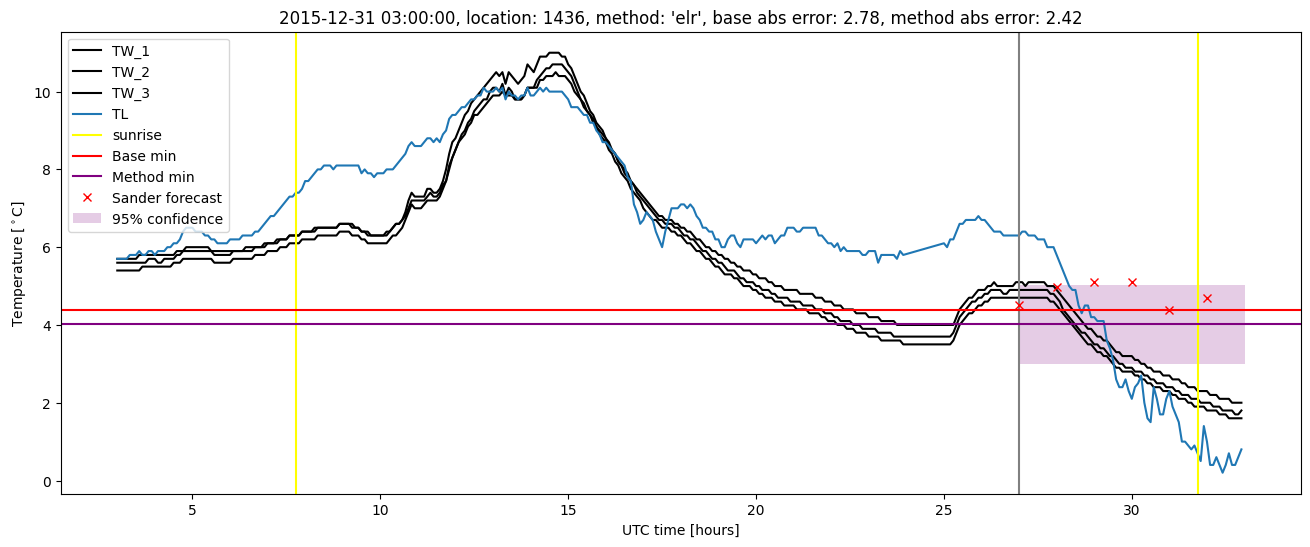
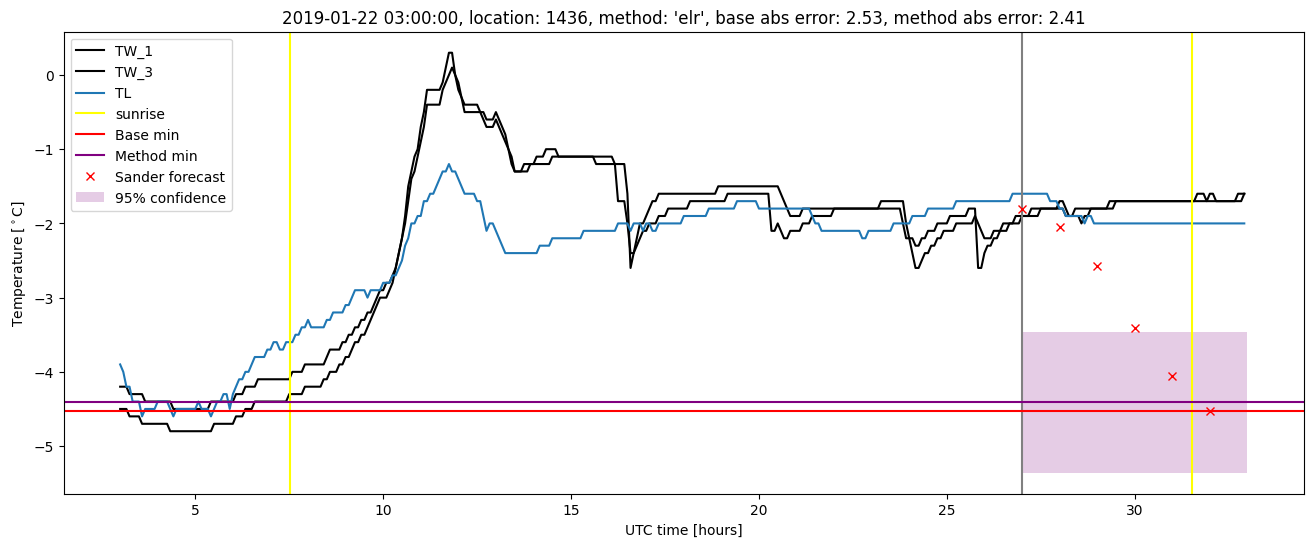
Extended logistic regression plots