GMS location: 1435
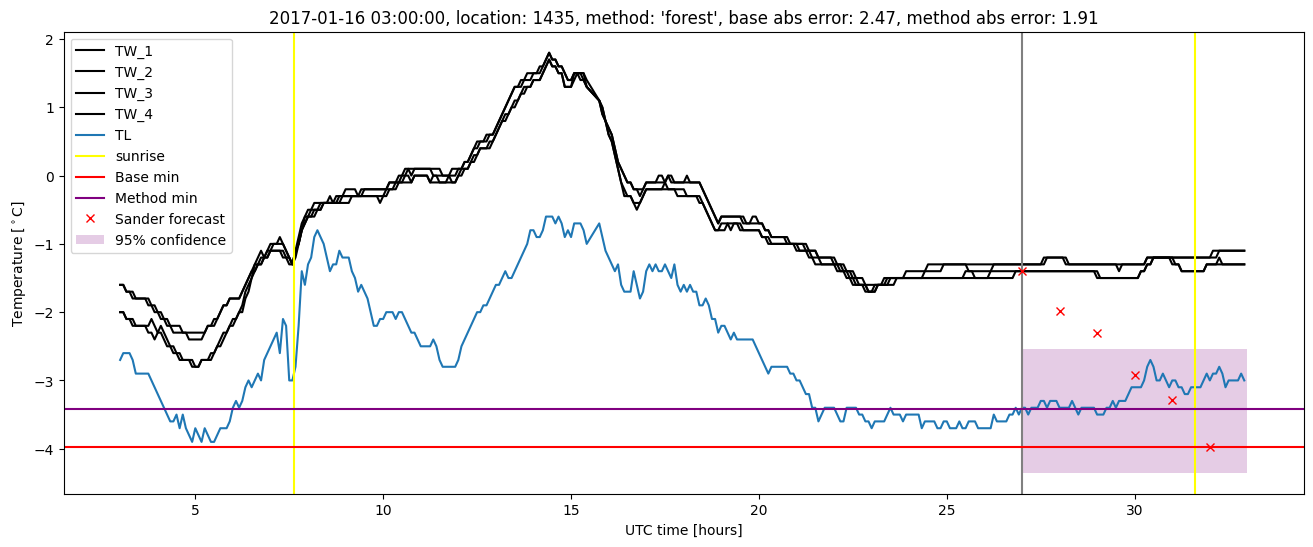
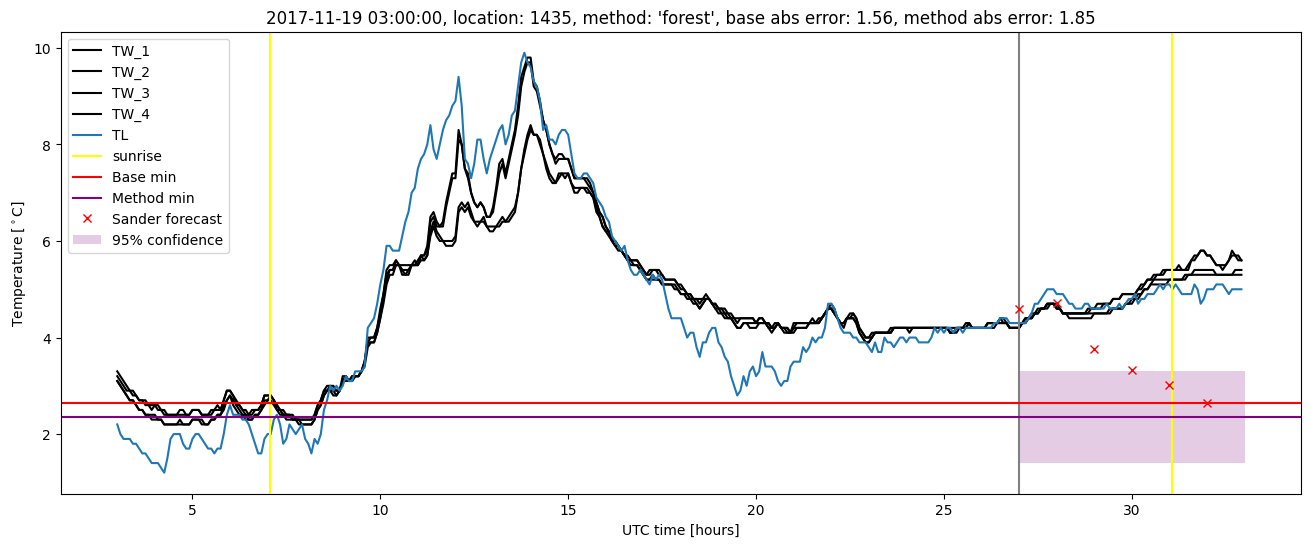
Random forest results
| names |
period |
power |
significance |
meanSquareError |
absError |
maxError |
CRPS |
IGN |
| baseline |
winter 2016 |
0.994 |
0.032 |
0.334 |
0.414 |
3.400 |
NaN |
NaN |
| forest |
winter 2016 |
0.981 |
0.000e+00 |
0.296 |
0.383 |
3.084 |
0.472 |
3.885 |
| baseline |
winter 2017 |
0.982 |
0.093 |
0.392 |
0.436 |
2.470 |
NaN |
NaN |
| forest |
winter 2017 |
0.982 |
0.070 |
0.327 |
0.417 |
2.095 |
0.462 |
2.636 |
| baseline |
winter 2018 |
0.993 |
0.083 |
0.430 |
0.498 |
2.146 |
NaN |
NaN |
| forest |
winter 2018 |
0.993 |
0.028 |
0.332 |
0.439 |
1.953 |
0.472 |
2.872 |
| baseline |
winter 2019 |
0.984 |
0.048 |
0.391 |
0.459 |
2.046 |
NaN |
NaN |
| forest |
winter 2019 |
1.000 |
0.143 |
0.280 |
0.391 |
1.736 |
0.464 |
3.097 |
| baseline |
all |
0.989 |
0.069 |
0.385 |
0.451 |
3.400 |
NaN |
NaN |
| forest |
all |
0.989 |
0.053 |
0.309 |
0.407 |
3.084 |
0.468 |
3.158 |
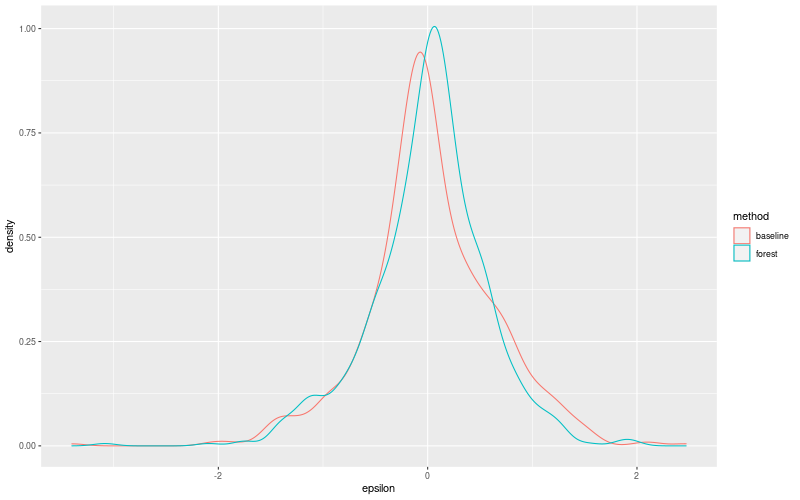
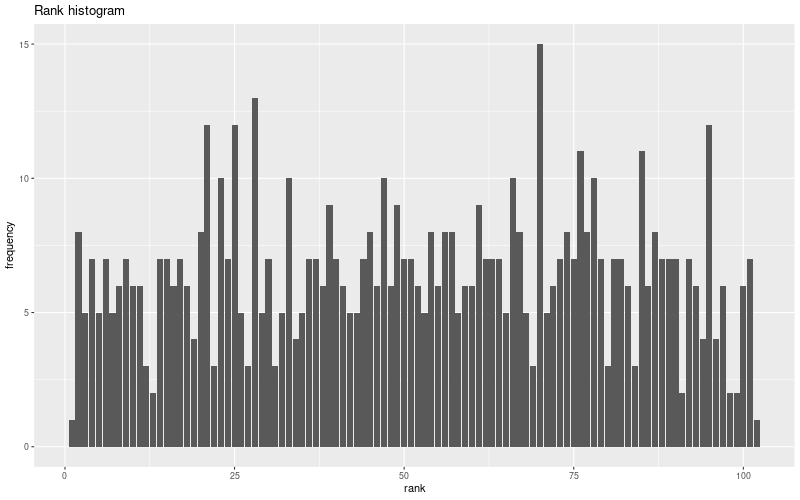
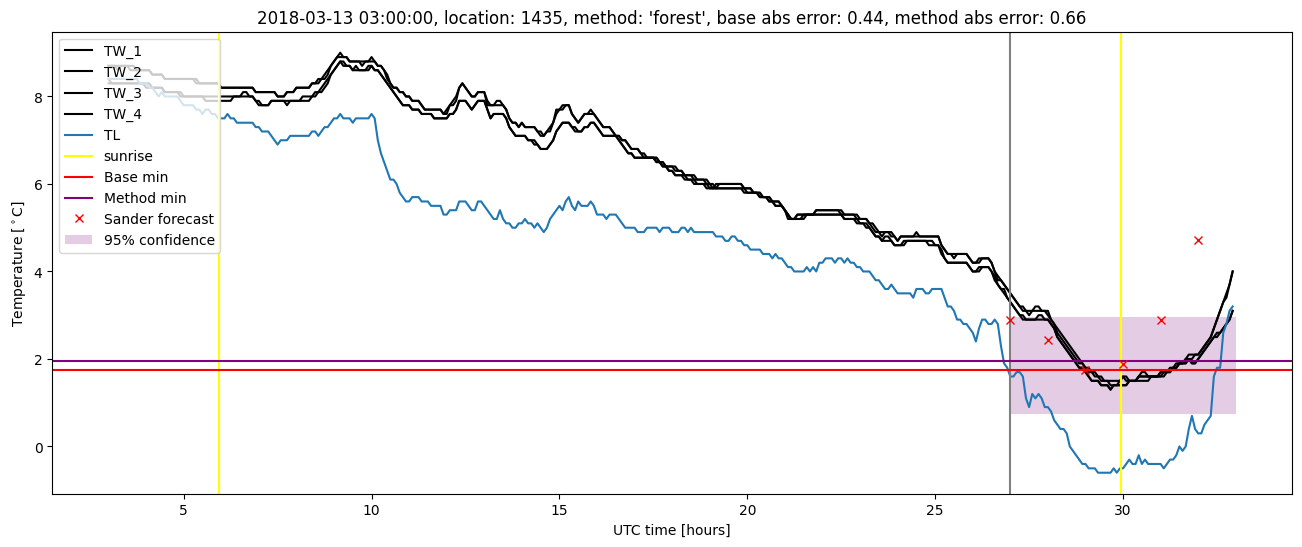
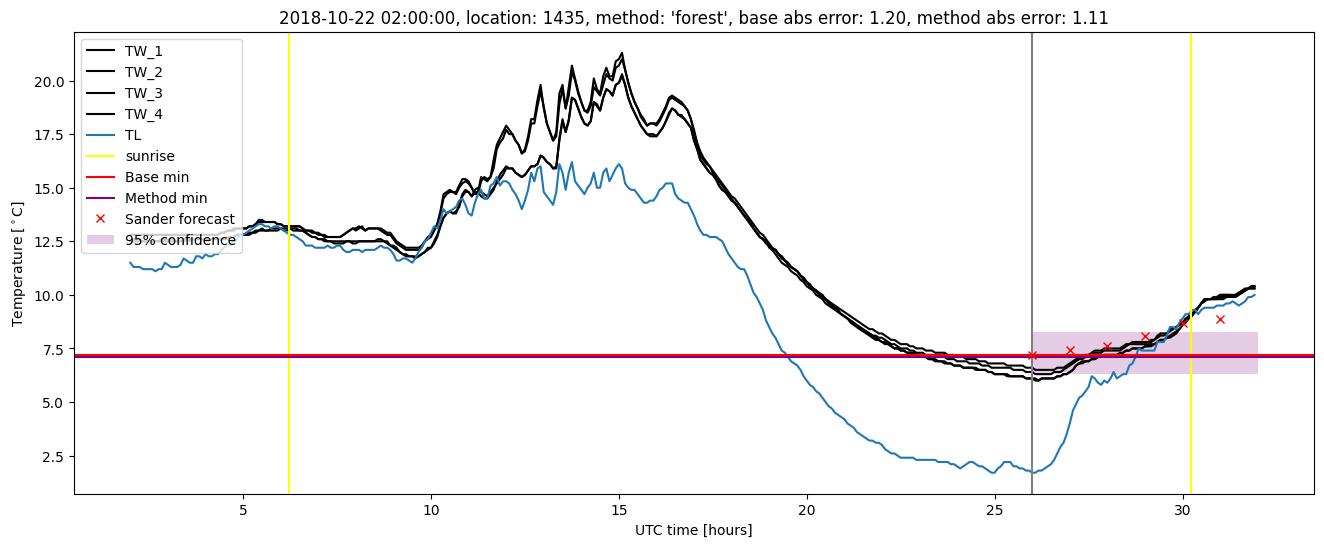
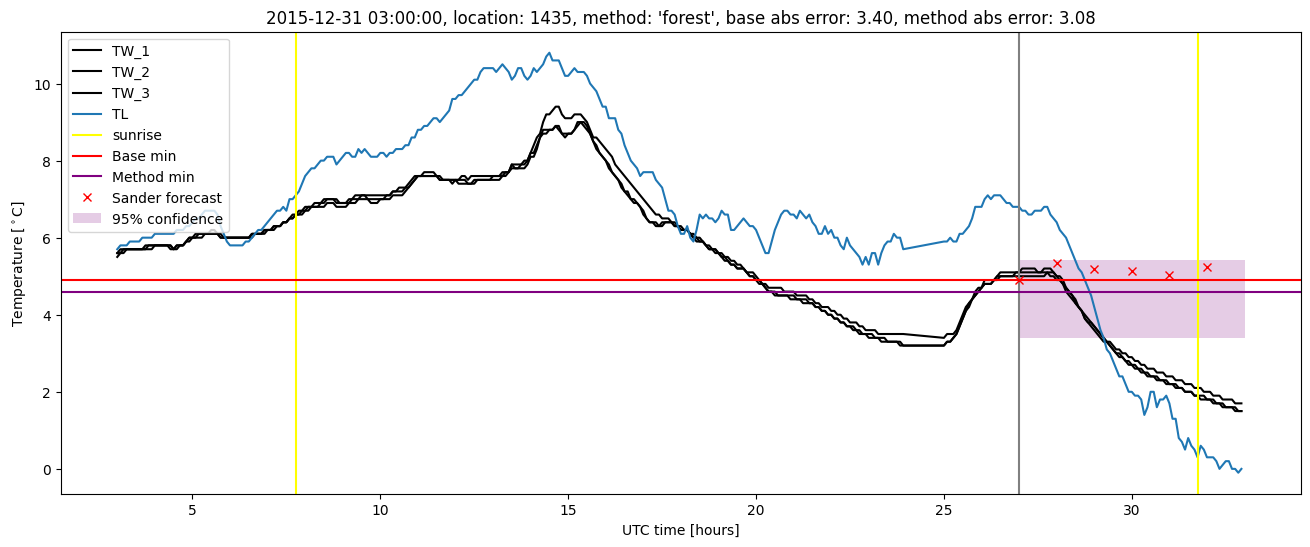
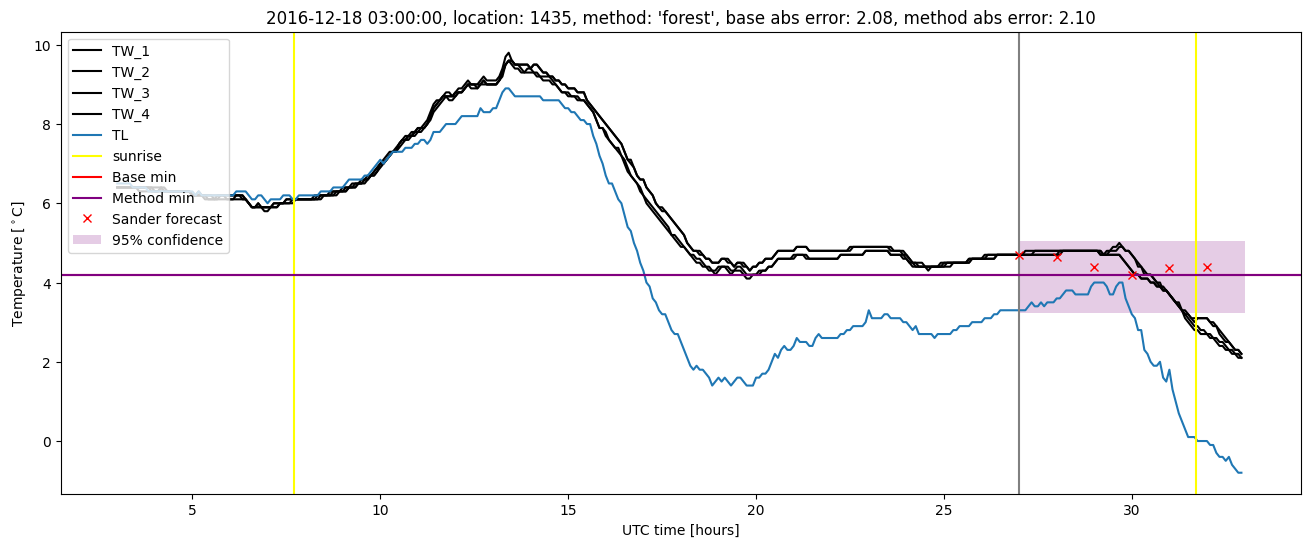
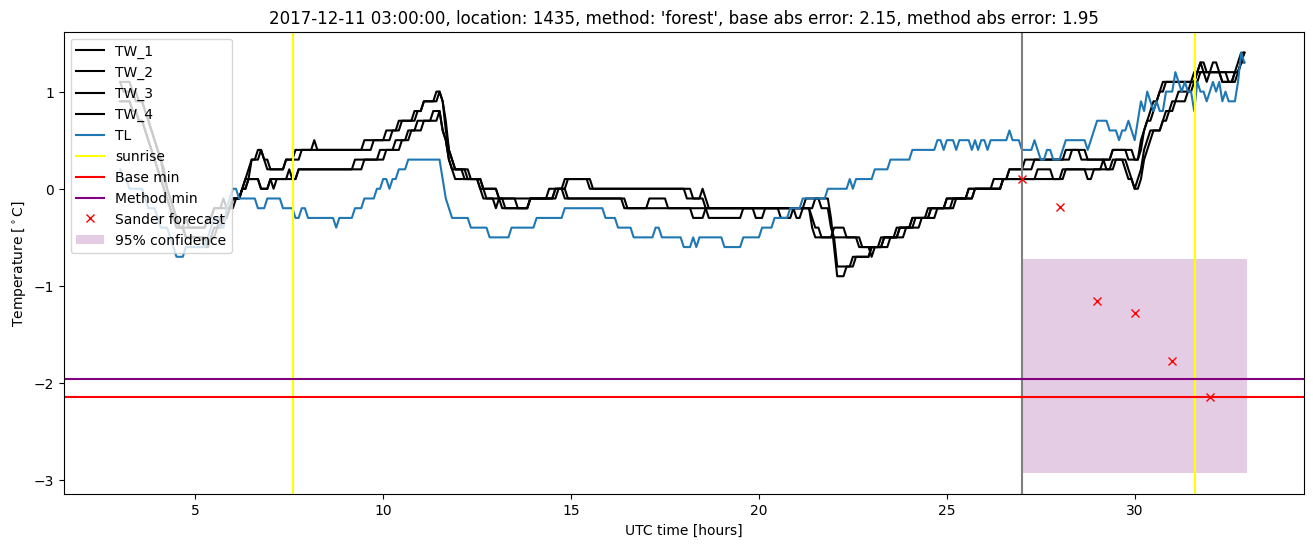
Random forest plots

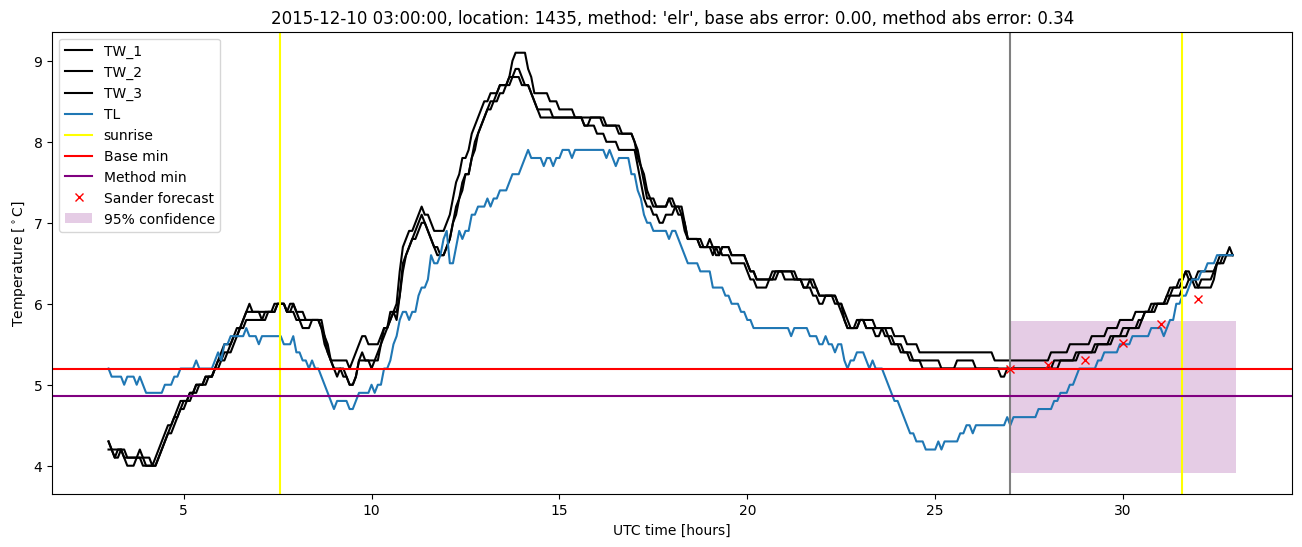
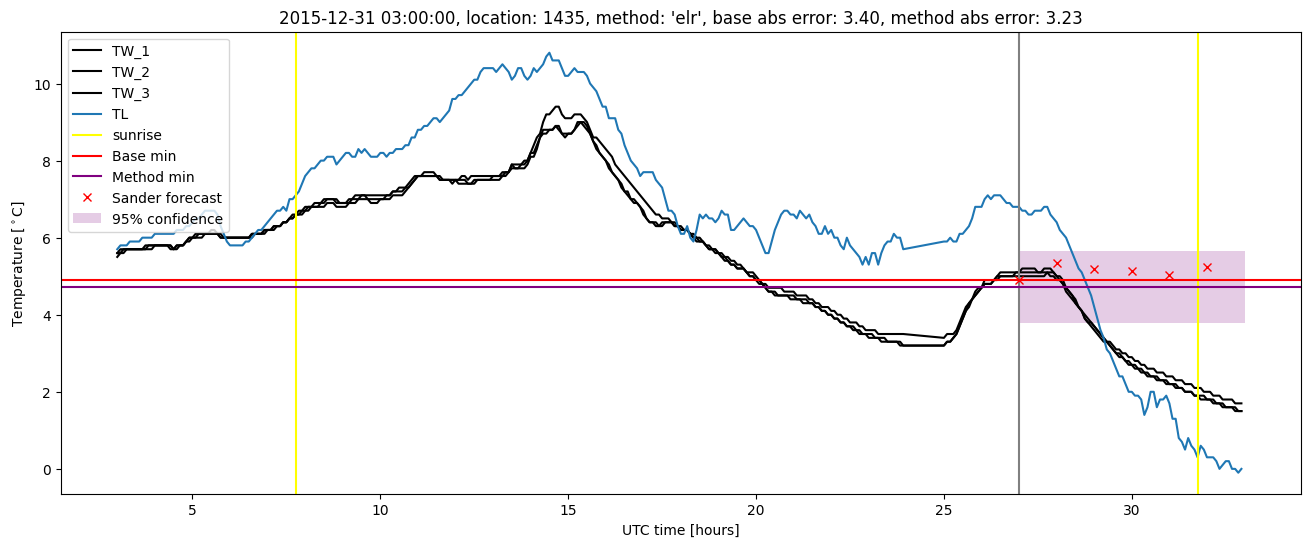
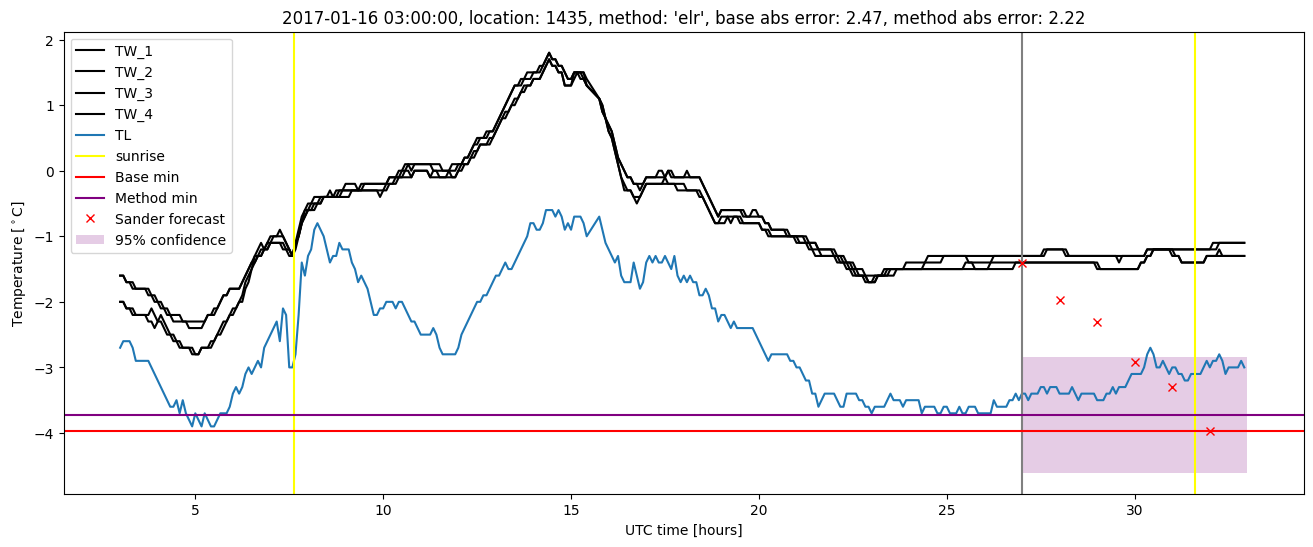
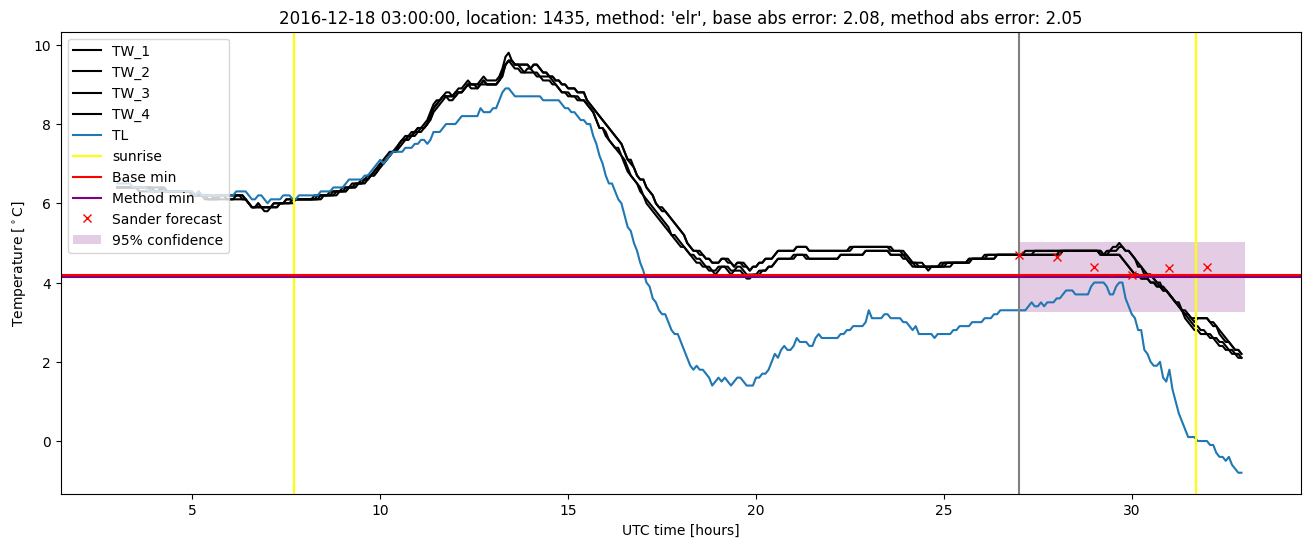
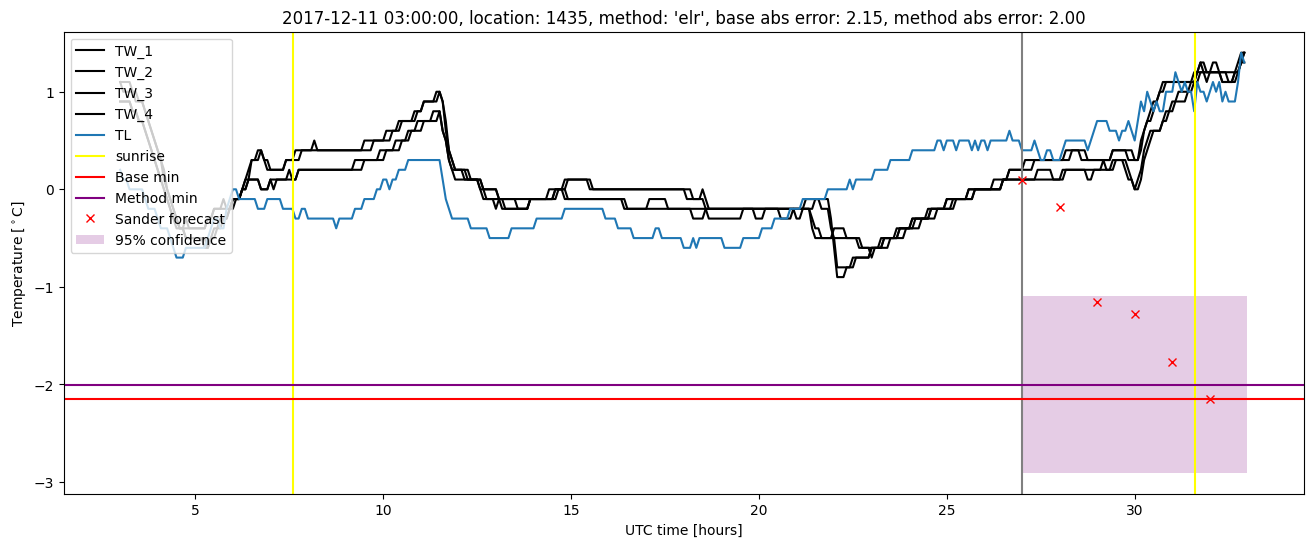
Extended logistic regression results
| names |
period |
power |
significance |
meanSquareError |
absError |
maxError |
CRPS |
IGN |
| baseline |
winter 2016 |
0.994 |
0.032 |
0.334 |
0.414 |
3.400 |
NaN |
NaN |
| elr |
winter 2016 |
0.981 |
0.032 |
0.323 |
0.415 |
3.230 |
0.520 |
3.231 |
| baseline |
winter 2017 |
0.982 |
0.093 |
0.392 |
0.436 |
2.470 |
NaN |
NaN |
| elr |
winter 2017 |
0.982 |
0.046 |
0.367 |
0.450 |
2.225 |
0.537 |
4.185 |
| baseline |
winter 2018 |
0.993 |
0.083 |
0.430 |
0.498 |
2.146 |
NaN |
NaN |
| elr |
winter 2018 |
0.978 |
0.000e+00 |
0.415 |
0.493 |
2.003 |
0.545 |
3.987 |
| baseline |
winter 2019 |
0.984 |
0.048 |
0.391 |
0.459 |
2.046 |
NaN |
NaN |
| elr |
winter 2019 |
1.000 |
0.095 |
0.320 |
0.439 |
1.884 |
0.508 |
3.115 |
| baseline |
all |
0.989 |
0.069 |
0.385 |
0.451 |
3.400 |
NaN |
NaN |
| elr |
all |
0.985 |
0.038 |
0.356 |
0.449 |
3.230 |
0.528 |
3.620 |
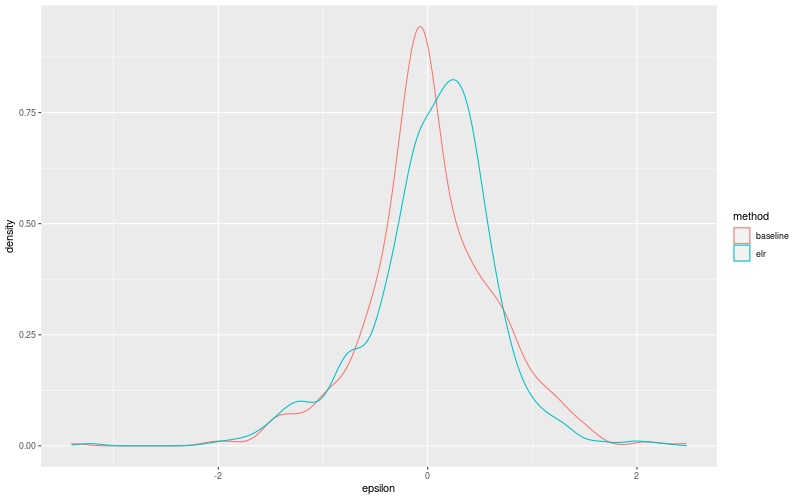
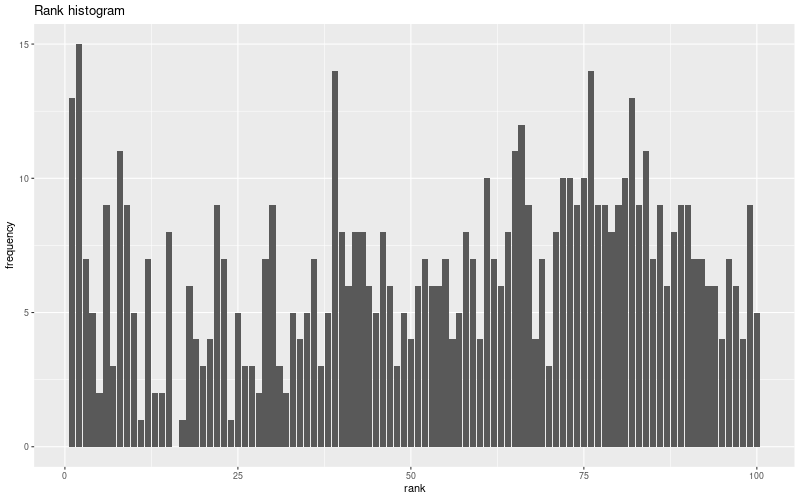
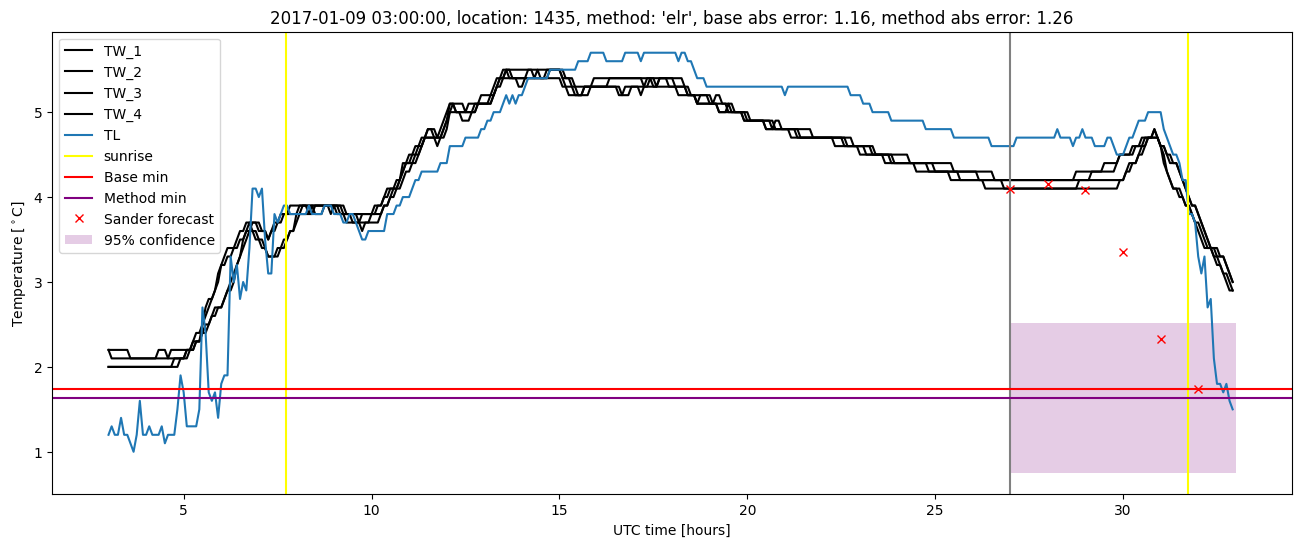
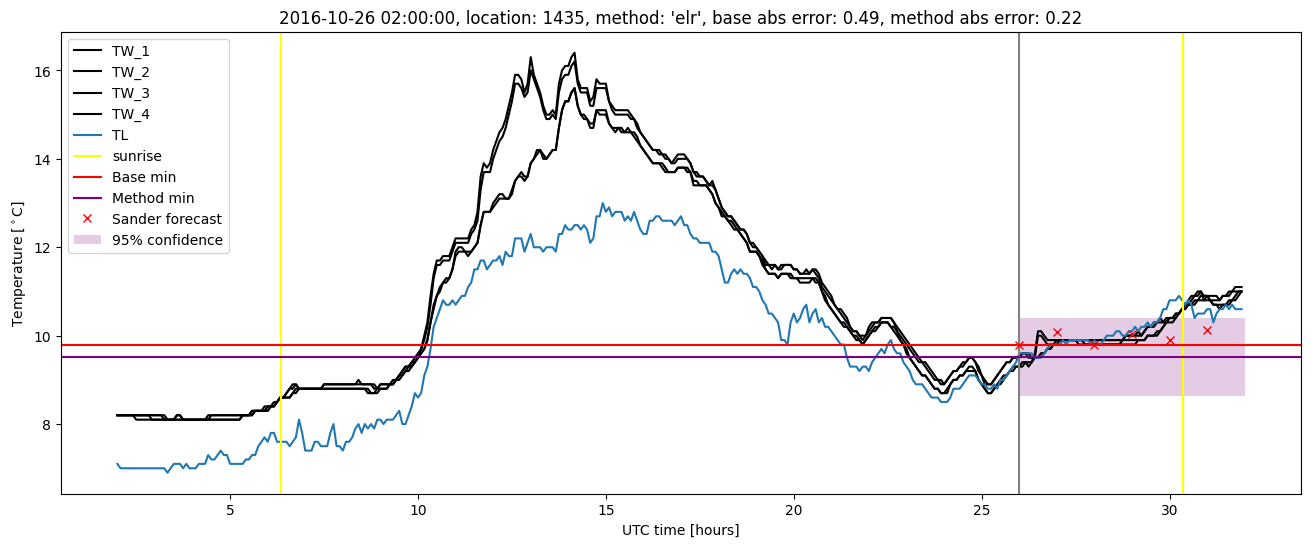
Extended logistic regression plots