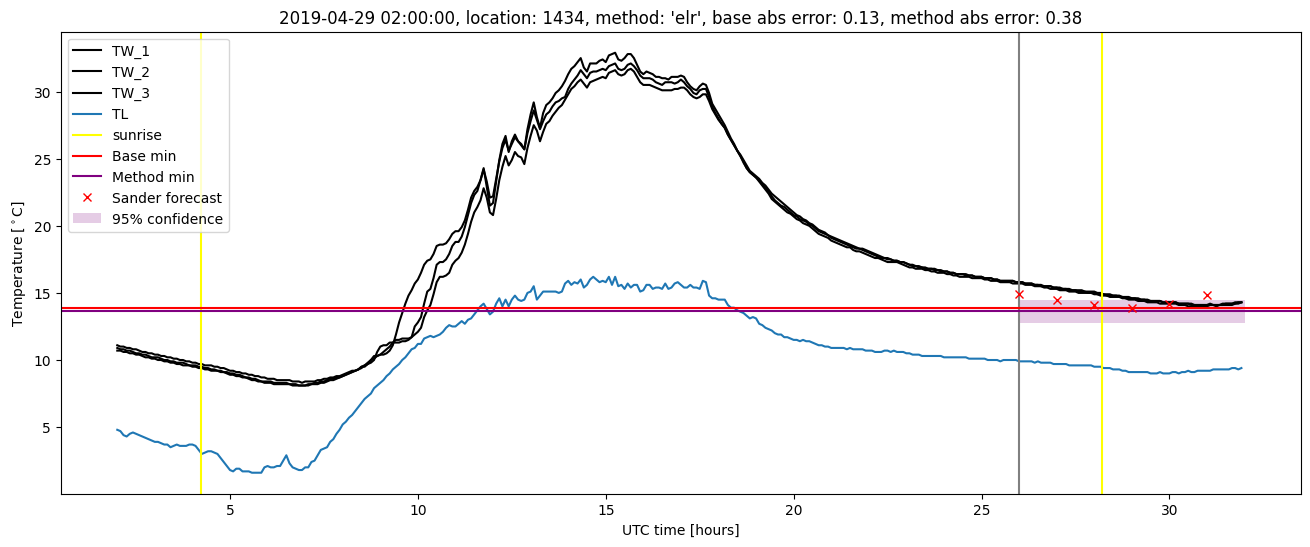
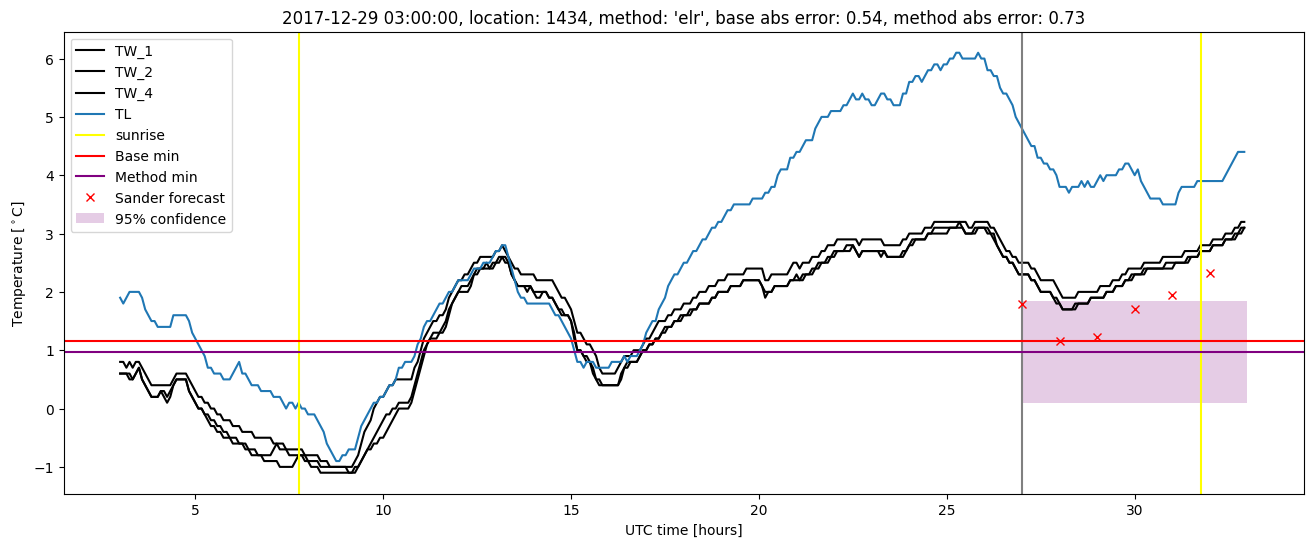
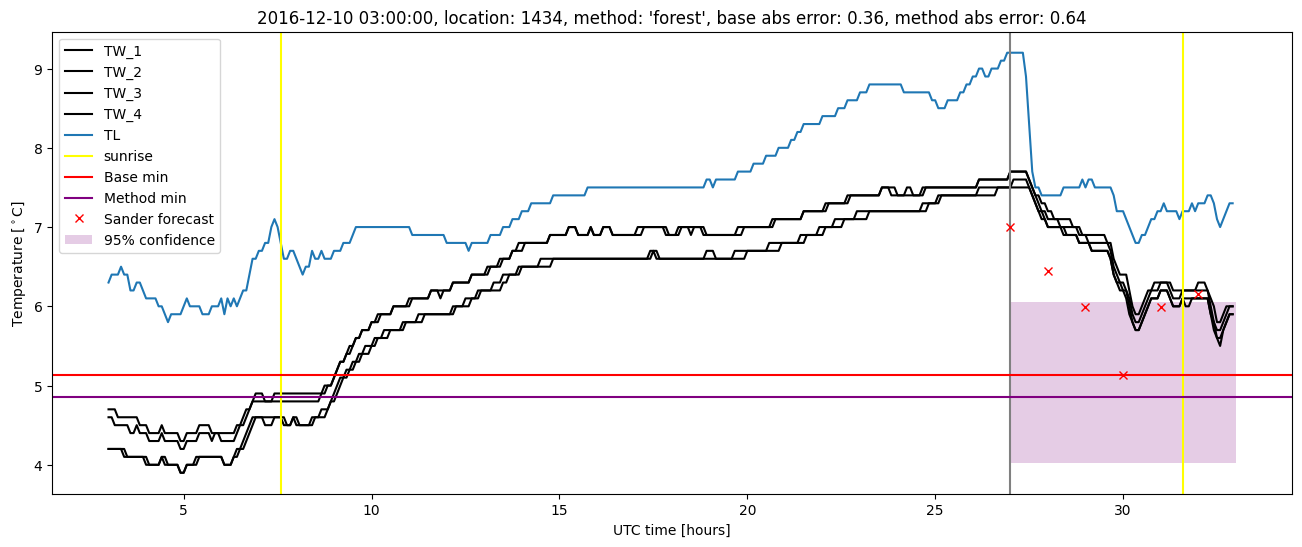
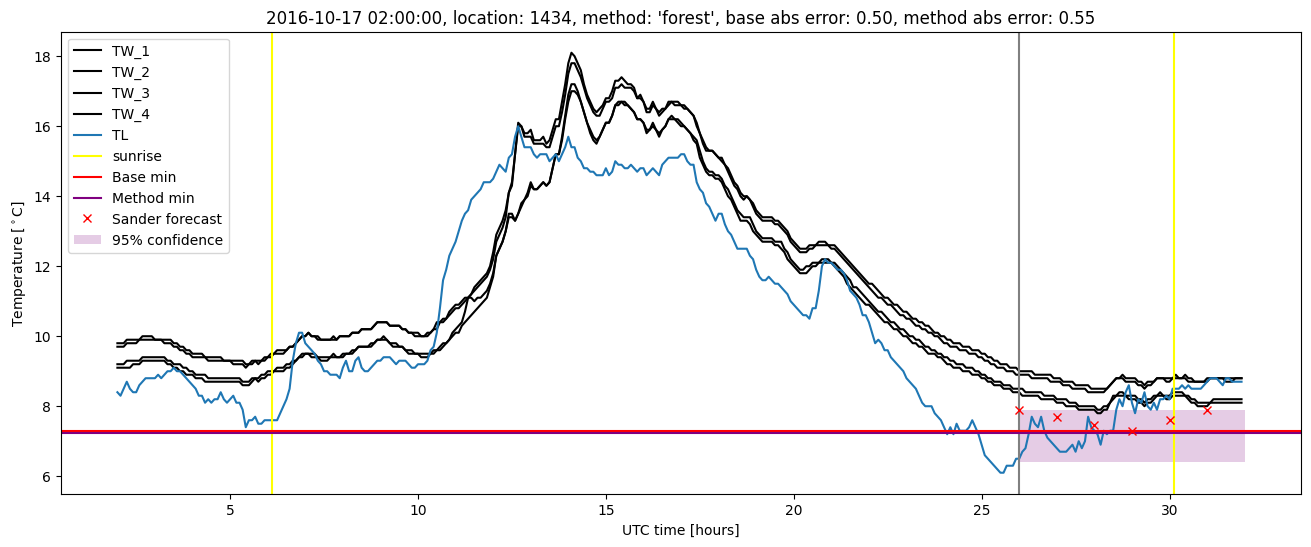
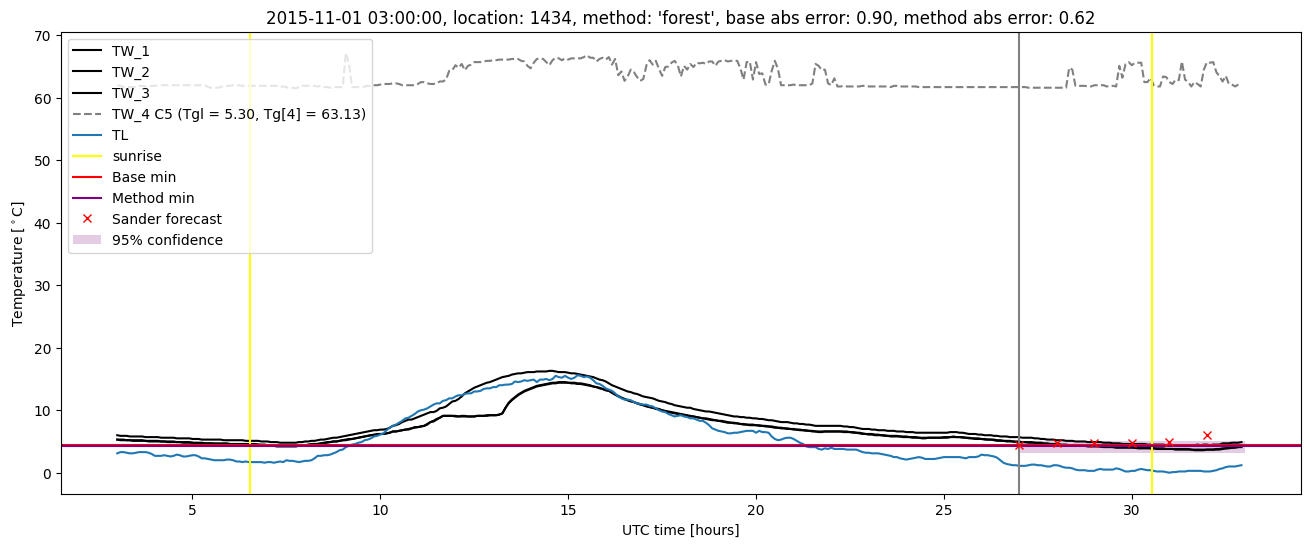
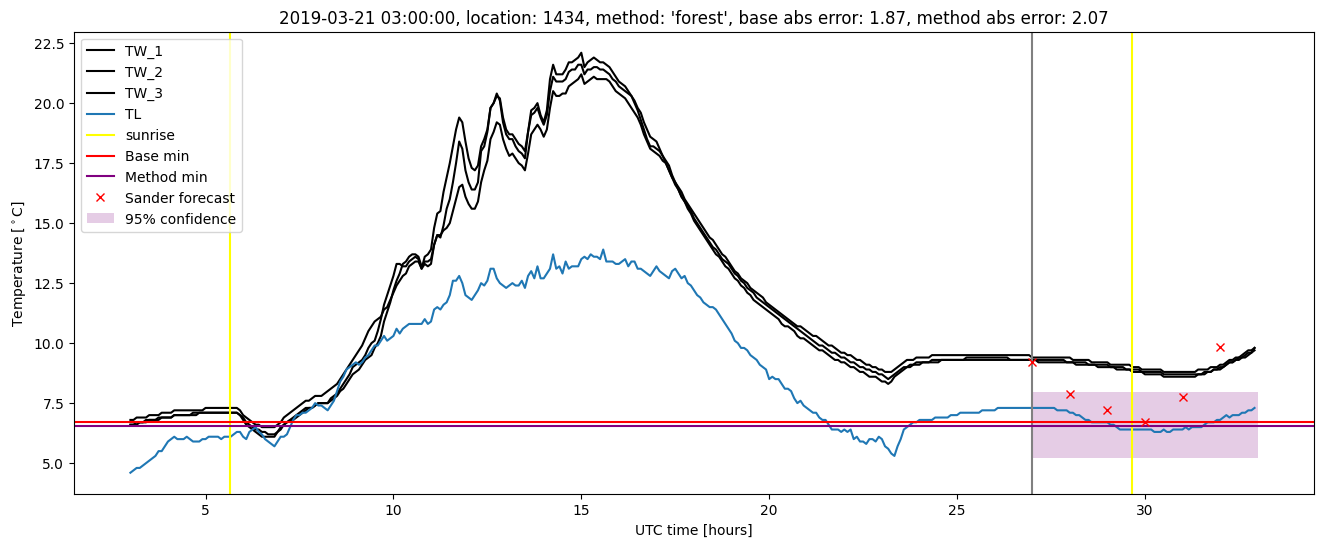
GMS location: 1434
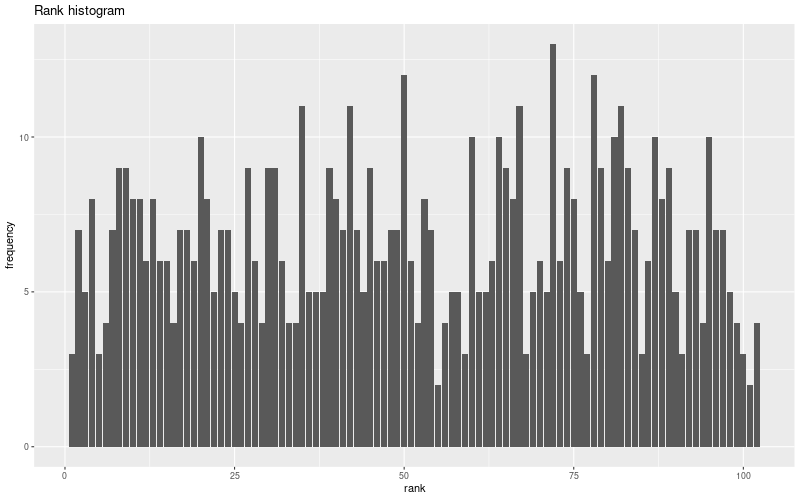
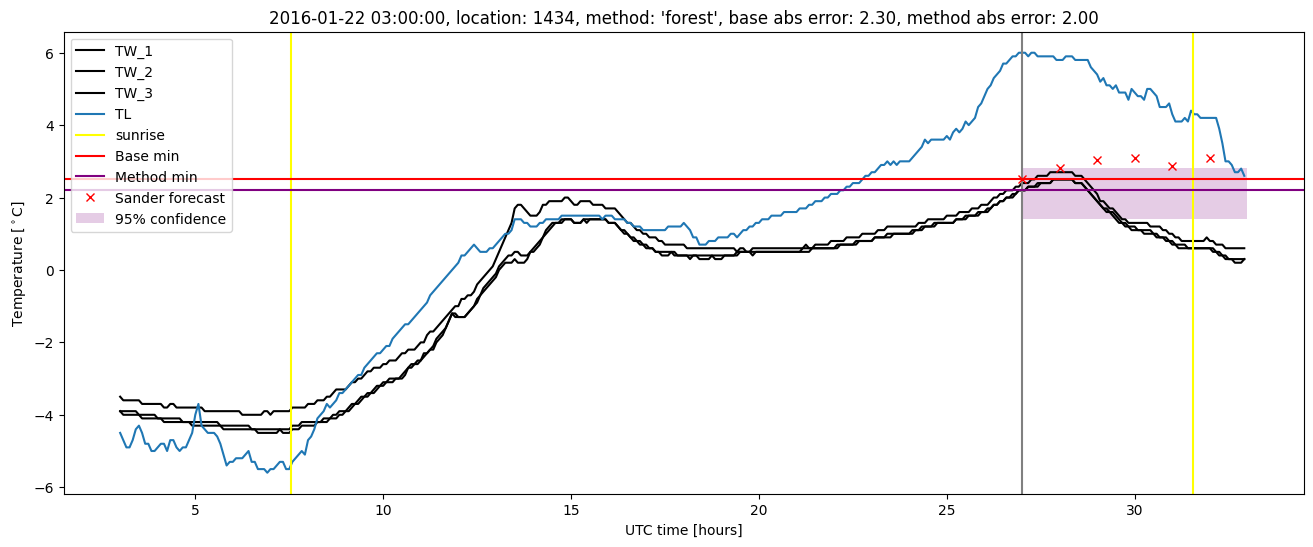
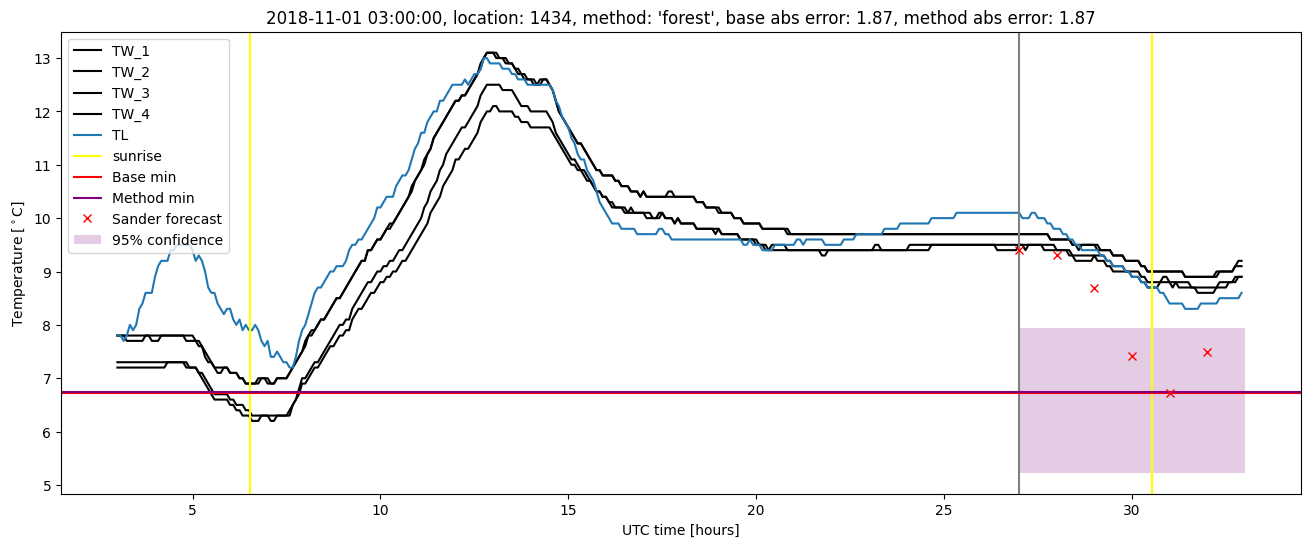
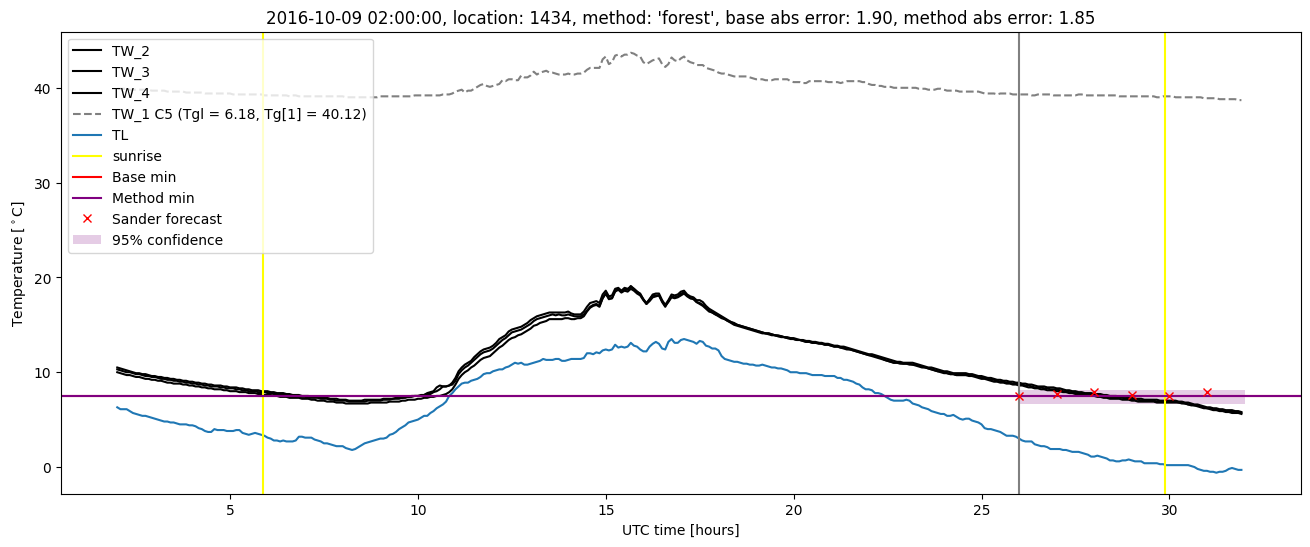
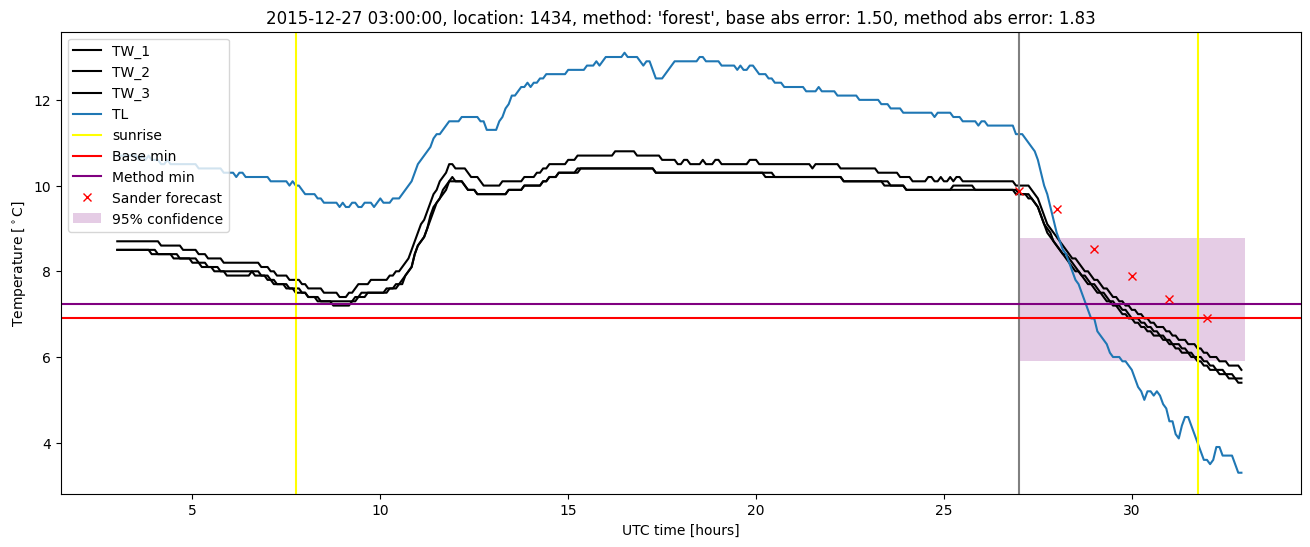
Random forest results
| names |
period |
power |
significance |
meanSquareError |
absError |
maxError |
CRPS |
IGN |
| baseline |
winter 2016 |
0.988 |
0.074 |
0.297 |
0.378 |
2.300 |
NaN |
NaN |
| forest |
winter 2016 |
0.963 |
0.037 |
0.265 |
0.366 |
2.000 |
0.519 |
6.034 |
| baseline |
winter 2017 |
0.981 |
0.000e+00 |
0.320 |
0.405 |
2.267 |
NaN |
NaN |
| forest |
winter 2017 |
0.981 |
0.000e+00 |
0.289 |
0.399 |
1.853 |
0.495 |
4.037 |
| baseline |
winter 2018 |
1.000 |
0.103 |
0.329 |
0.431 |
1.601 |
NaN |
NaN |
| forest |
winter 2018 |
0.993 |
0.103 |
0.285 |
0.412 |
1.414 |
0.502 |
4.082 |
| baseline |
winter 2019 |
0.985 |
0.000e+00 |
0.323 |
0.382 |
2.041 |
NaN |
NaN |
| forest |
winter 2019 |
0.993 |
0.136 |
0.291 |
0.369 |
2.066 |
0.513 |
3.951 |
| baseline |
all |
0.989 |
0.045 |
0.316 |
0.399 |
2.300 |
NaN |
NaN |
| forest |
all |
0.982 |
0.061 |
0.282 |
0.386 |
2.066 |
0.508 |
4.587 |
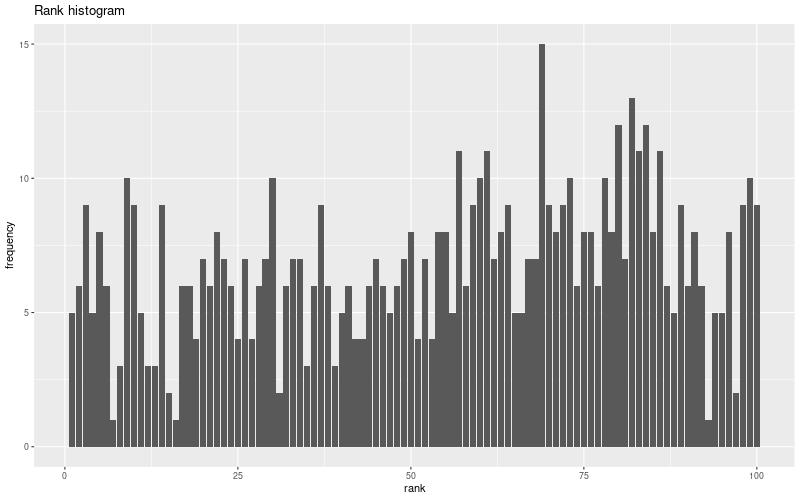
Random forest plots
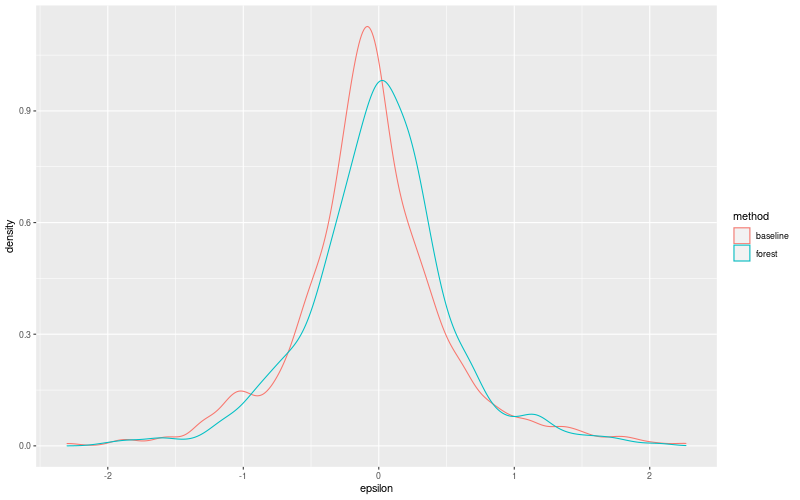
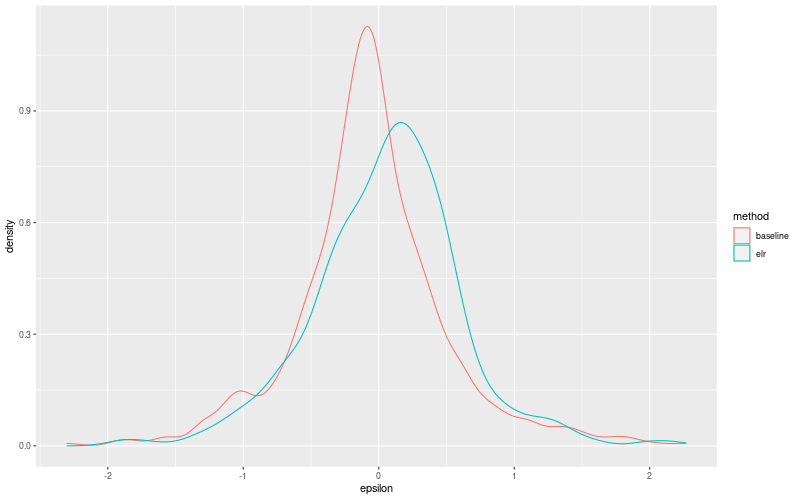
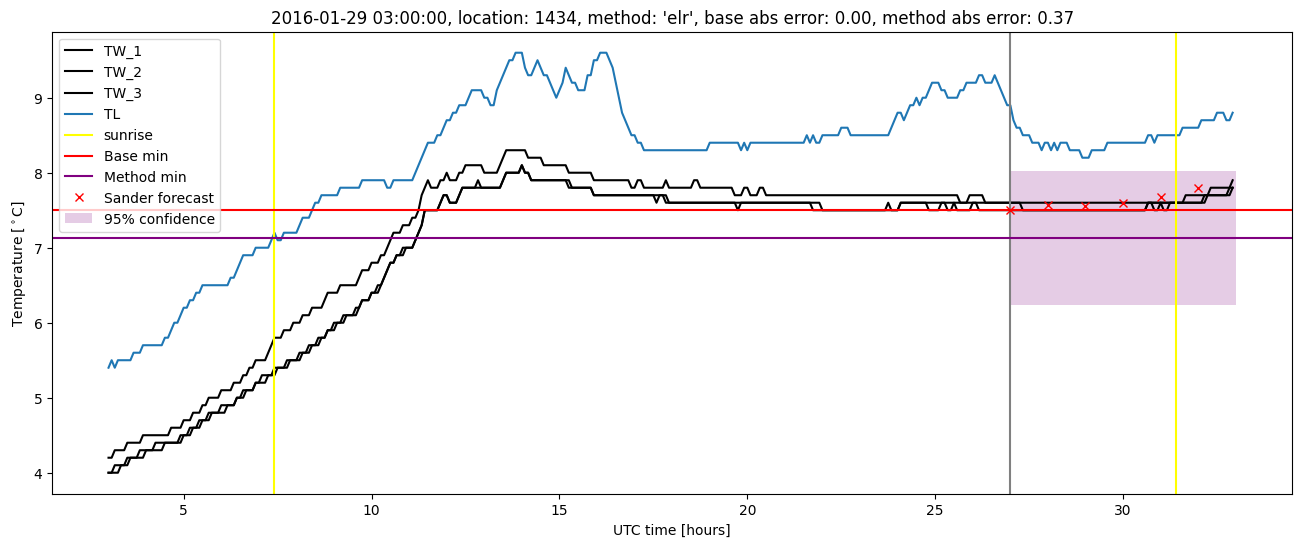
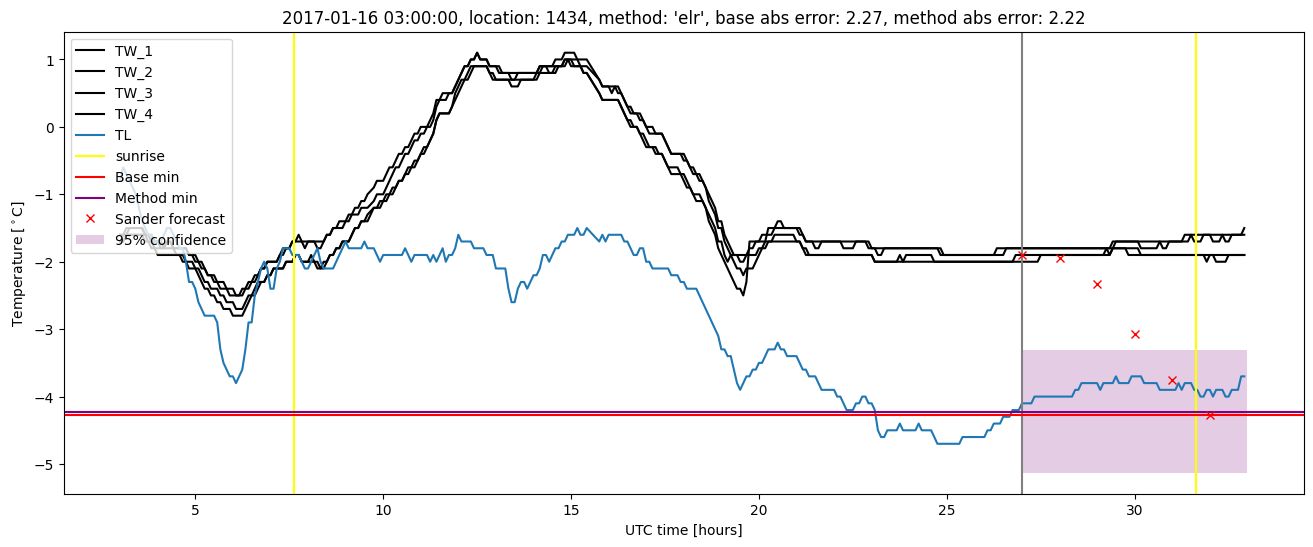
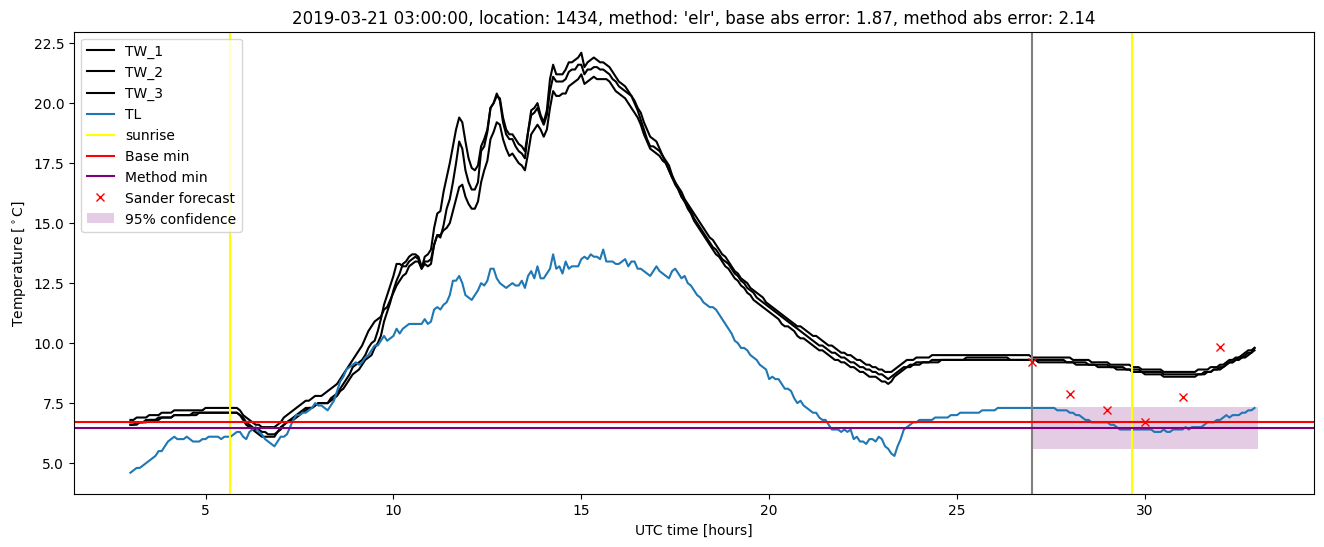
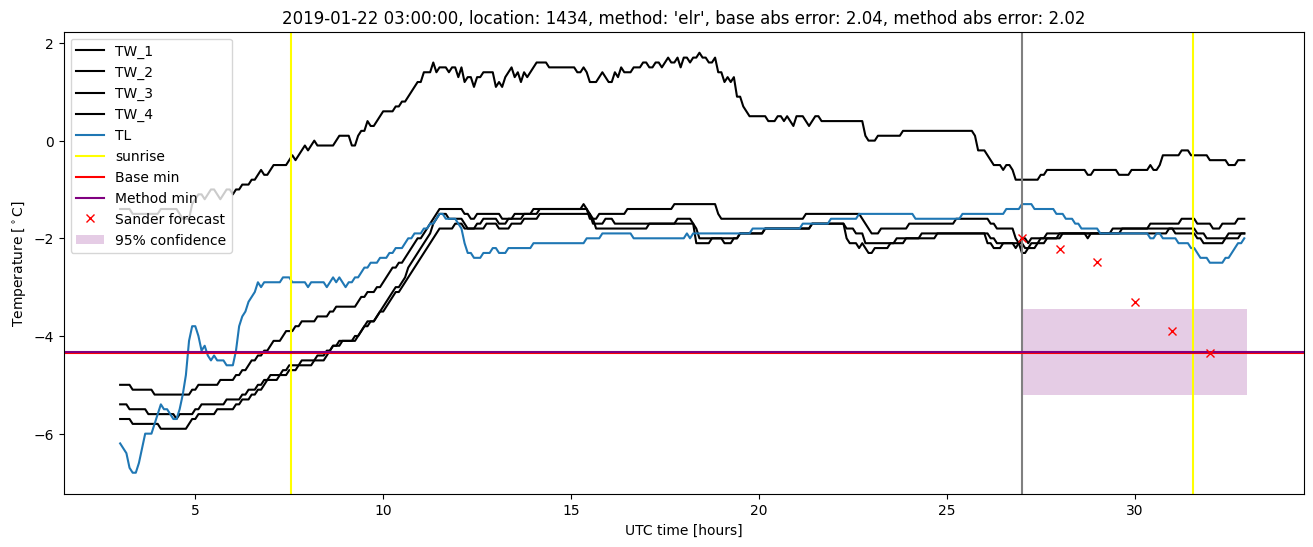
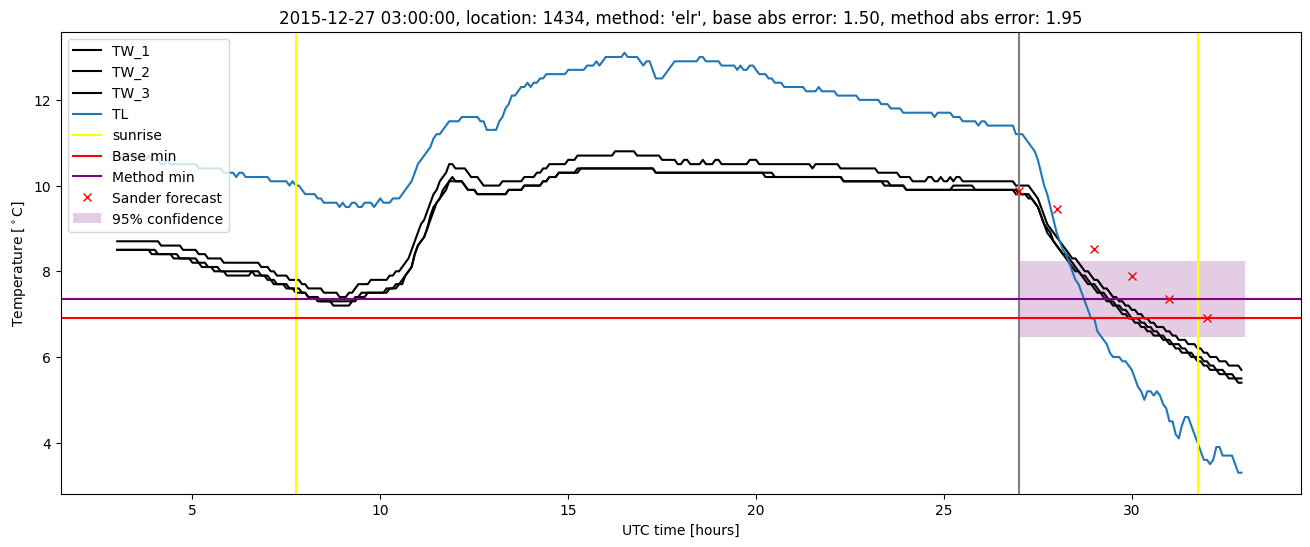
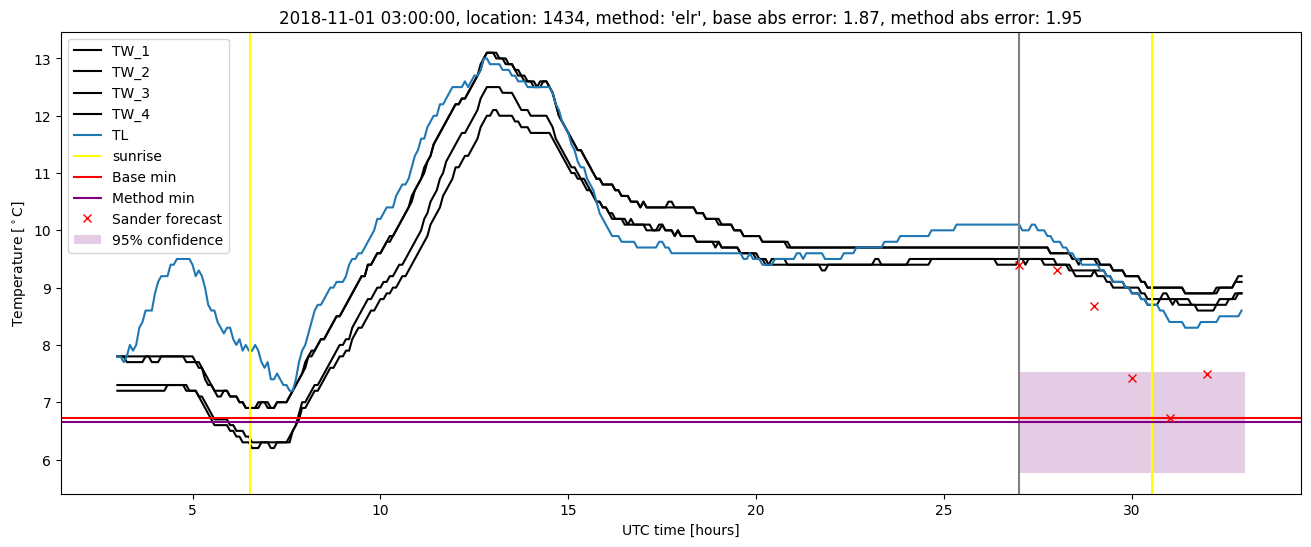
Extended logistic regression results
| names |
period |
power |
significance |
meanSquareError |
absError |
maxError |
CRPS |
IGN |
| baseline |
winter 2016 |
0.988 |
0.074 |
0.297 |
0.378 |
2.300 |
NaN |
NaN |
| elr |
winter 2016 |
0.963 |
0.000e+00 |
0.288 |
0.400 |
1.951 |
0.570 |
4.456 |
| baseline |
winter 2017 |
0.981 |
0.000e+00 |
0.320 |
0.405 |
2.267 |
NaN |
NaN |
| elr |
winter 2017 |
0.972 |
0.000e+00 |
0.298 |
0.413 |
2.222 |
0.583 |
4.425 |
| baseline |
winter 2018 |
1.000 |
0.103 |
0.329 |
0.431 |
1.601 |
NaN |
NaN |
| elr |
winter 2018 |
0.979 |
0.103 |
0.297 |
0.432 |
1.350 |
0.567 |
4.705 |
| baseline |
winter 2019 |
0.985 |
0.000e+00 |
0.323 |
0.382 |
2.041 |
NaN |
NaN |
| elr |
winter 2019 |
0.985 |
0.091 |
0.328 |
0.418 |
2.135 |
0.566 |
4.676 |
| baseline |
all |
0.989 |
0.045 |
0.316 |
0.399 |
2.300 |
NaN |
NaN |
| elr |
all |
0.974 |
0.045 |
0.302 |
0.415 |
2.222 |
0.571 |
4.567 |
Extended logistic regression plots