GMS location: 1433
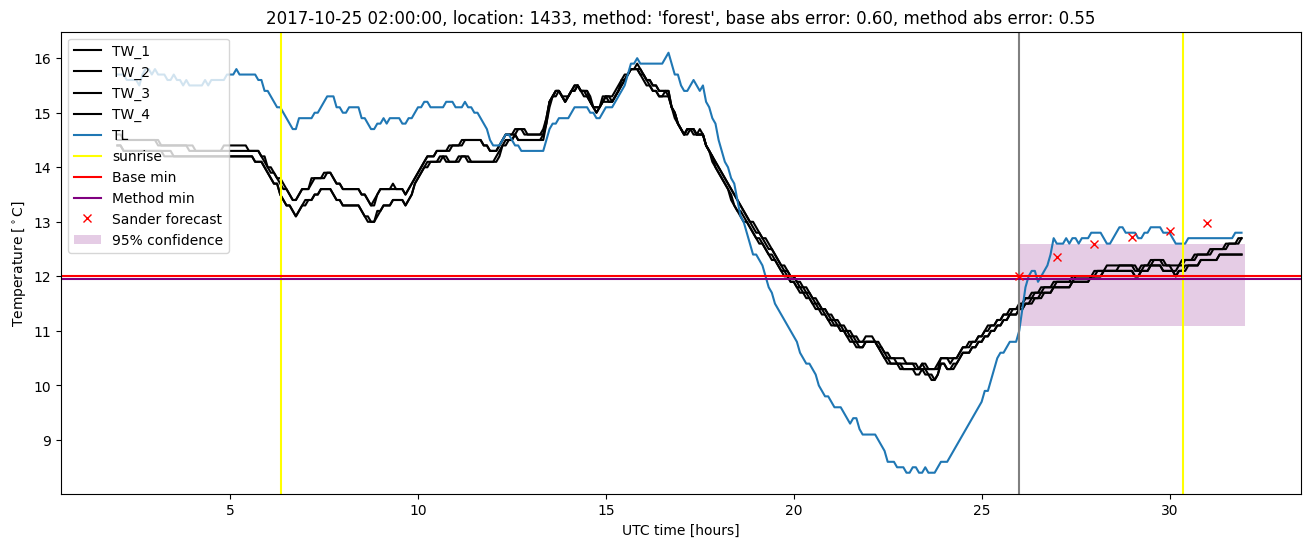
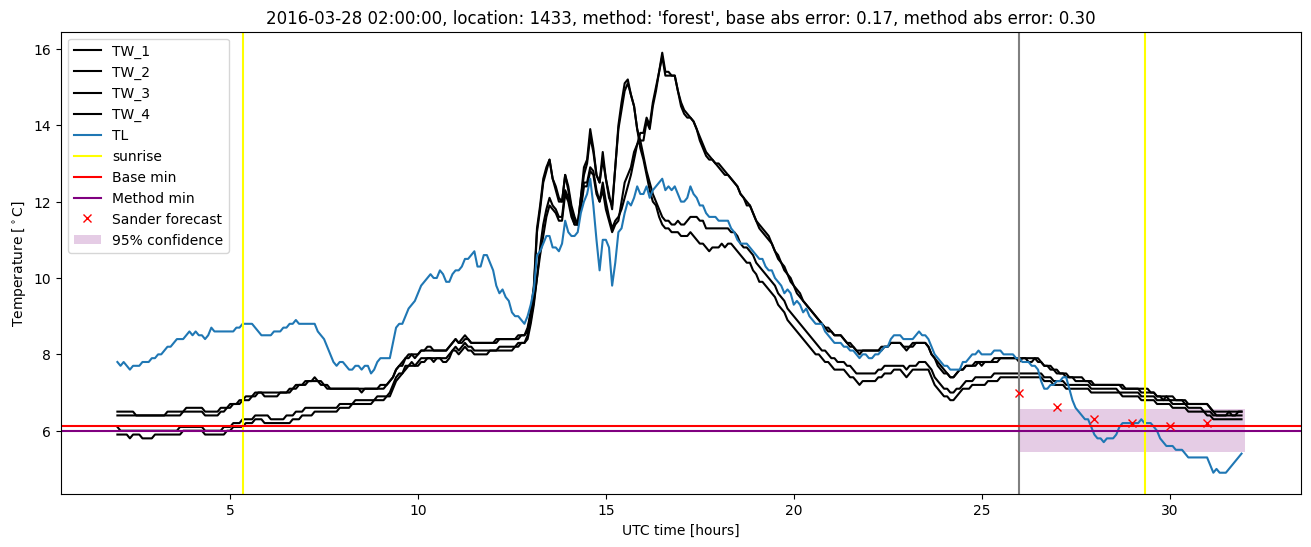
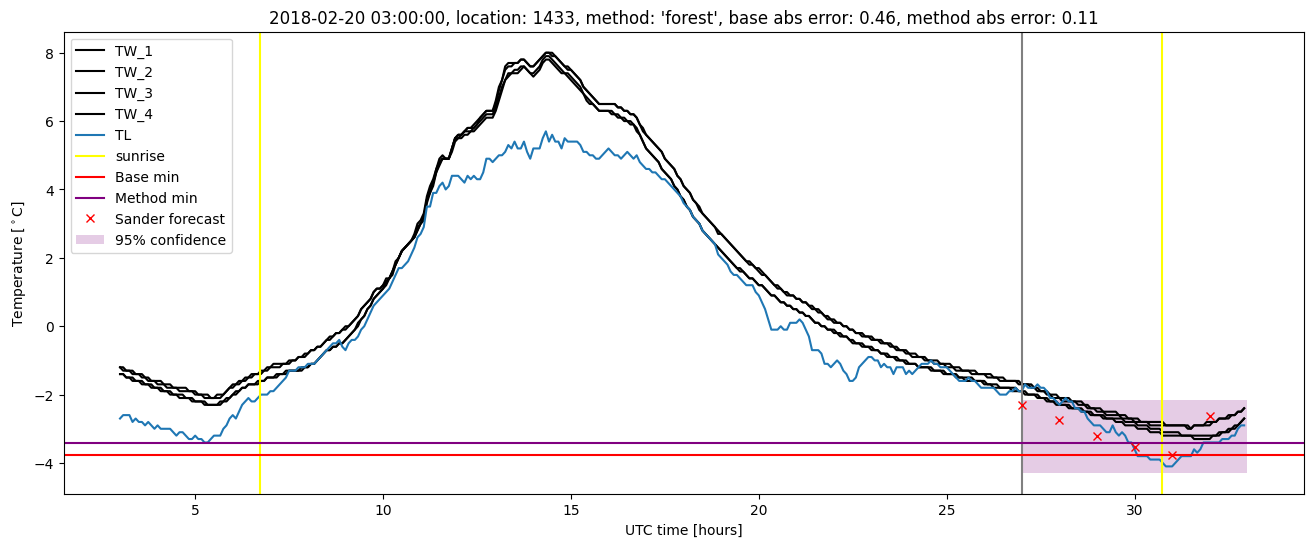
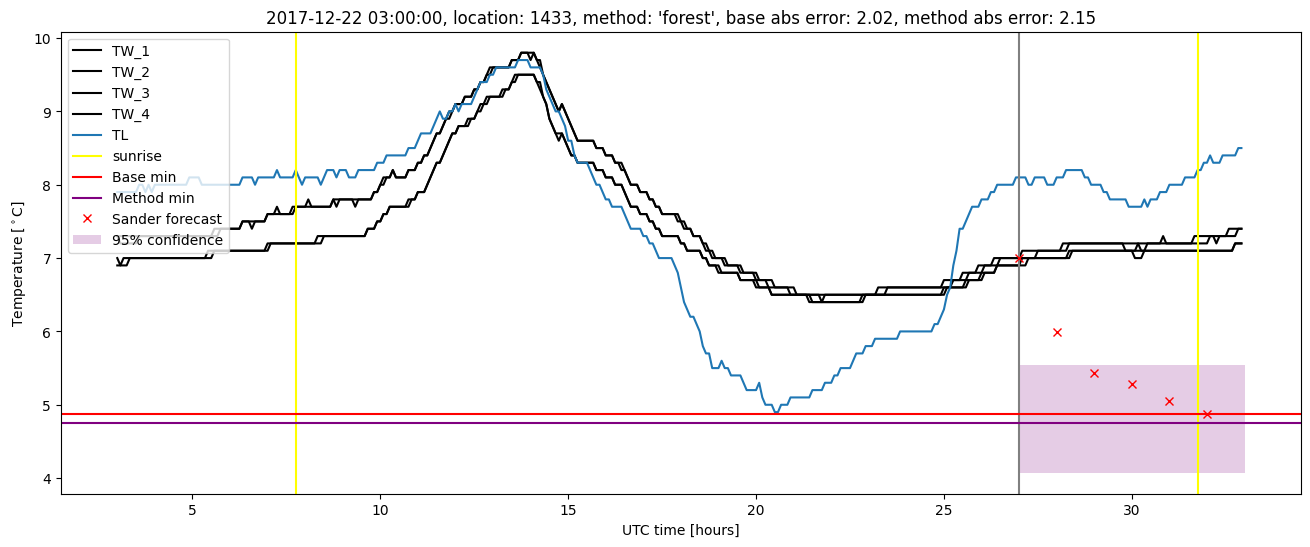
Random forest results
| names |
period |
power |
significance |
meanSquareError |
absError |
maxError |
CRPS |
IGN |
| baseline |
winter 2016 |
1.000 |
0.097 |
0.282 |
0.391 |
2.249 |
NaN |
NaN |
| forest |
winter 2016 |
0.994 |
0.097 |
0.258 |
0.373 |
2.150 |
0.498 |
4.408 |
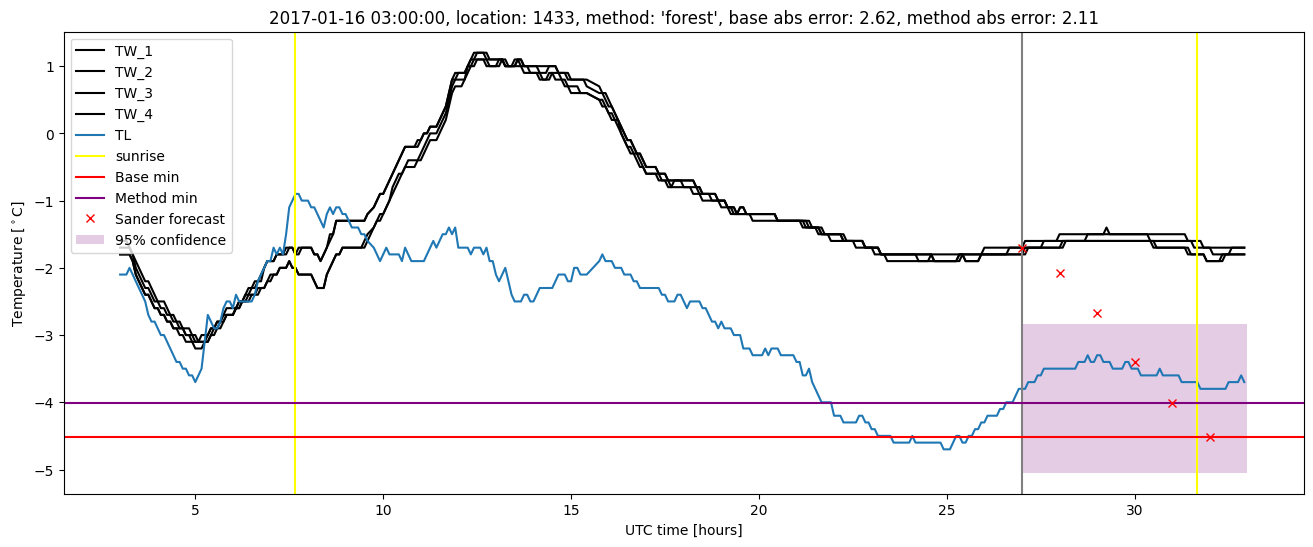
| baseline |
winter 2017 |
0.971 |
0.024 |
0.380 |
0.431 |
2.622 |
NaN |
NaN |
| forest |
winter 2017 |
0.981 |
0.000e+00 |
0.331 |
0.413 |
2.106 |
0.483 |
5.332 |
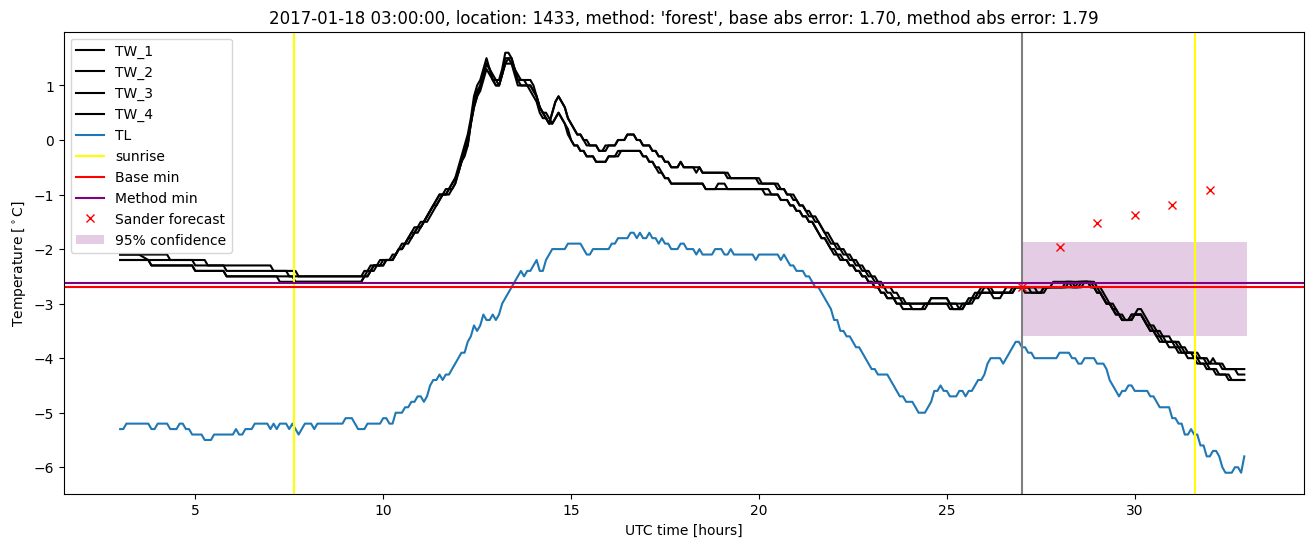
| baseline |
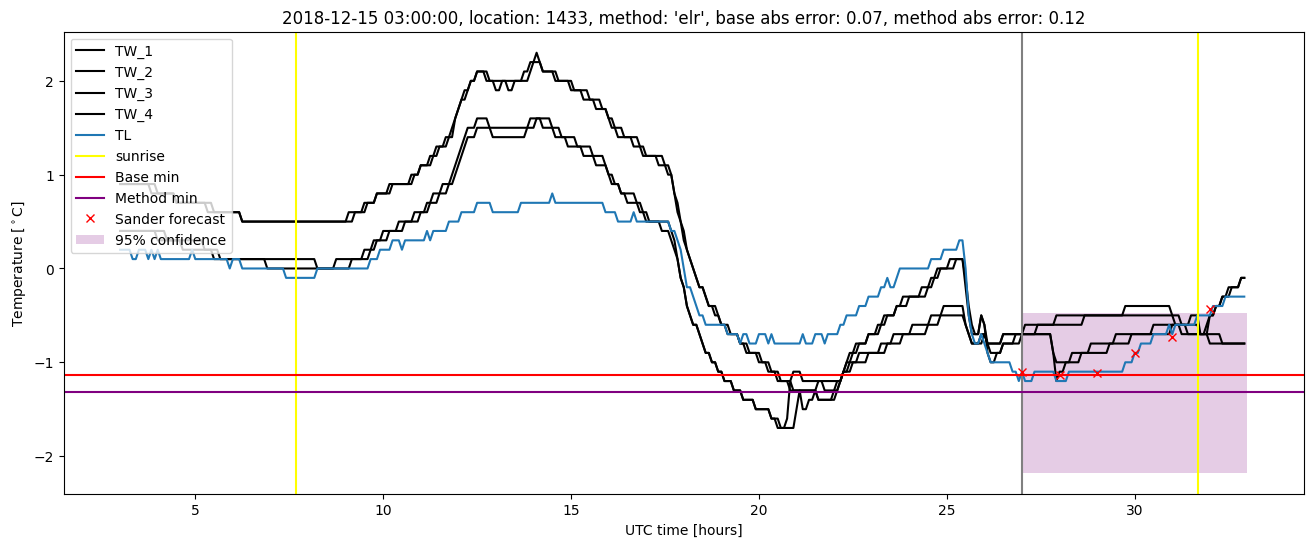
winter 2018 |
0.985 |
0.057 |
0.340 |
0.419 |
2.023 |
NaN |
NaN |
| forest |
winter 2018 |
0.977 |
0.000e+00 |
0.299 |
0.380 |
2.147 |
0.495 |
4.754 |
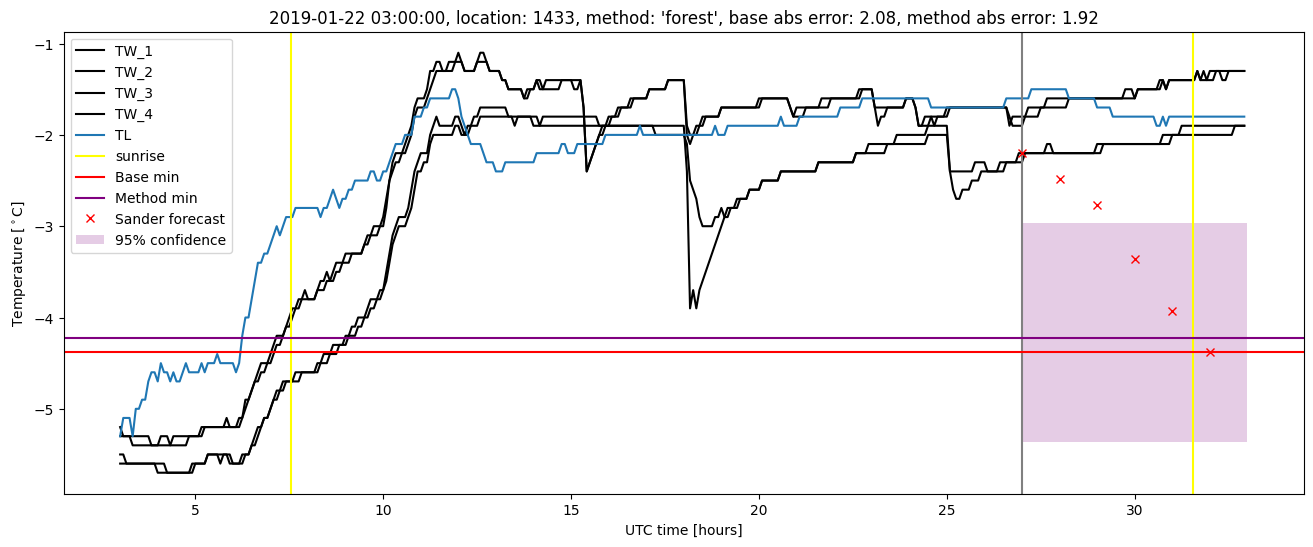
| baseline |
winter 2019 |
0.985 |
0.000e+00 |
0.335 |
0.419 |
2.082 |
NaN |
NaN |
| forest |
winter 2019 |
0.992 |
0.000e+00 |
0.264 |
0.382 |
1.922 |
0.476 |
3.587 |
| baseline |
all |
0.987 |
0.049 |
0.330 |
0.413 |
2.622 |
NaN |
NaN |
| forest |
all |
0.987 |
0.025 |
0.286 |
0.385 |
2.150 |
0.489 |
4.523 |
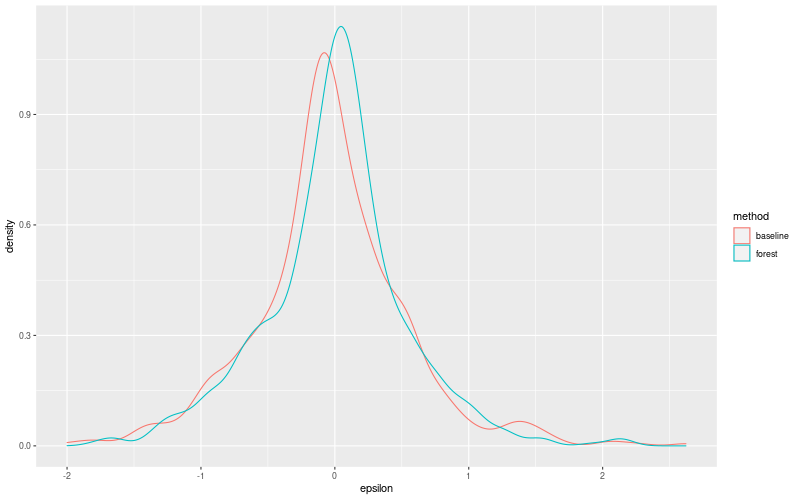
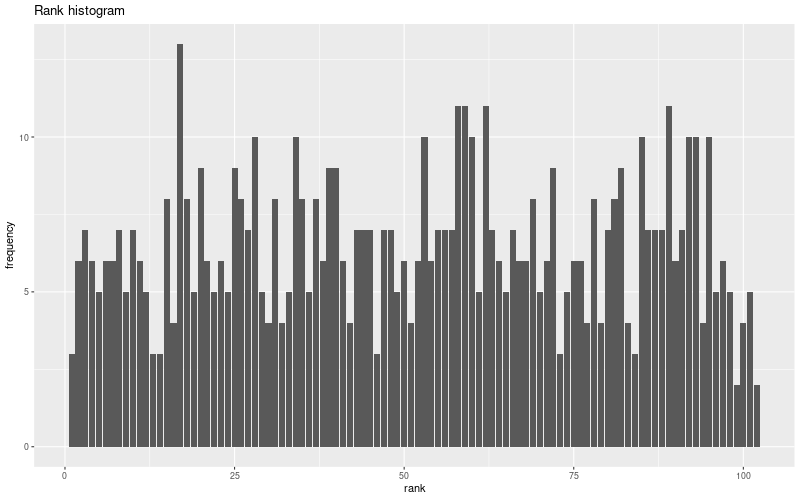
Random forest plots

Extended logistic regression results
| names |
period |
power |
significance |
meanSquareError |
absError |
maxError |
CRPS |
IGN |
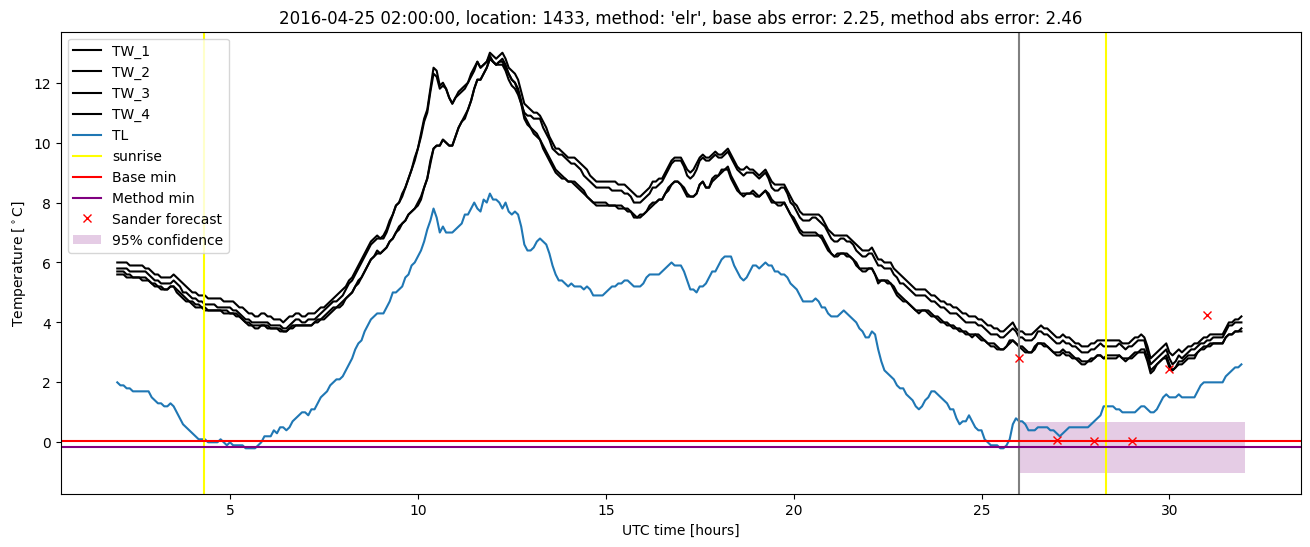
| baseline |
winter 2016 |
1.000 |
0.097 |
0.282 |
0.391 |
2.249 |
NaN |
NaN |
| elr |
winter 2016 |
0.983 |
0.097 |
0.293 |
0.406 |
2.463 |
0.565 |
5.230 |
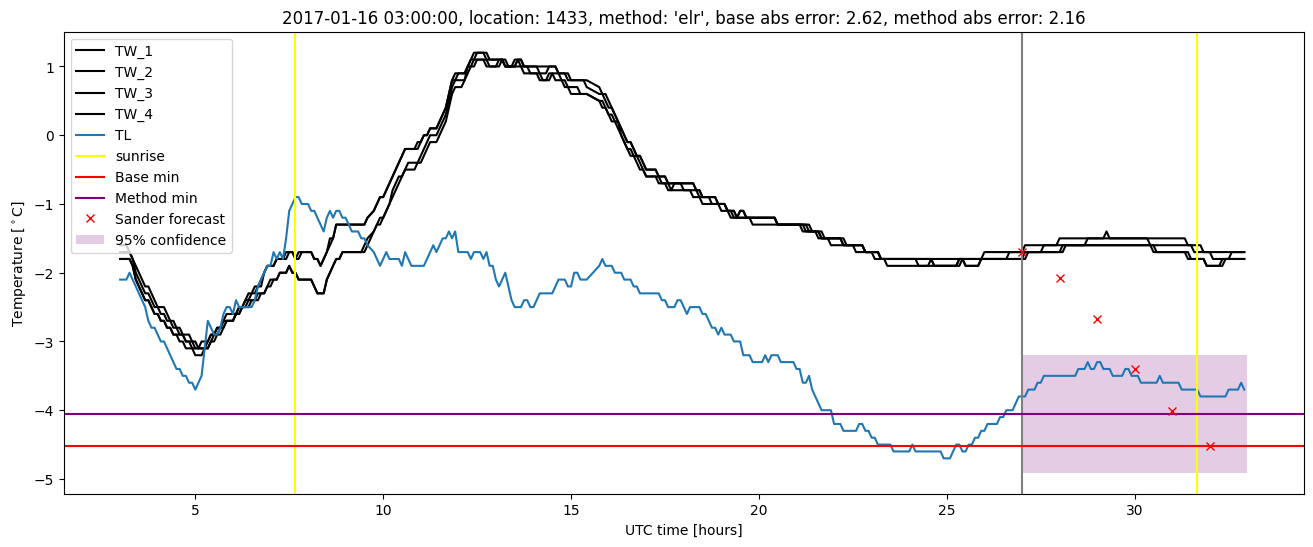
| baseline |
winter 2017 |
0.971 |
0.024 |
0.380 |
0.431 |
2.622 |
NaN |
NaN |
| elr |
winter 2017 |
0.971 |
0.024 |
0.316 |
0.409 |
2.156 |
0.563 |
5.051 |
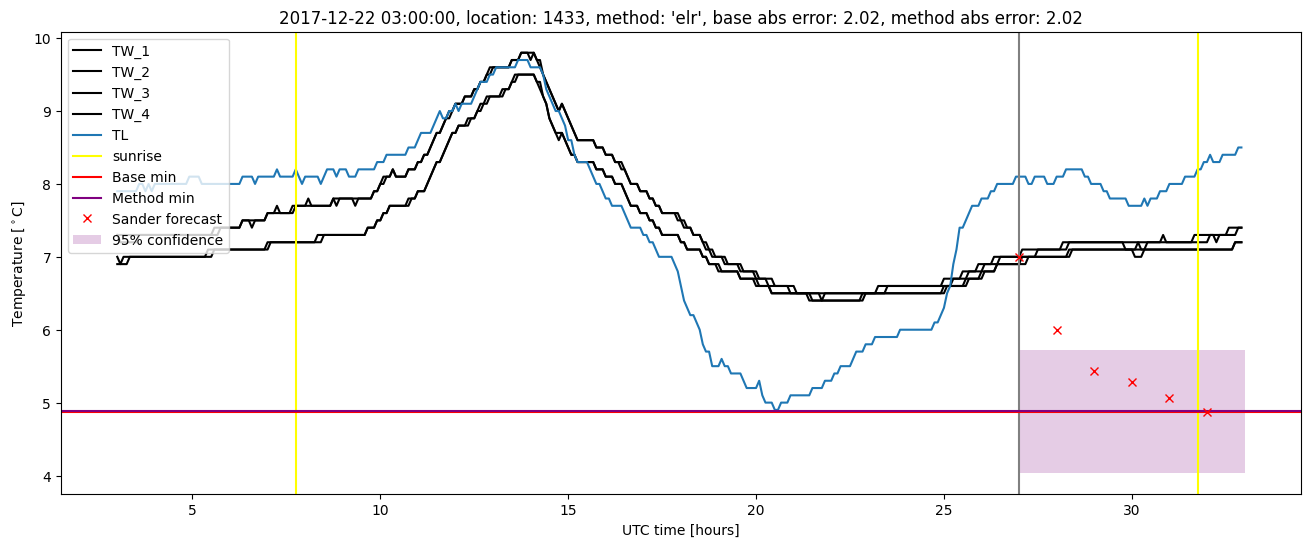
| baseline |
winter 2018 |
0.985 |
0.057 |
0.340 |
0.419 |
2.023 |
NaN |
NaN |
| elr |
winter 2018 |
0.977 |
0.000e+00 |
0.313 |
0.408 |
2.020 |
0.554 |
5.200 |
| baseline |
winter 2019 |
0.985 |
0.000e+00 |
0.335 |
0.419 |
2.082 |
NaN |
NaN |
| elr |
winter 2019 |
0.992 |
0.000e+00 |
0.304 |
0.429 |
1.929 |
0.519 |
4.314 |
| baseline |
all |
0.987 |
0.049 |
0.330 |
0.413 |
2.622 |
NaN |
NaN |
| elr |
all |
0.982 |
0.033 |
0.305 |
0.412 |
2.463 |
0.552 |
4.985 |
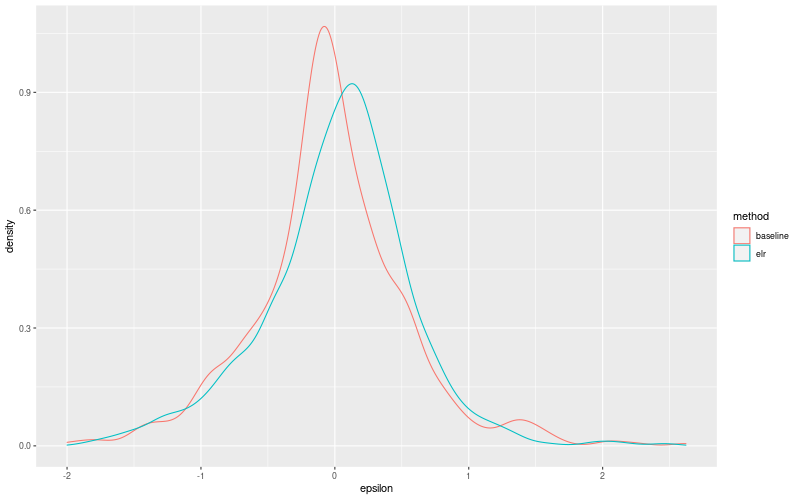
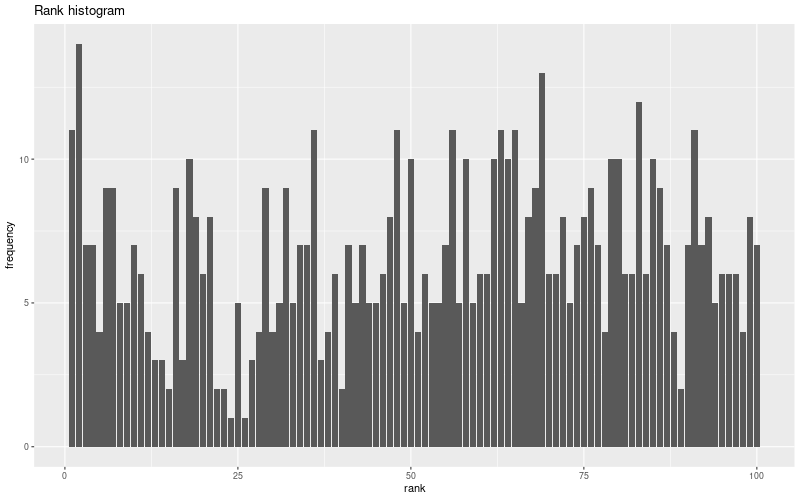
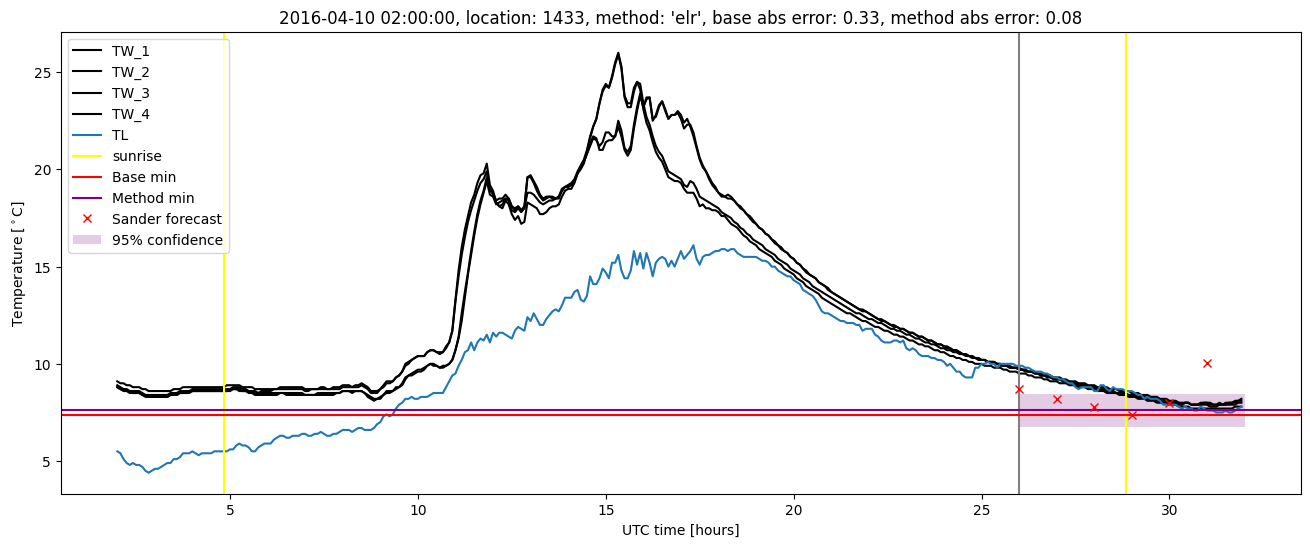
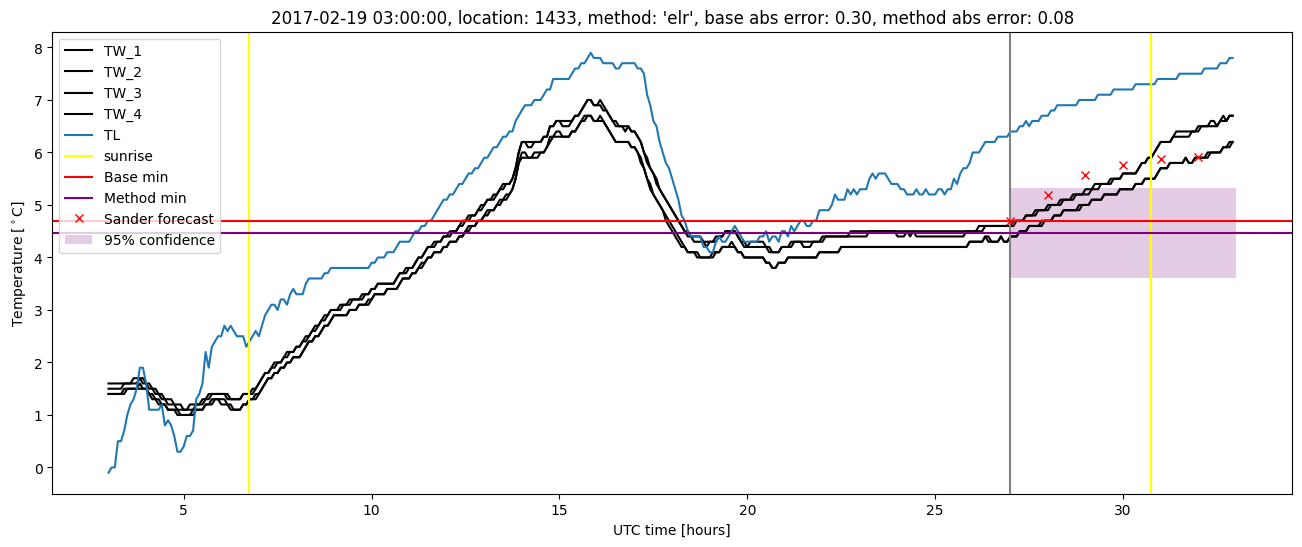
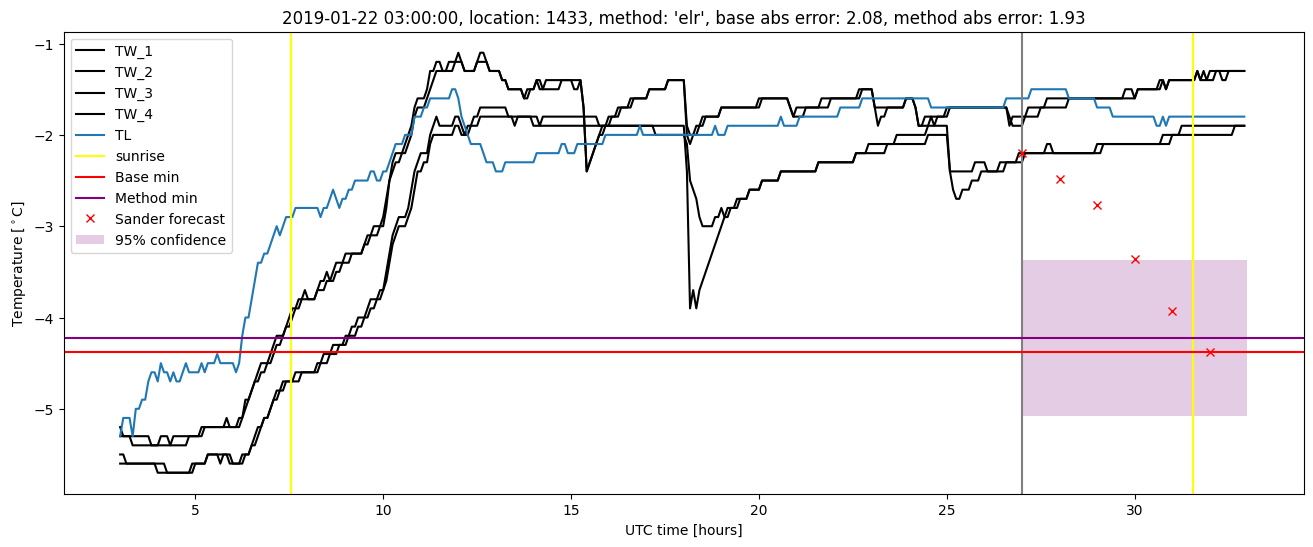
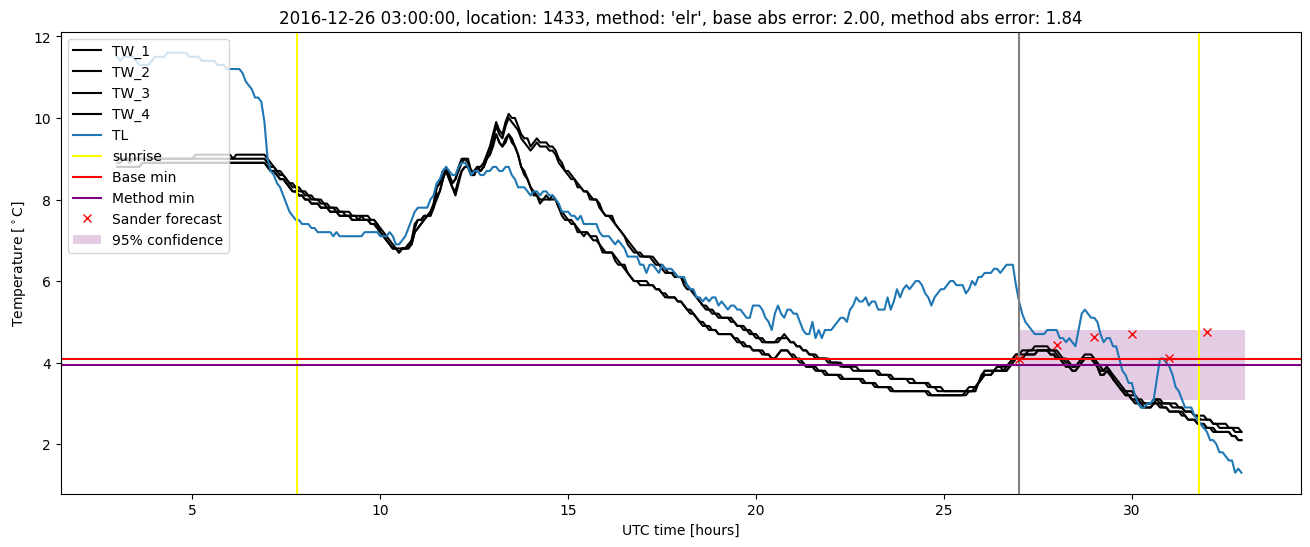
Extended logistic regression plots