GMS location: 1432
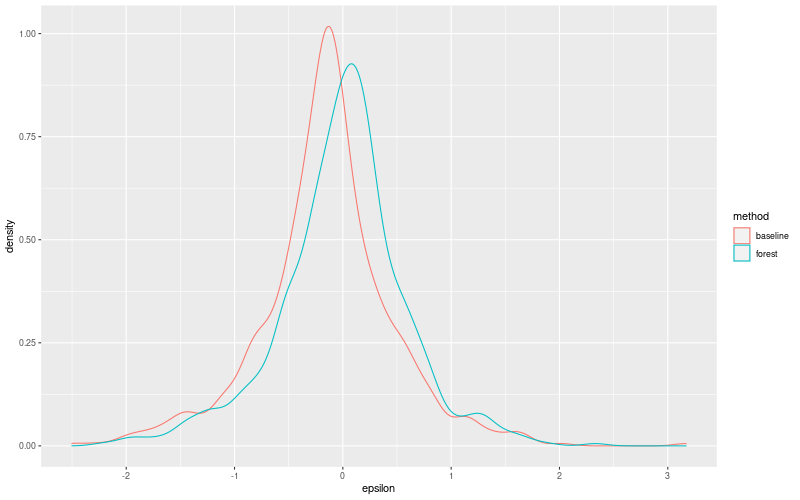
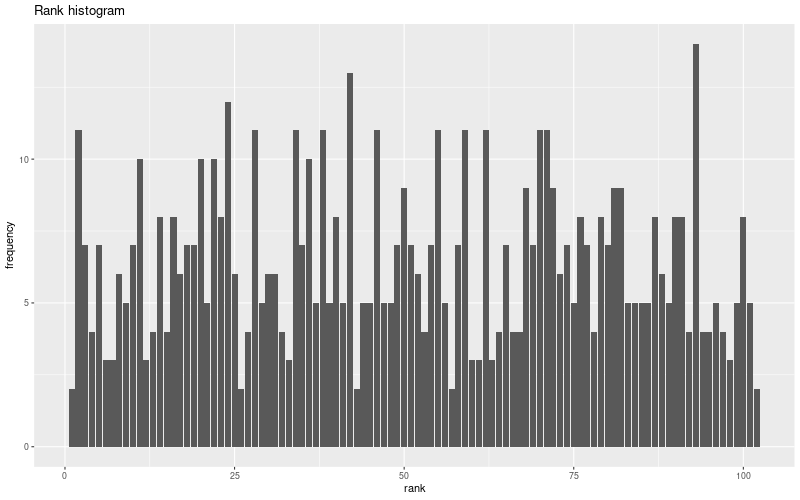
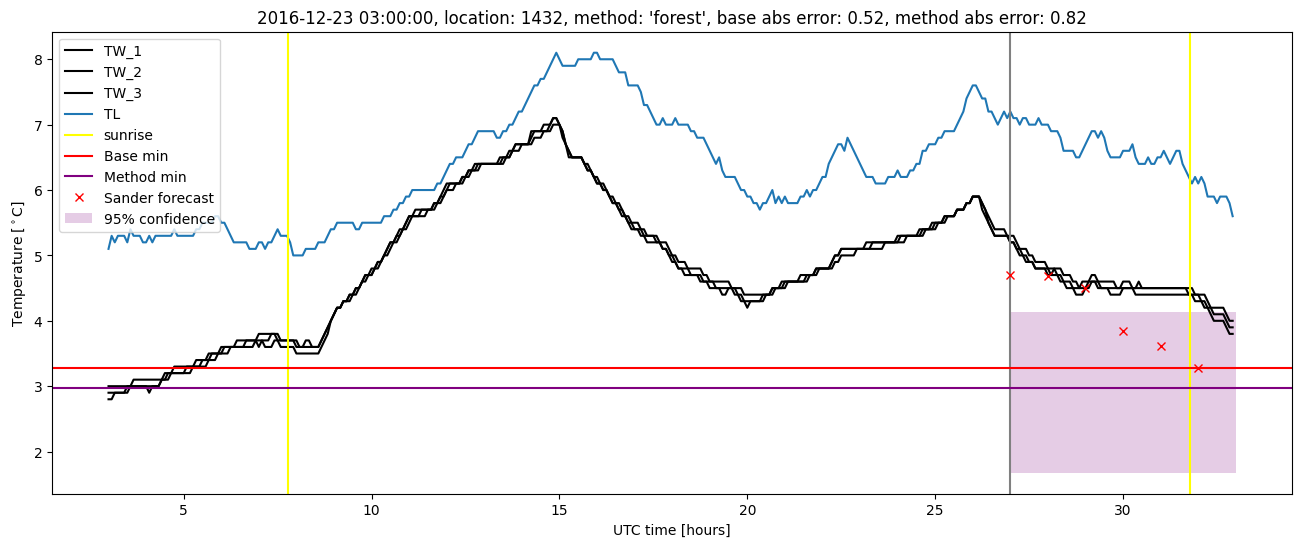
Random forest results
| names |
period |
power |
significance |
meanSquareError |
absError |
maxError |
CRPS |
IGN |
| baseline |
winter 2016 |
1.000 |
0.100 |
0.430 |
0.475 |
2.502 |
NaN |
NaN |
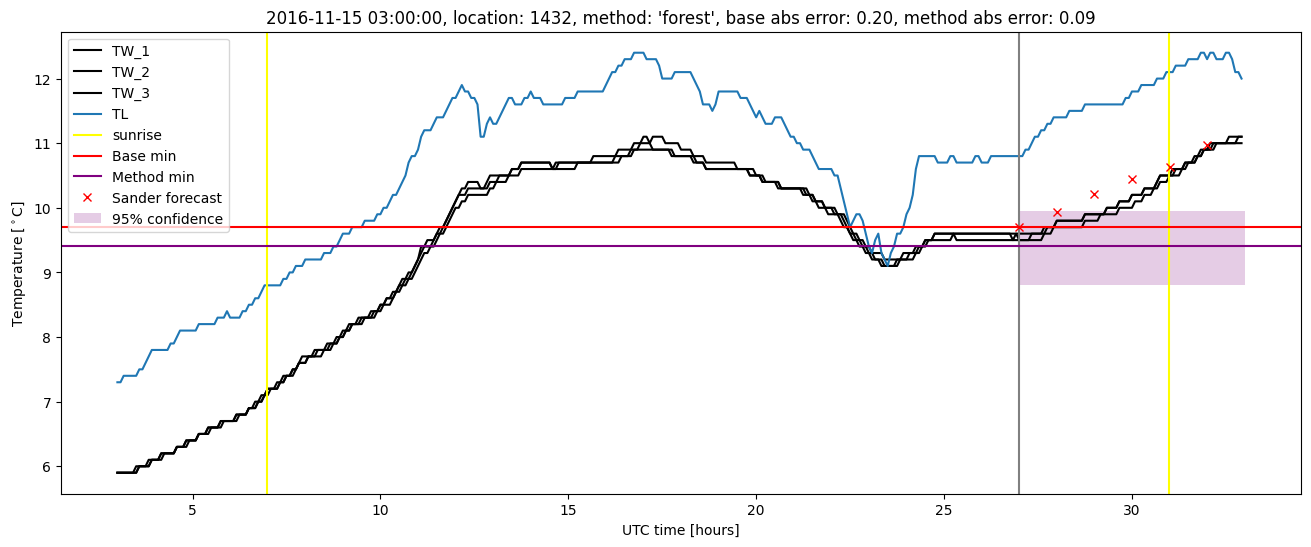
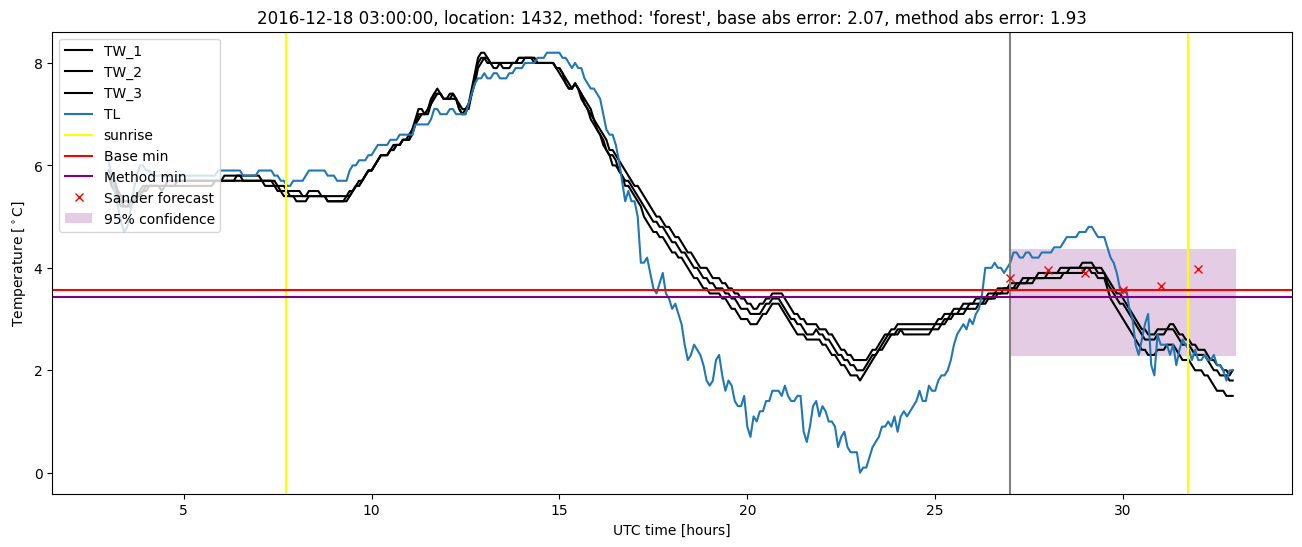
| forest |
winter 2016 |
0.994 |
0.100 |
0.352 |
0.421 |
2.215 |
0.544 |
3.311 |
| baseline |
winter 2017 |
0.991 |
0.049 |
0.486 |
0.493 |
3.169 |
NaN |
NaN |
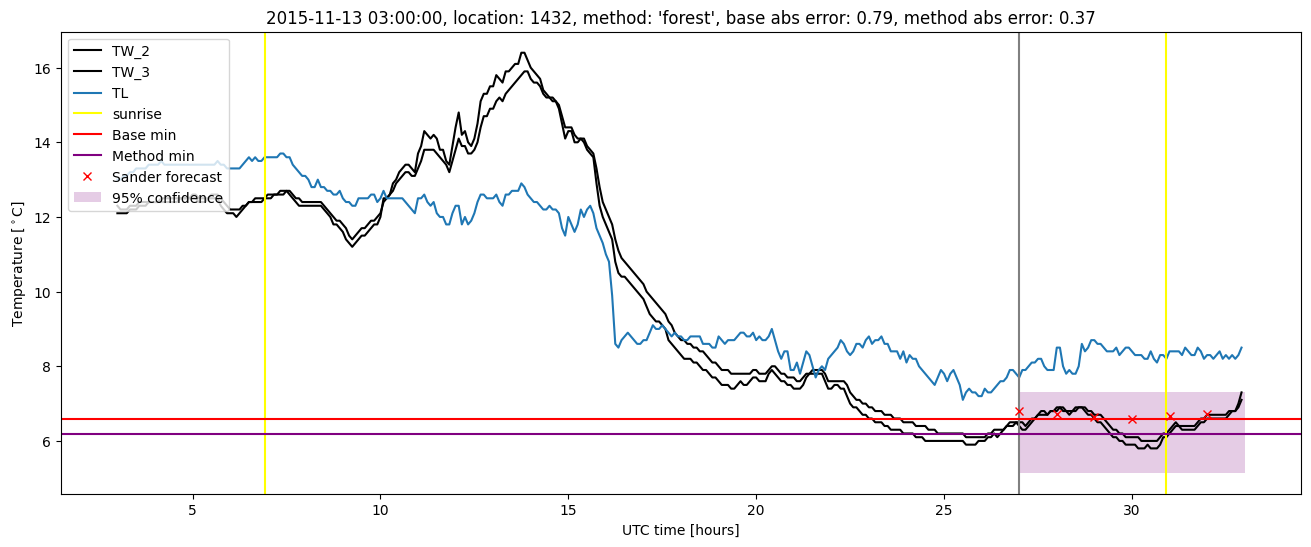
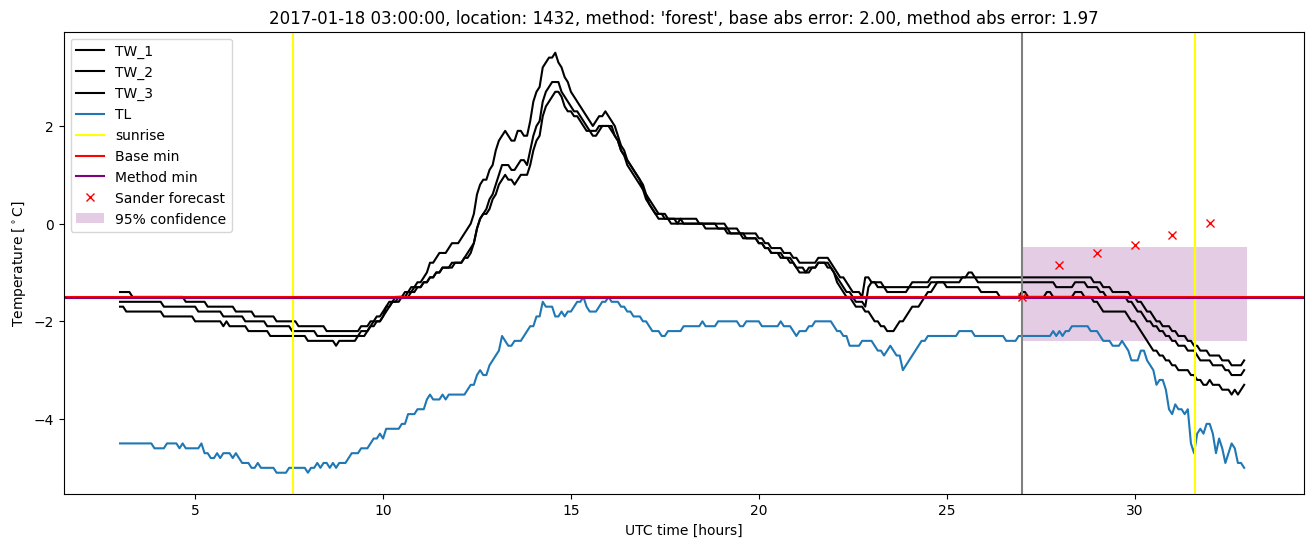
| forest |
winter 2017 |
0.982 |
0.024 |
0.416 |
0.454 |
2.330 |
0.542 |
3.612 |
| baseline |
winter 2018 |
0.947 |
0.094 |
0.439 |
0.482 |
2.274 |
NaN |
NaN |
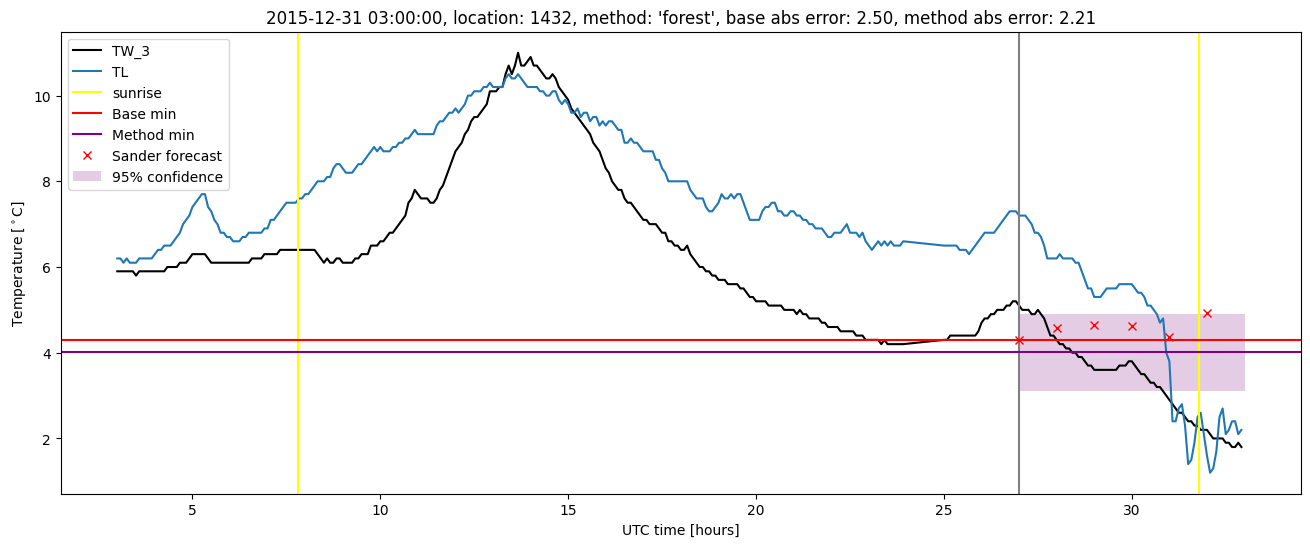
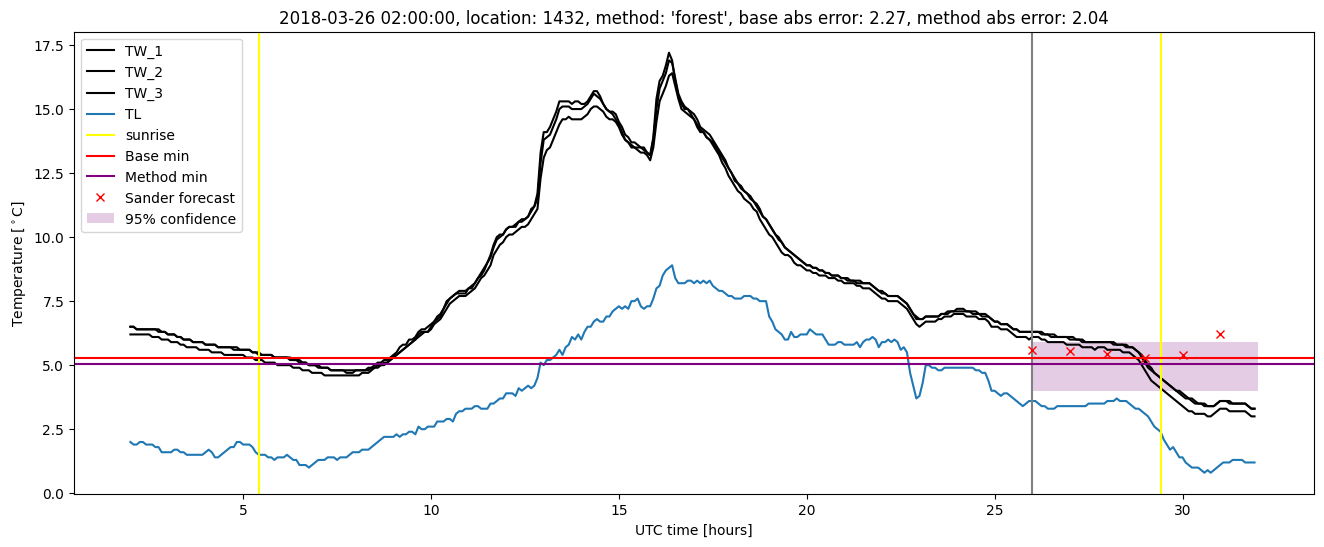
| forest |
winter 2018 |
0.939 |
0.031 |
0.380 |
0.467 |
2.044 |
0.559 |
3.526 |
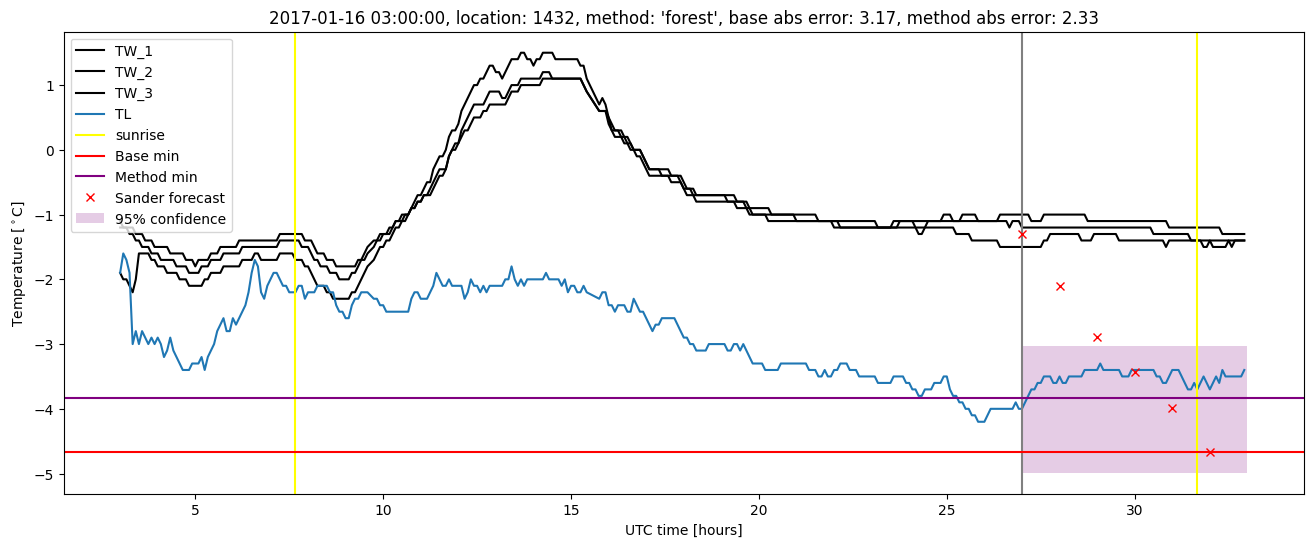
| baseline |
winter 2019 |
0.993 |
0.000e+00 |
0.305 |
0.409 |
1.717 |
NaN |
NaN |
| forest |
winter 2019 |
0.993 |
0.000e+00 |
0.270 |
0.394 |
1.488 |
0.562 |
3.353 |
| baseline |
all |
0.985 |
0.070 |
0.415 |
0.465 |
3.169 |
NaN |
NaN |
| forest |
all |
0.980 |
0.043 |
0.353 |
0.432 |
2.330 |
0.551 |
3.438 |
Random forest plots
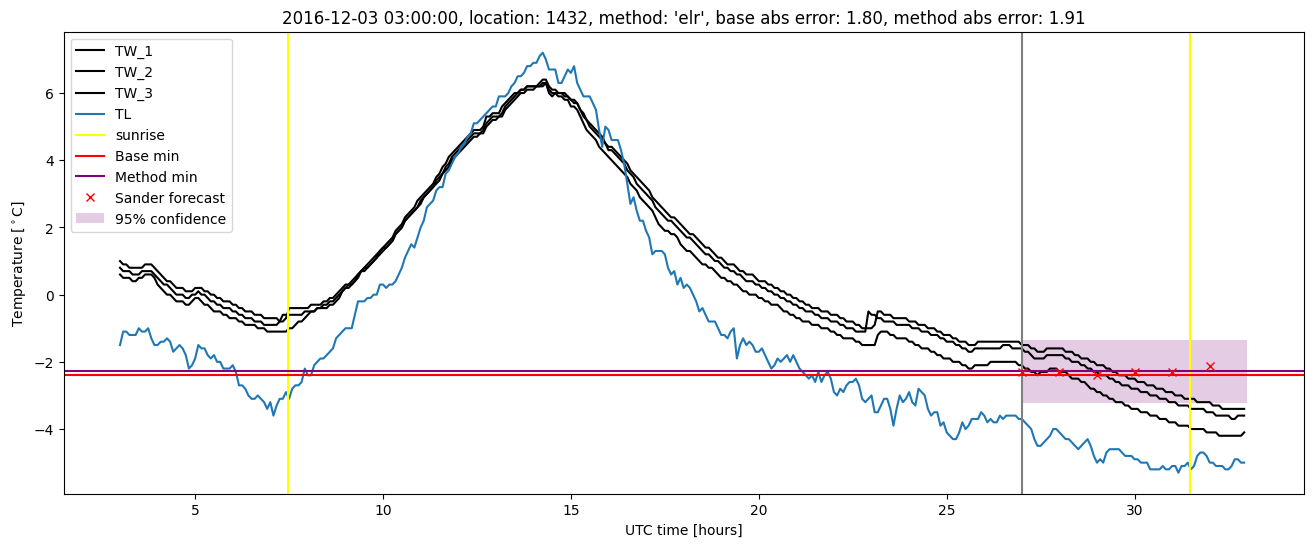
Extended logistic regression results
| names |
period |
power |
significance |
meanSquareError |
absError |
maxError |
CRPS |
IGN |
| baseline |
winter 2016 |
1.000 |
0.100 |
0.430 |
0.475 |
2.502 |
NaN |
NaN |
| elr |
winter 2016 |
1.000 |
0.167 |
0.375 |
0.469 |
2.084 |
0.625 |
3.813 |
| baseline |
winter 2017 |
0.991 |
0.049 |
0.486 |
0.493 |
3.169 |
NaN |
NaN |
| elr |
winter 2017 |
0.991 |
0.000e+00 |
0.449 |
0.482 |
2.437 |
0.564 |
3.677 |
| baseline |
winter 2018 |
0.947 |
0.094 |
0.439 |
0.482 |
2.274 |
NaN |
NaN |
| elr |
winter 2018 |
0.947 |
0.031 |
0.437 |
0.510 |
1.911 |
0.630 |
4.391 |
| baseline |
winter 2019 |
0.993 |
0.000e+00 |
0.305 |
0.409 |
1.717 |
NaN |
NaN |
| elr |
winter 2019 |
0.993 |
0.000e+00 |
0.267 |
0.415 |
1.458 |
0.618 |
3.628 |
| baseline |
all |
0.985 |
0.070 |
0.415 |
0.465 |
3.169 |
NaN |
NaN |
| elr |
all |
0.985 |
0.052 |
0.380 |
0.468 |
2.437 |
0.610 |
3.866 |
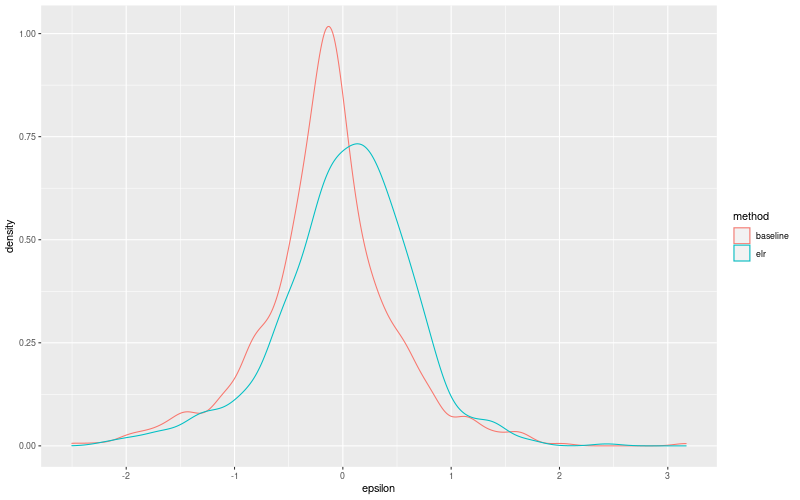
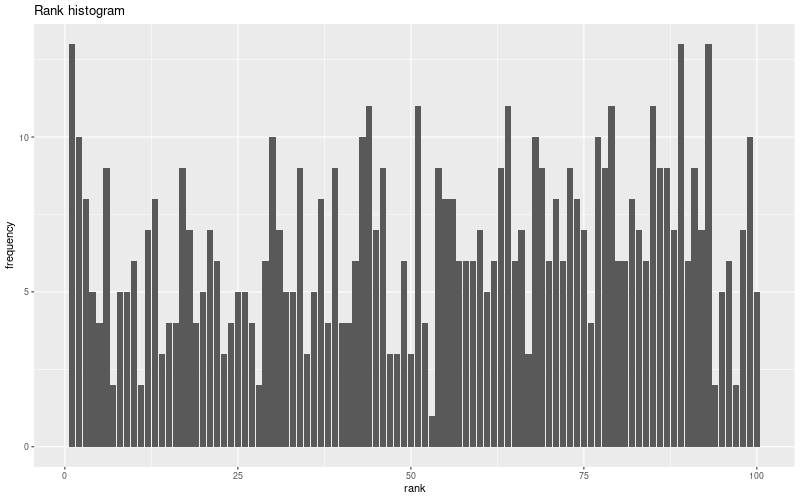
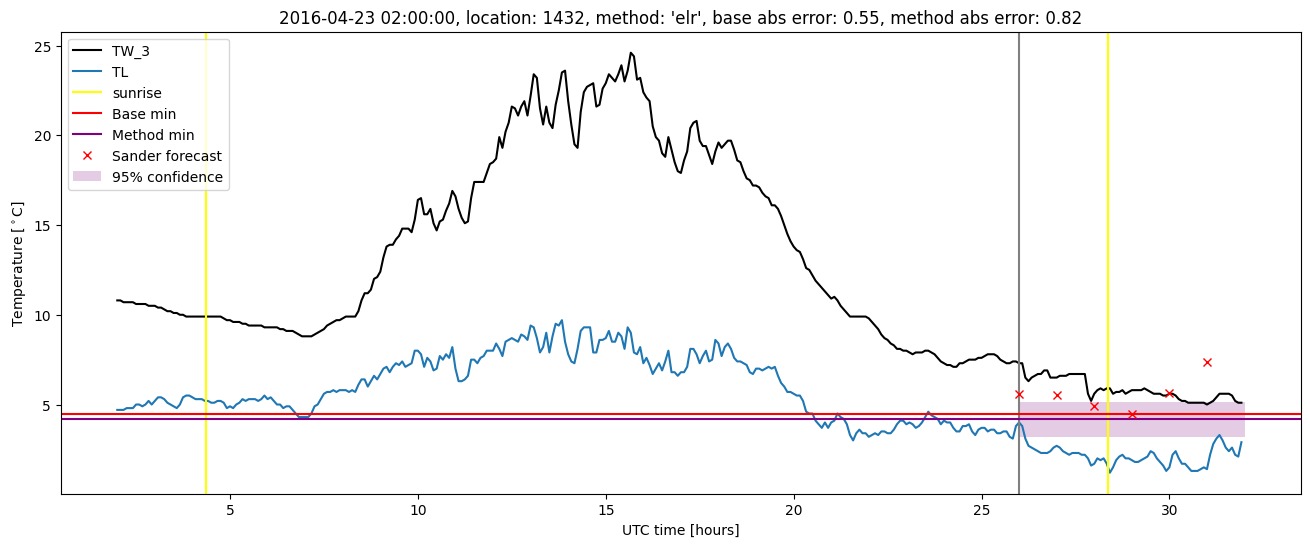
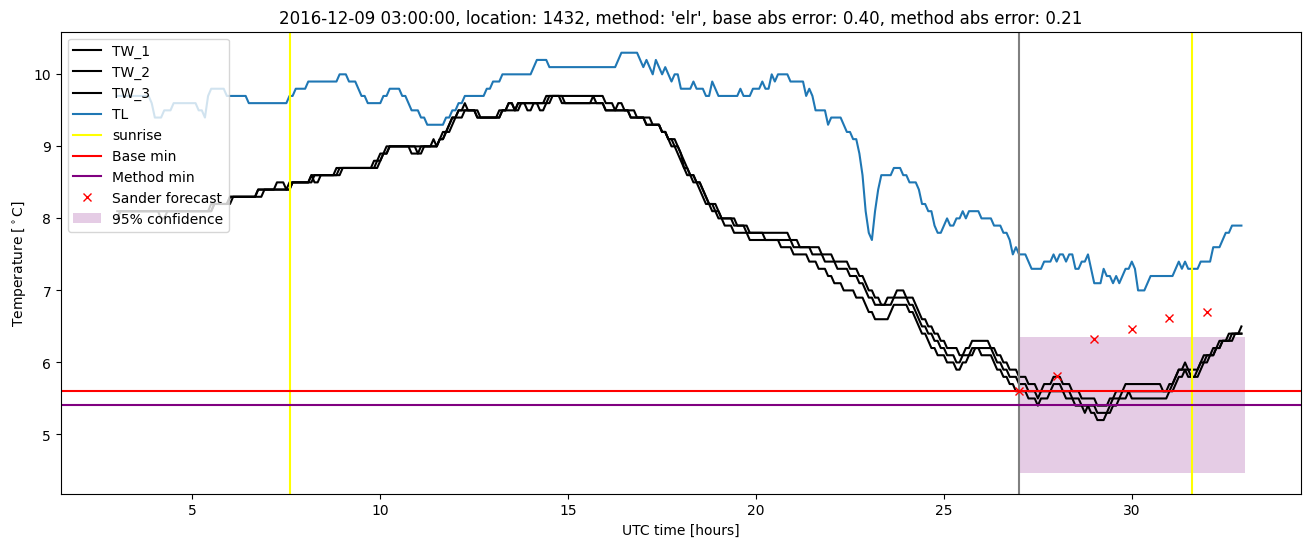
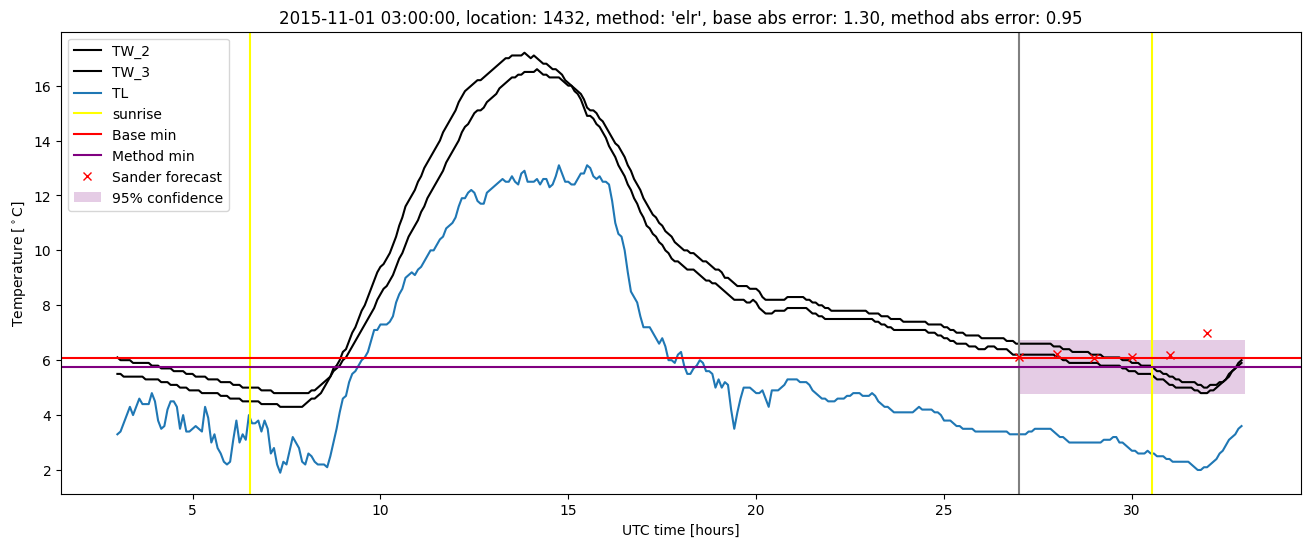
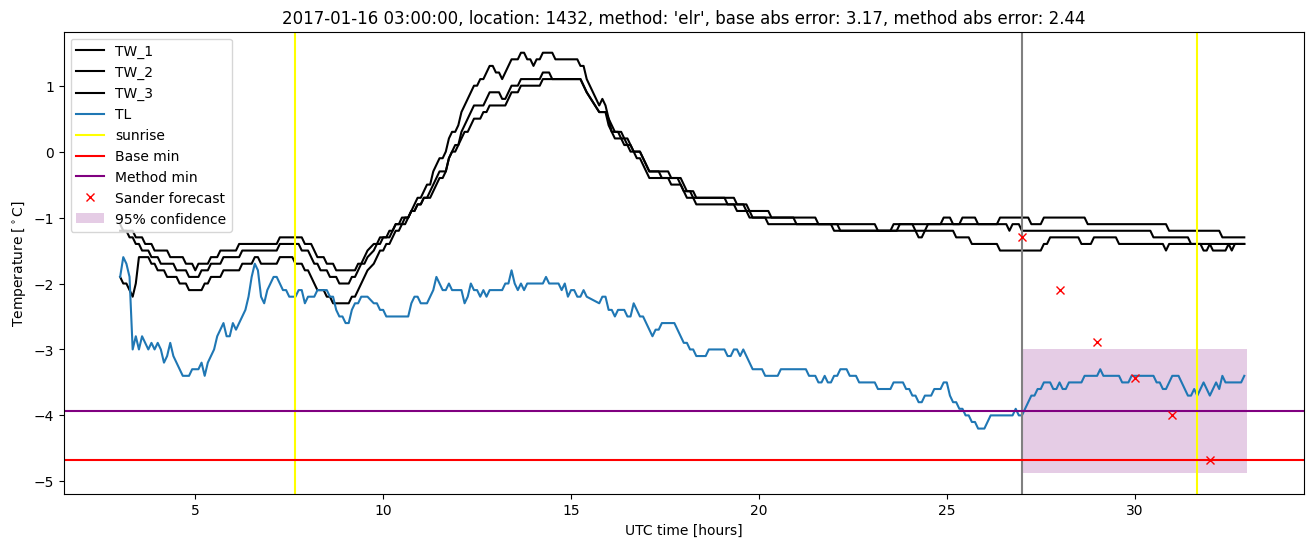
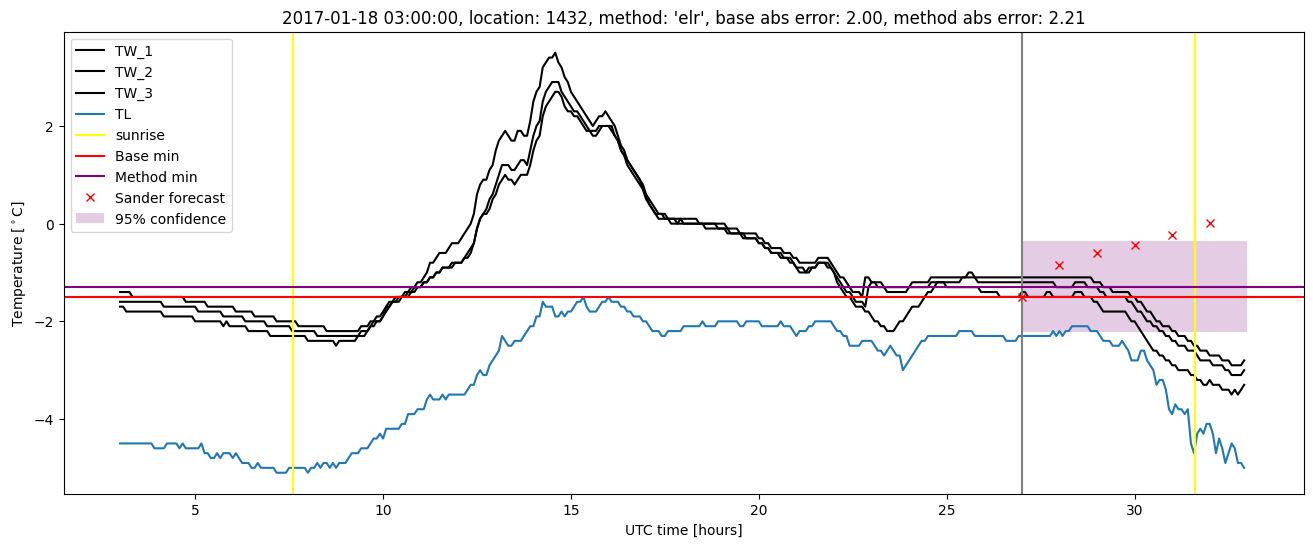
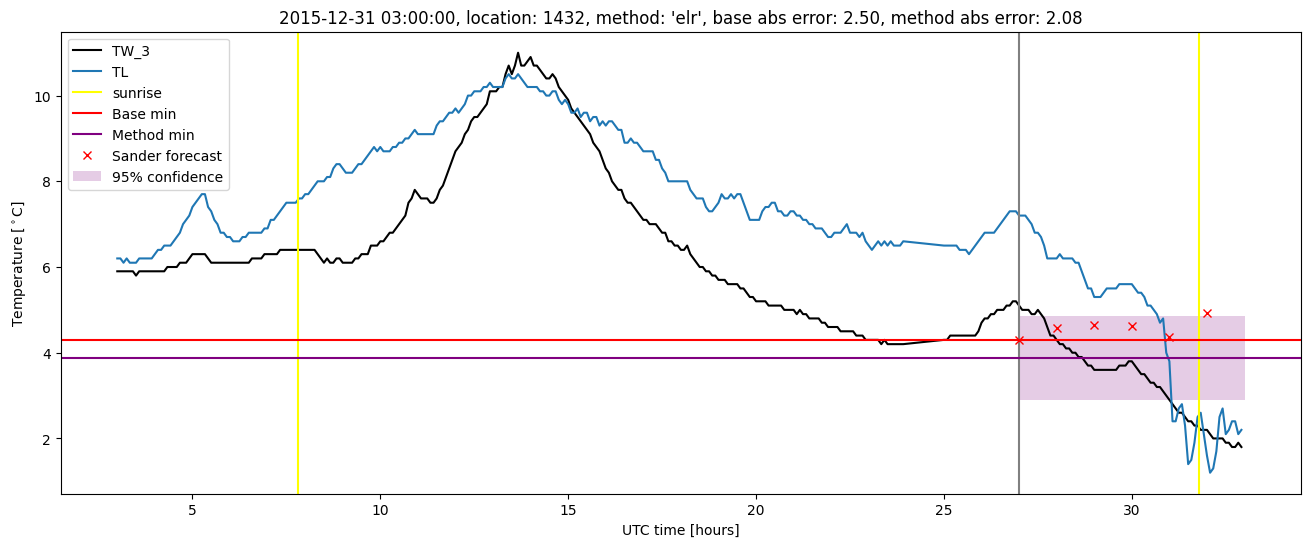
Extended logistic regression plots