GMS location: 1431
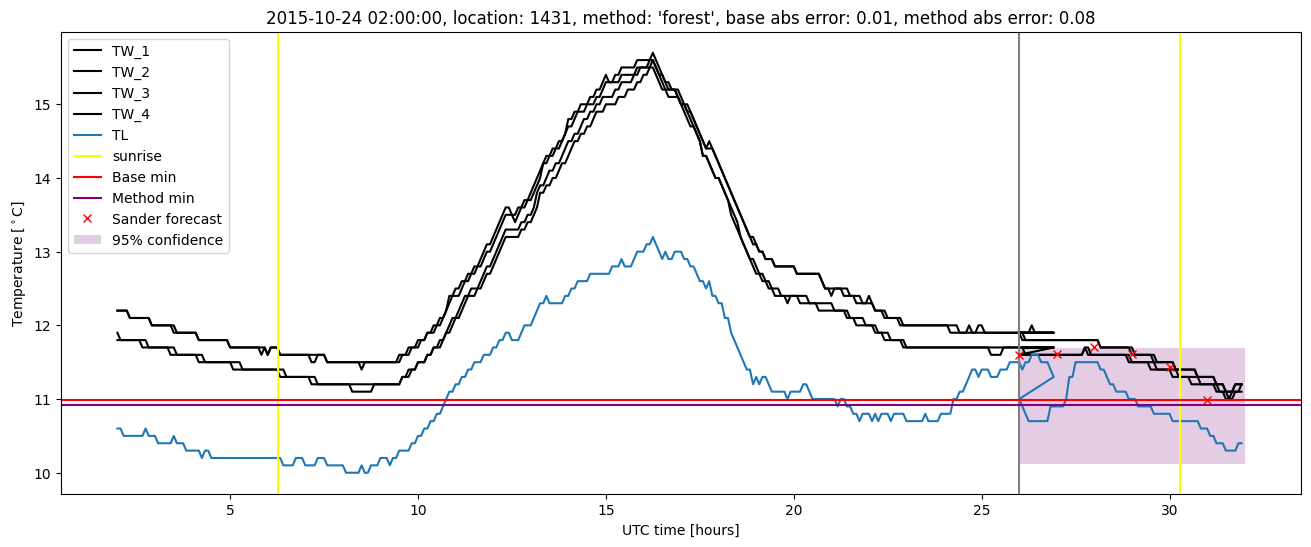
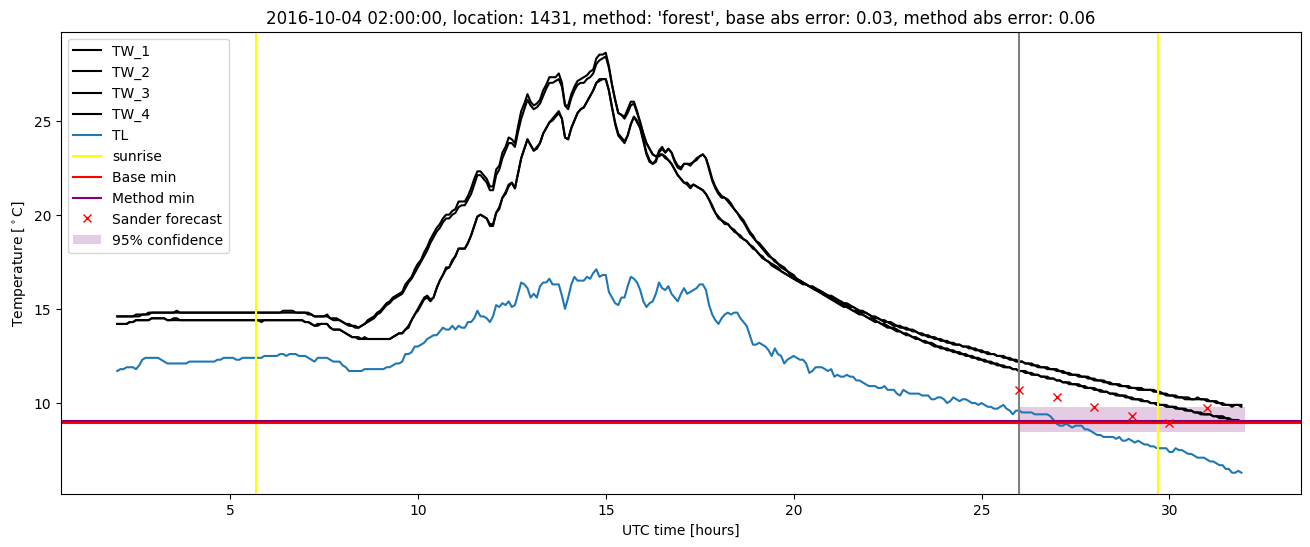
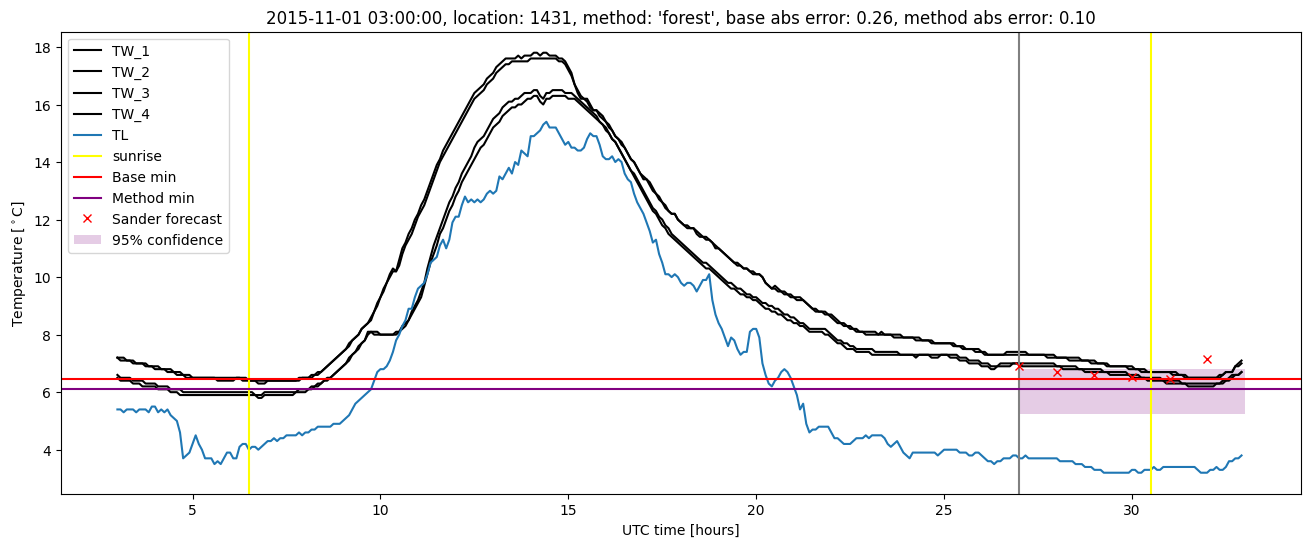
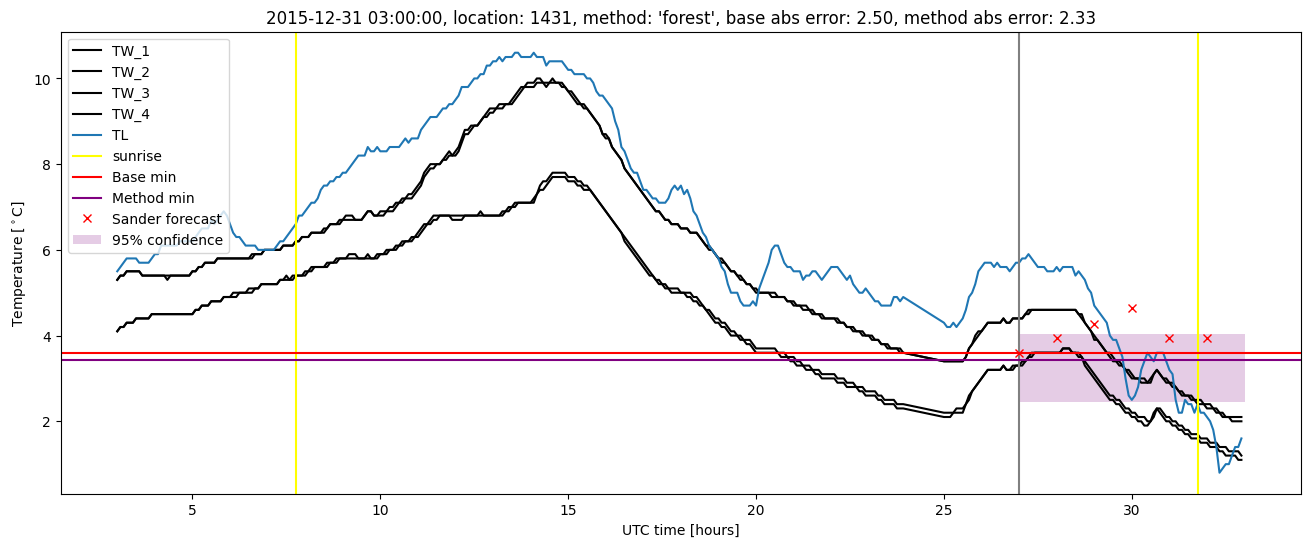
Random forest results
| names |
period |
power |
significance |
meanSquareError |
absError |
maxError |
CRPS |
IGN |
| baseline |
winter 2016 |
0.988 |
0.080 |
0.324 |
0.415 |
2.500 |
NaN |
NaN |
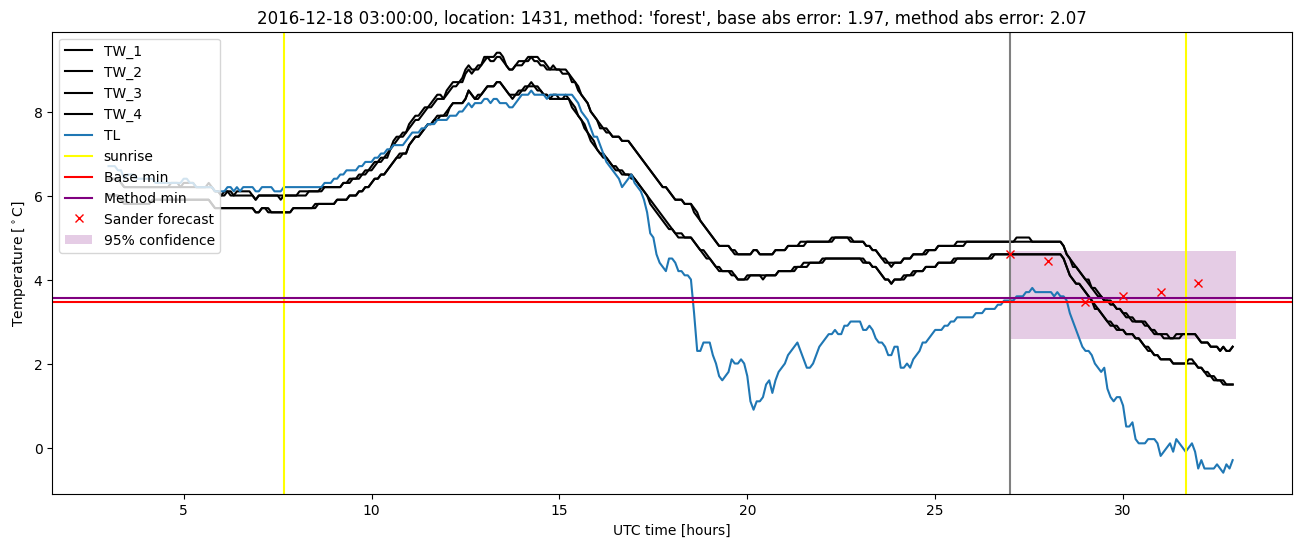
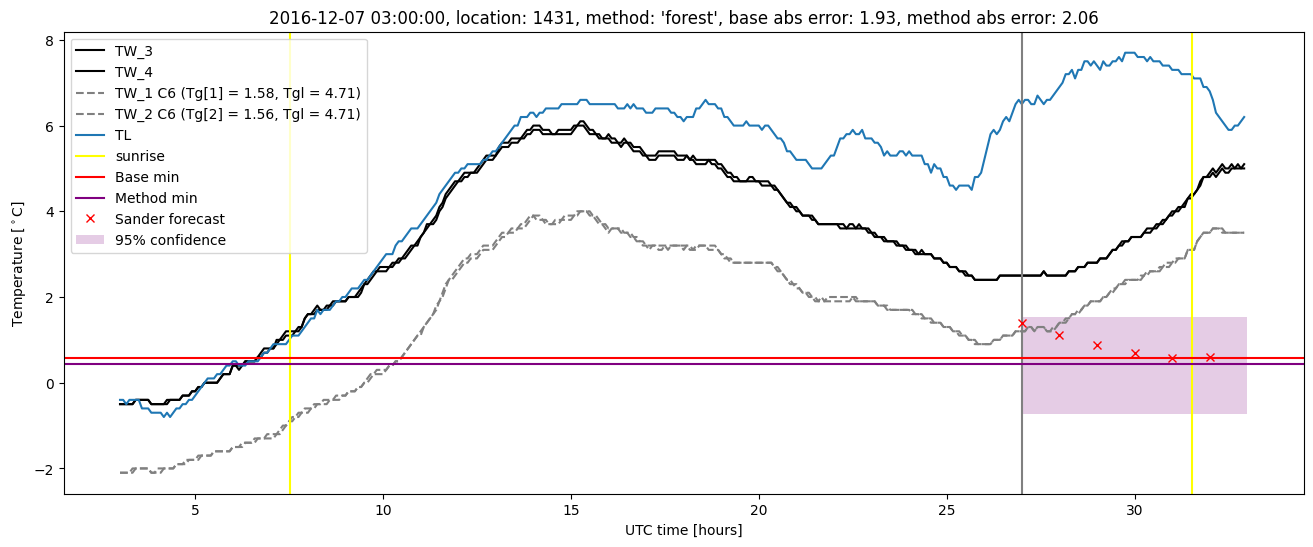
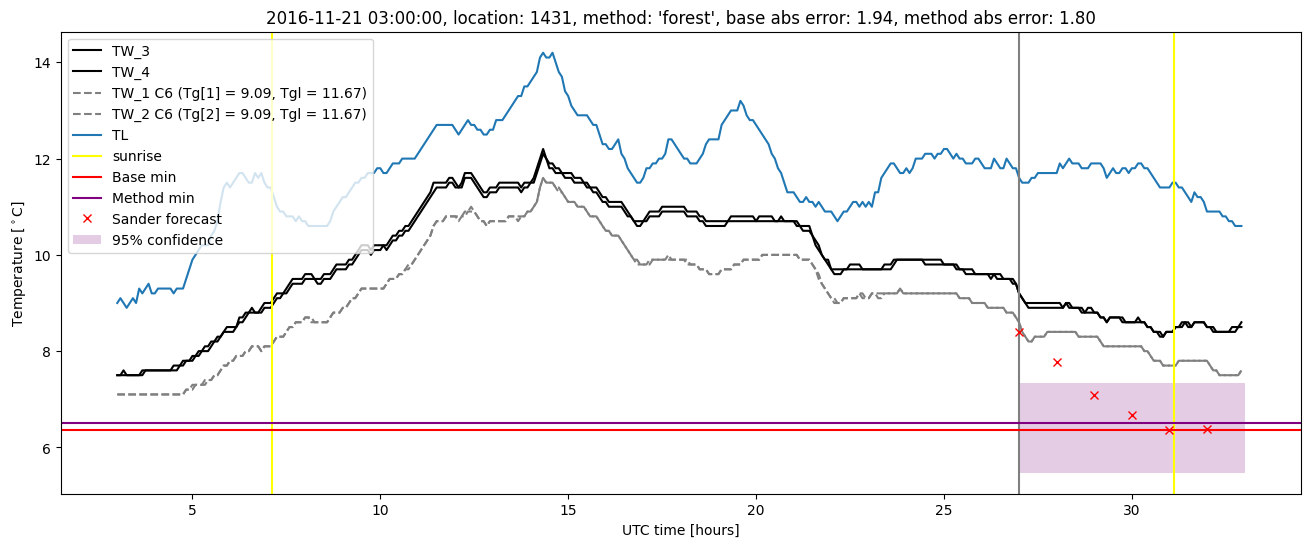
| forest |
winter 2016 |
0.976 |
0.040 |
0.301 |
0.397 |
2.330 |
0.506 |
4.315 |
| baseline |
winter 2017 |
1.000 |
0.000e+00 |
0.519 |
0.511 |
2.497 |
NaN |
NaN |
| forest |
winter 2017 |
0.991 |
0.026 |
0.438 |
0.480 |
2.067 |
0.483 |
3.487 |
| baseline |
winter 2018 |
0.992 |
0.135 |
0.274 |
0.370 |
1.719 |
NaN |
NaN |
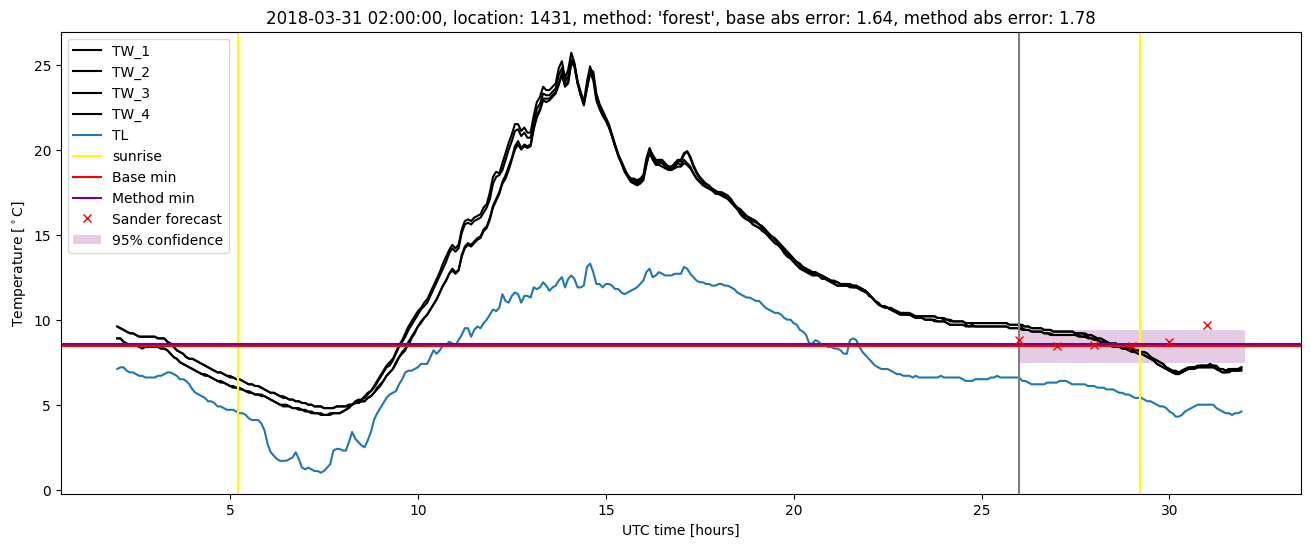
| forest |
winter 2018 |
0.984 |
0.135 |
0.240 |
0.364 |
1.783 |
0.483 |
2.914 |
| baseline |
winter 2019 |
0.992 |
0.000e+00 |
0.295 |
0.377 |
2.178 |
NaN |
NaN |
| forest |
winter 2019 |
0.992 |
0.067 |
0.242 |
0.357 |
1.577 |
0.500 |
3.208 |
| baseline |
all |
0.992 |
0.061 |
0.350 |
0.418 |
2.500 |
NaN |
NaN |
| forest |
all |
0.985 |
0.070 |
0.305 |
0.399 |
2.330 |
0.493 |
3.534 |
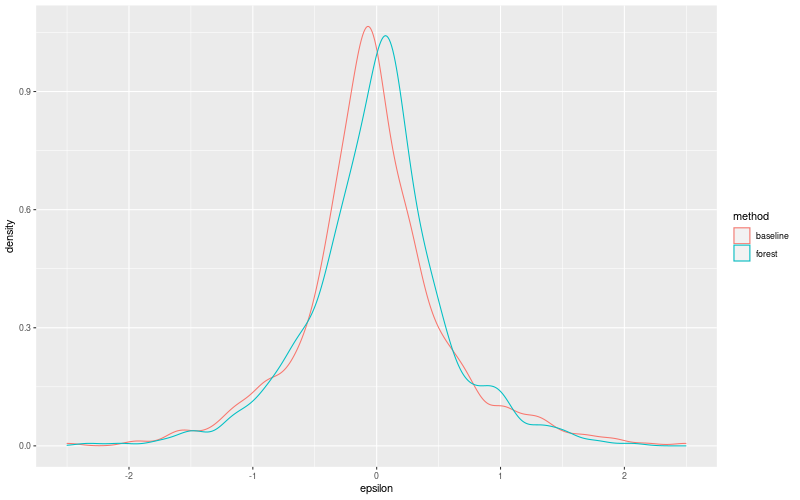
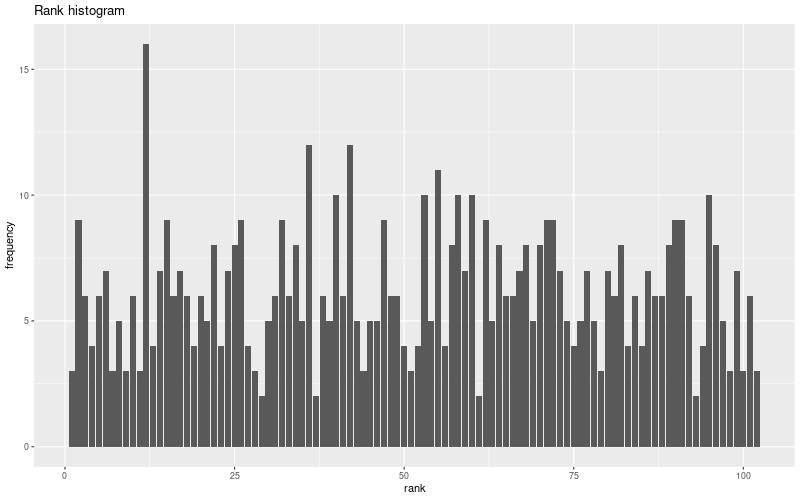
Random forest plots
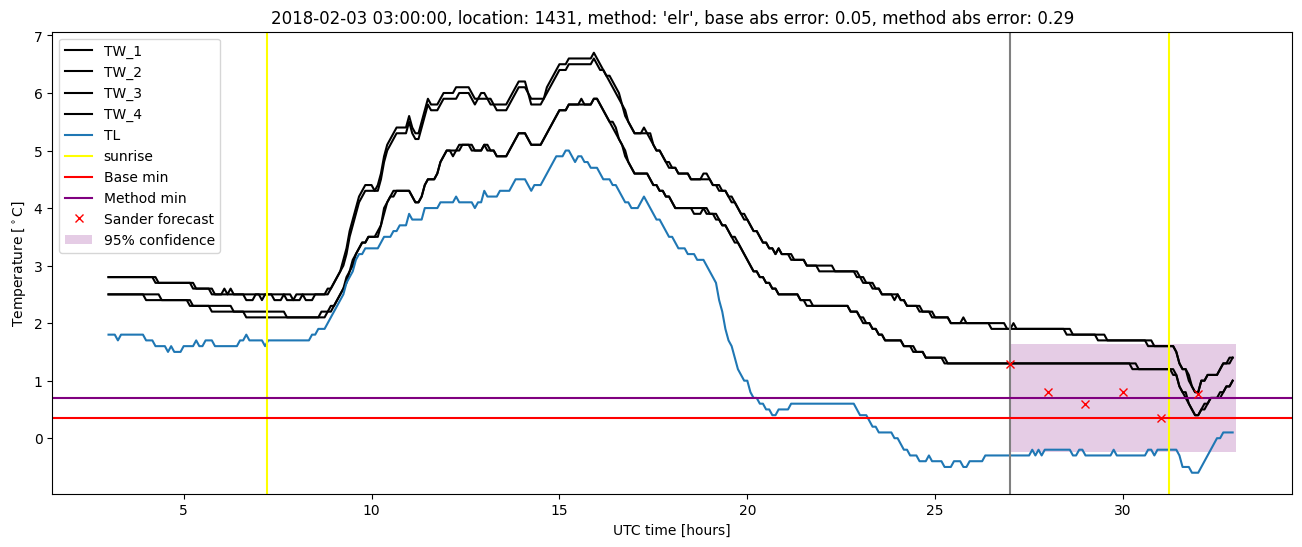
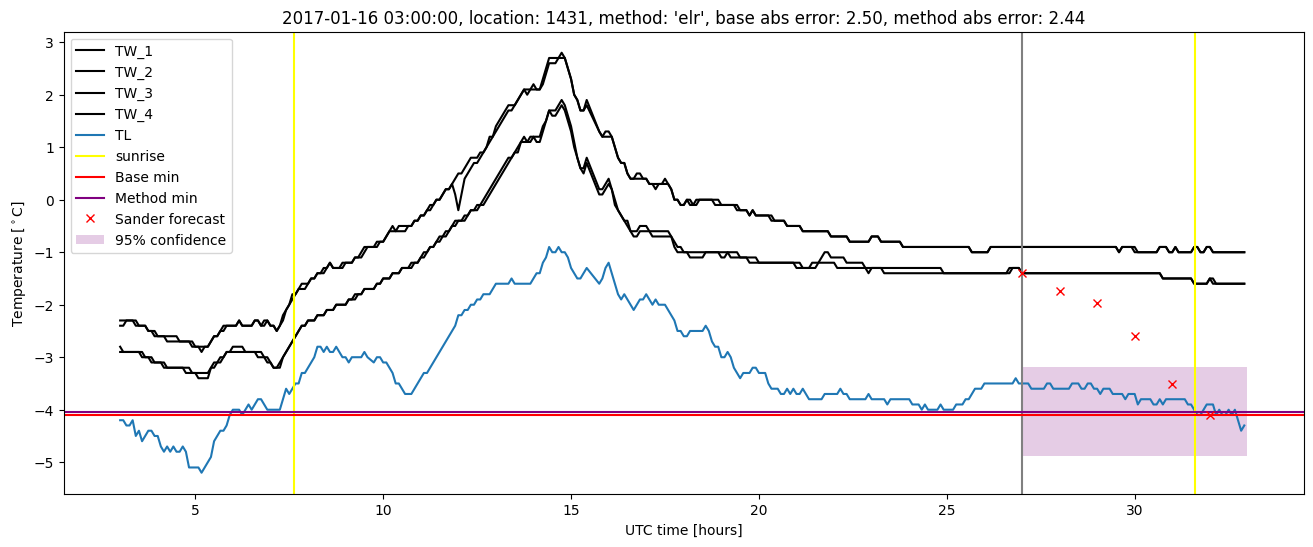
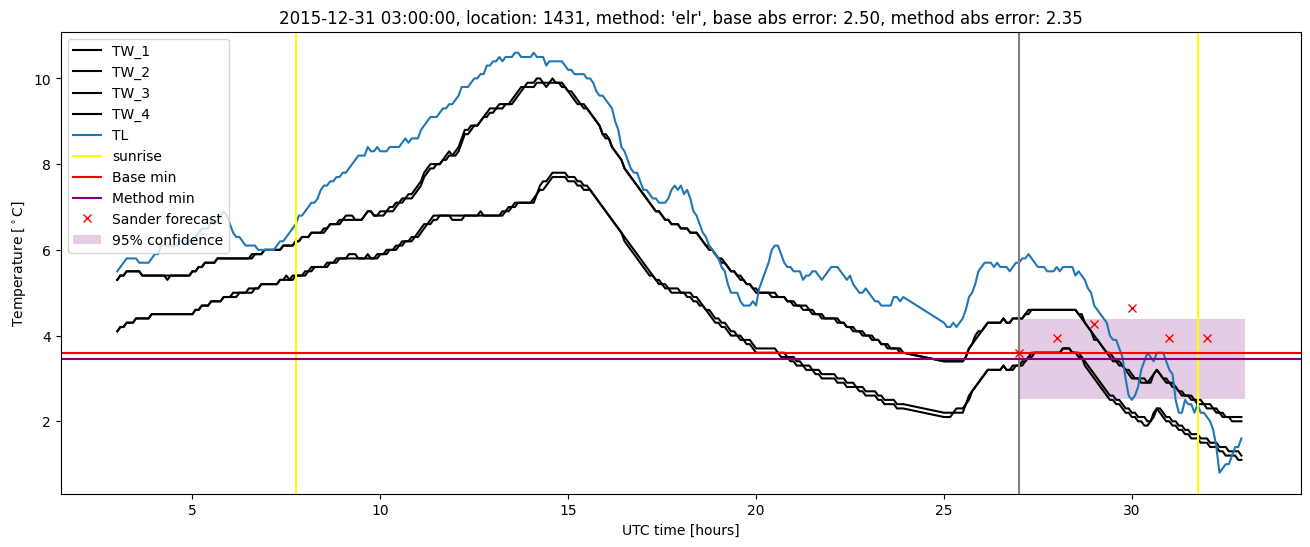
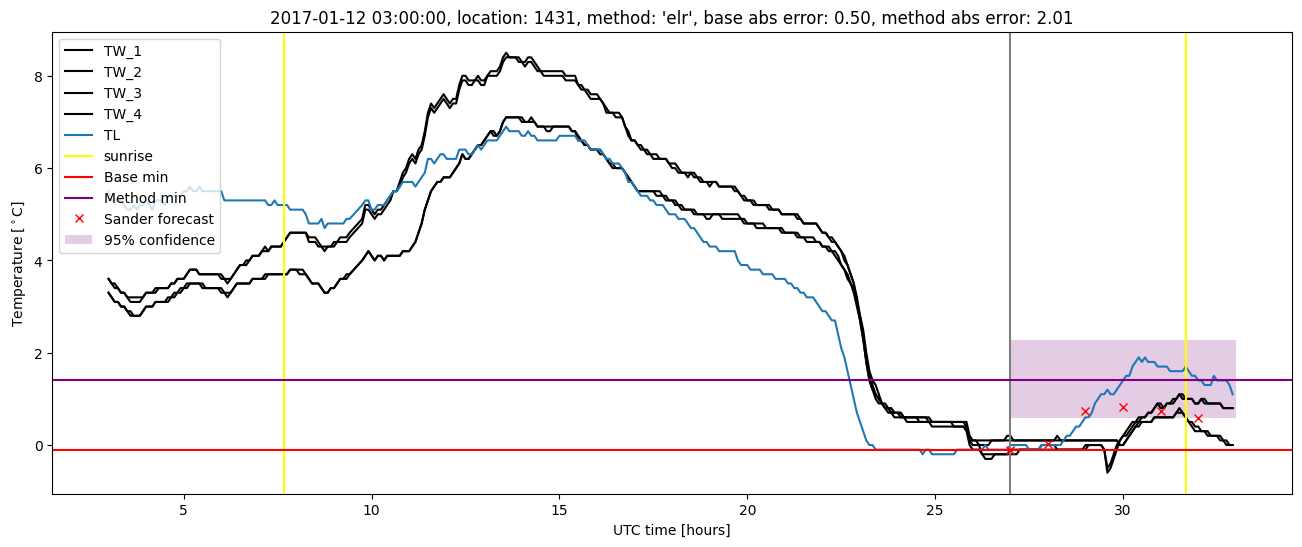
Extended logistic regression results
| names |
period |
power |
significance |
meanSquareError |
absError |
maxError |
CRPS |
IGN |
| baseline |
winter 2016 |
0.988 |
0.080 |
0.324 |
0.415 |
2.500 |
NaN |
NaN |
| elr |
winter 2016 |
0.976 |
0.040 |
0.321 |
0.421 |
2.354 |
0.542 |
3.685 |
| baseline |
winter 2017 |
1.000 |
0.000e+00 |
0.519 |
0.511 |
2.497 |
NaN |
NaN |
| elr |
winter 2017 |
0.982 |
0.026 |
0.507 |
0.519 |
2.436 |
0.557 |
5.238 |
| baseline |
winter 2018 |
0.992 |
0.135 |
0.274 |
0.370 |
1.719 |
NaN |
NaN |
| elr |
winter 2018 |
0.968 |
0.135 |
0.267 |
0.374 |
1.673 |
0.530 |
3.315 |
| baseline |
winter 2019 |
0.992 |
0.000e+00 |
0.295 |
0.377 |
2.178 |
NaN |
NaN |
| elr |
winter 2019 |
0.992 |
0.067 |
0.283 |
0.409 |
1.654 |
0.511 |
3.338 |
| baseline |
all |
0.992 |
0.061 |
0.350 |
0.418 |
2.500 |
NaN |
NaN |
| elr |
all |
0.979 |
0.070 |
0.342 |
0.429 |
2.436 |
0.536 |
3.876 |
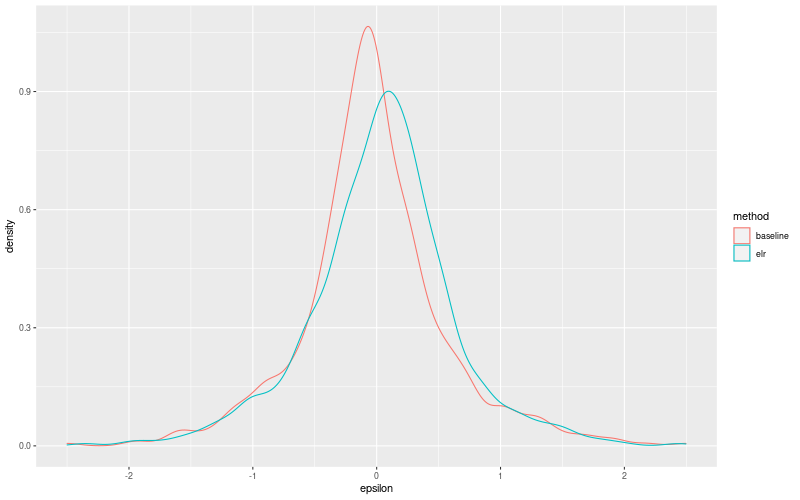
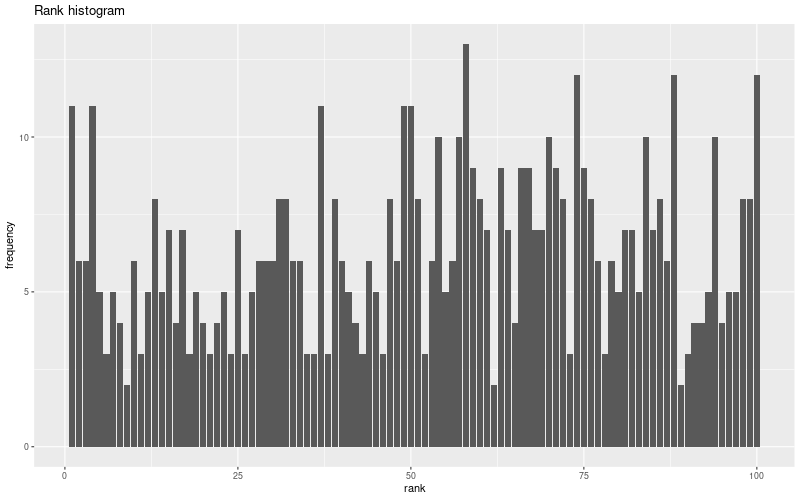
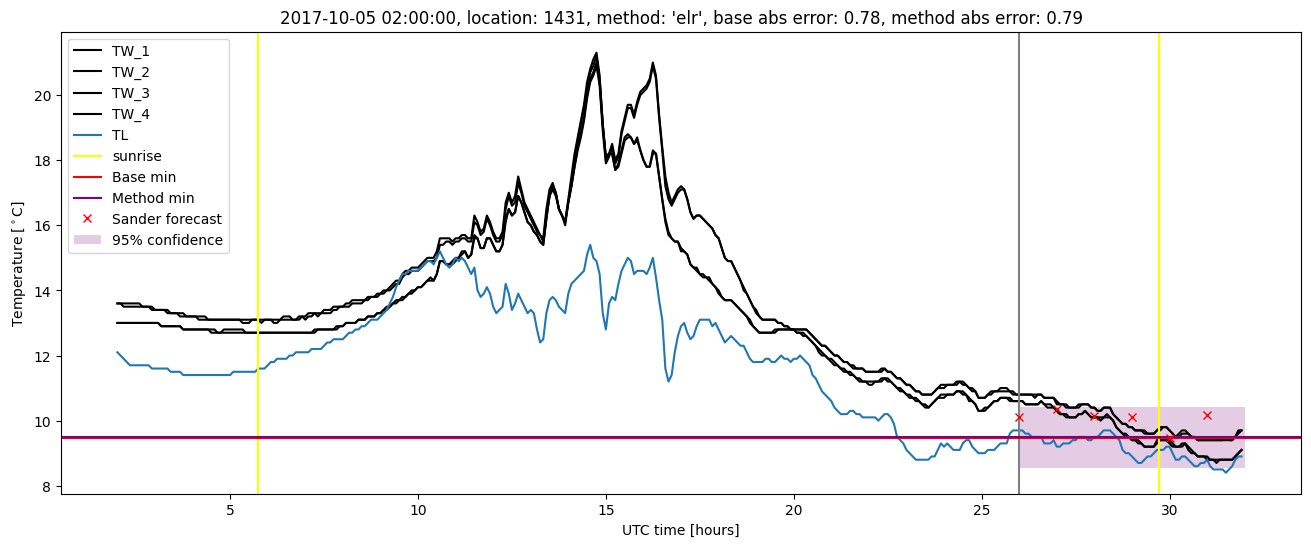
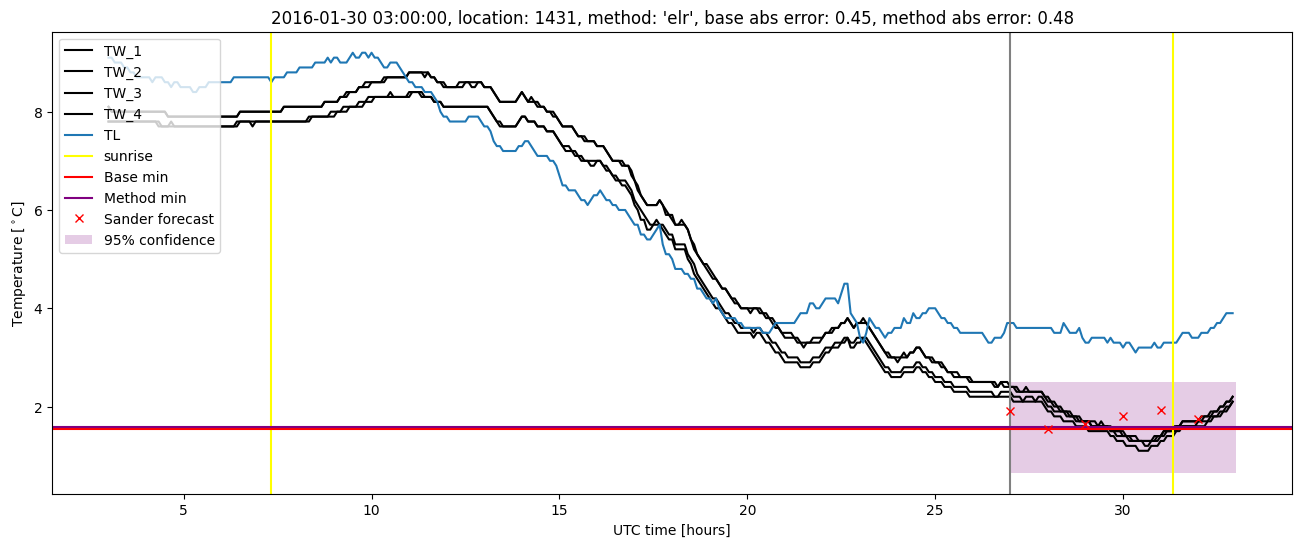
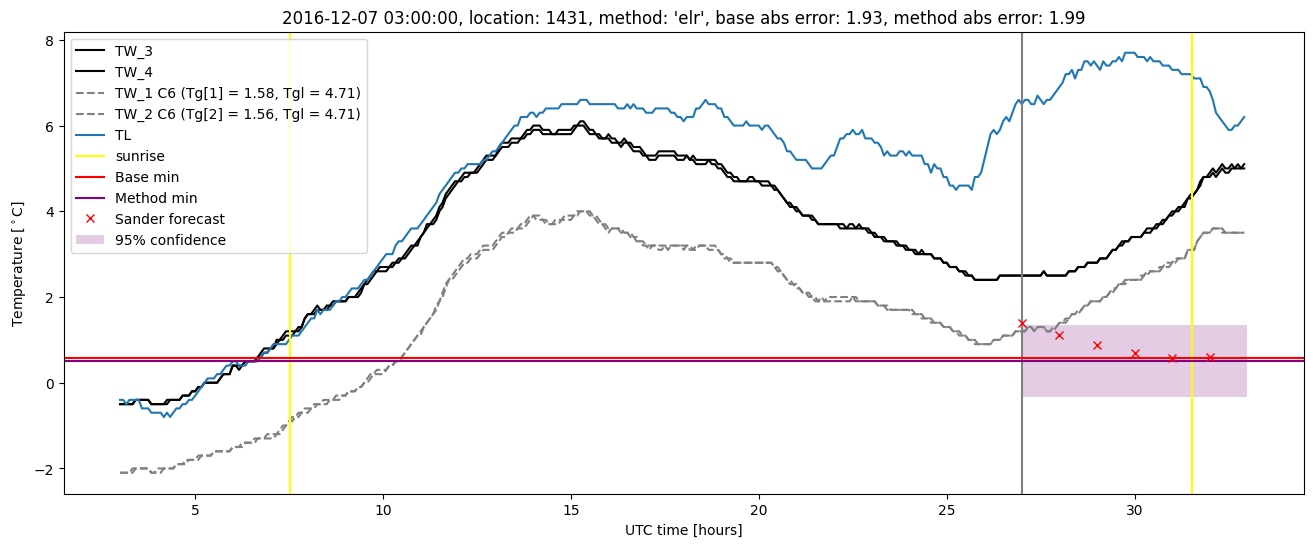
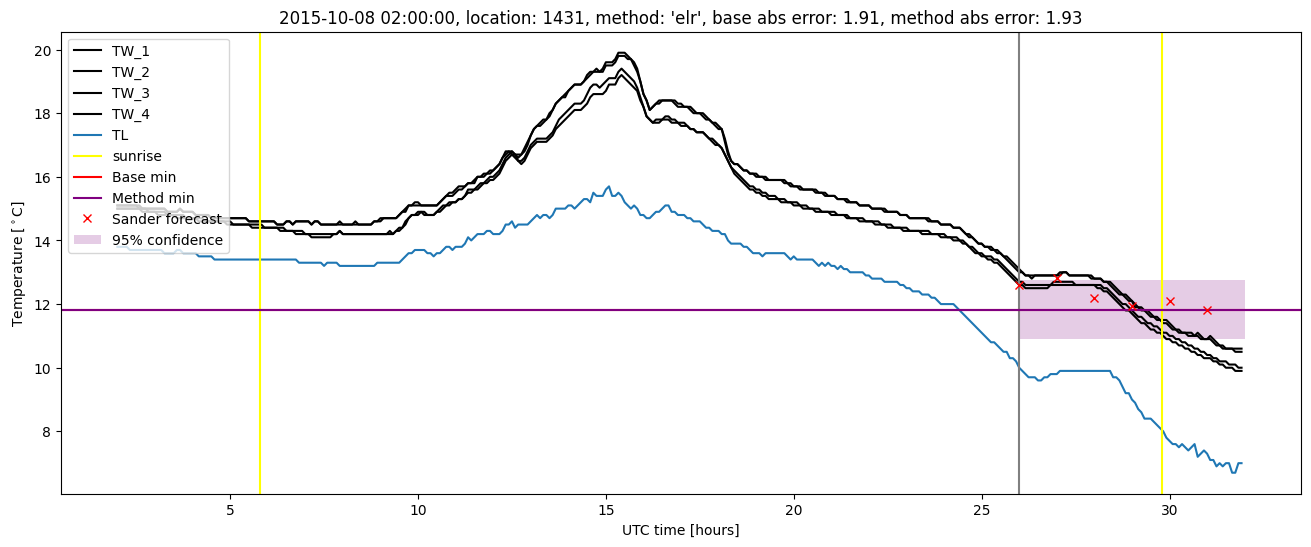
Extended logistic regression plots