GMS location: 1421
Random forest results
| names |
period |
power |
significance |
meanSquareError |
absError |
maxError |
CRPS |
IGN |
| baseline |
winter 2016 |
0.983 |
0.000e+00 |
0.377 |
0.449 |
2.015 |
NaN |
NaN |
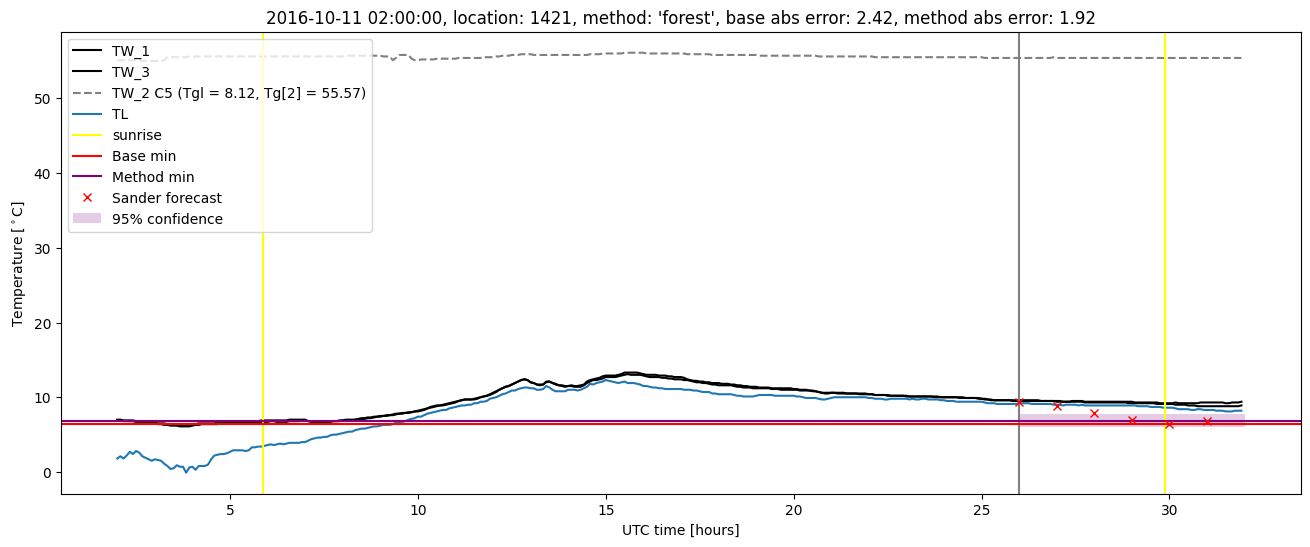
| forest |
winter 2016 |
1.000 |
0.000e+00 |
0.241 |
0.348 |
1.894 |
0.438 |
3.345 |
| baseline |
winter 2017 |
0.990 |
0.000e+00 |
0.536 |
0.518 |
2.420 |
NaN |
NaN |
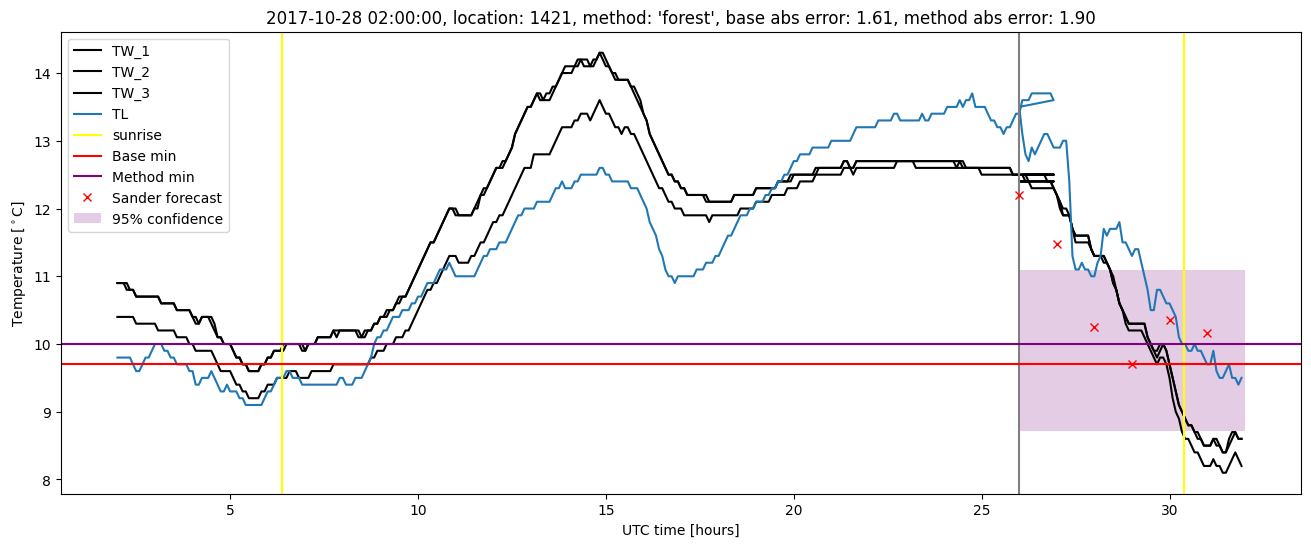
| forest |
winter 2017 |
1.000 |
0.000e+00 |
0.269 |
0.369 |
1.916 |
0.457 |
4.161 |
| baseline |
winter 2018 |
0.980 |
0.056 |
0.376 |
0.444 |
2.860 |
NaN |
NaN |
| forest |
winter 2018 |
0.980 |
0.056 |
0.225 |
0.325 |
2.563 |
0.440 |
4.354 |
| baseline |
winter 2019 |
0.993 |
0.000e+00 |
0.452 |
0.500 |
2.259 |
NaN |
NaN |
| forest |
winter 2019 |
1.000 |
0.000e+00 |
0.270 |
0.387 |
1.559 |
0.429 |
4.227 |
| baseline |
all |
0.986 |
0.017 |
0.427 |
0.474 |
2.860 |
NaN |
NaN |
| forest |
all |
0.995 |
0.017 |
0.249 |
0.355 |
2.563 |
0.440 |
3.985 |
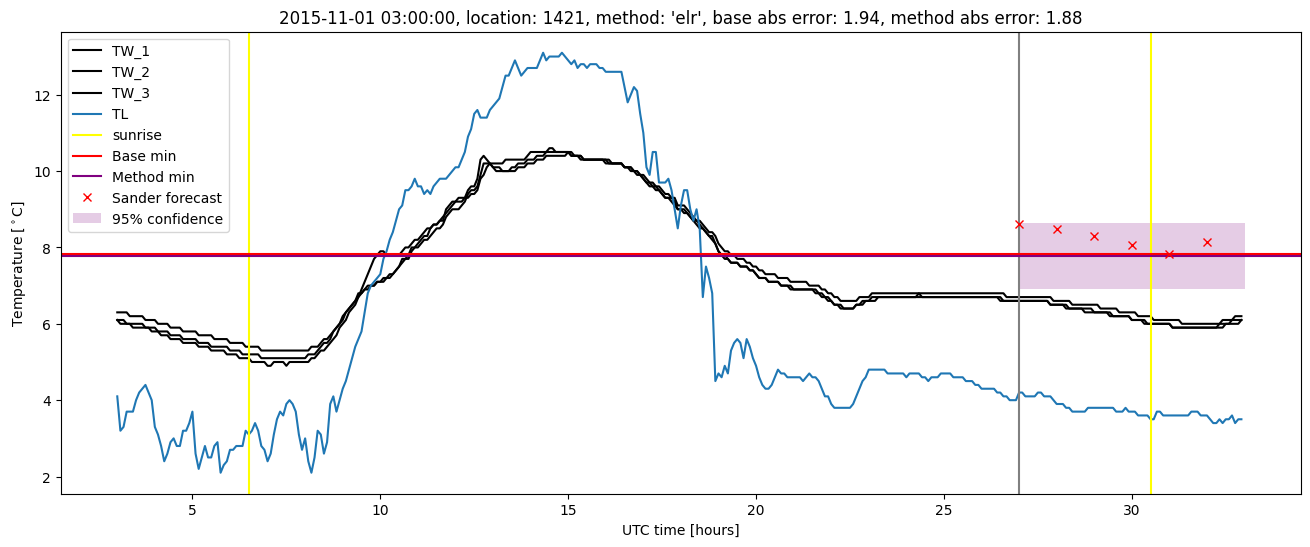
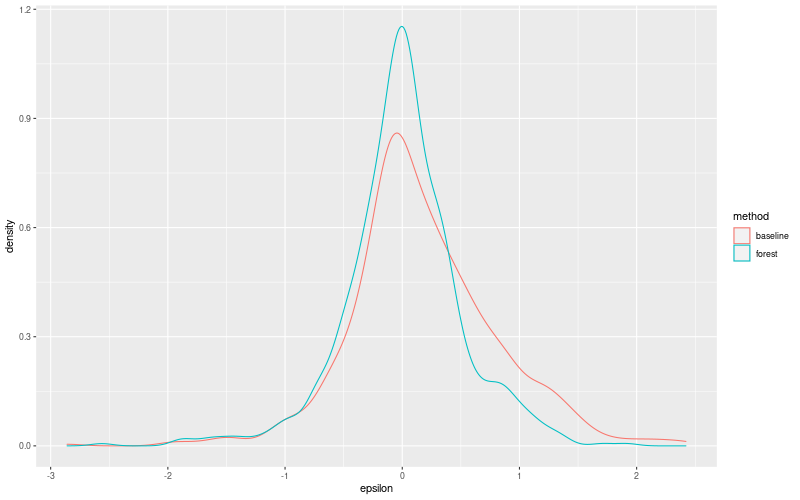
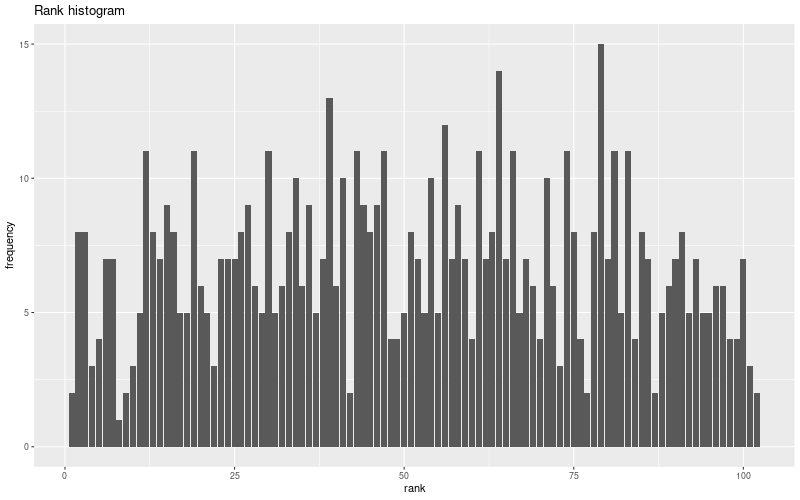
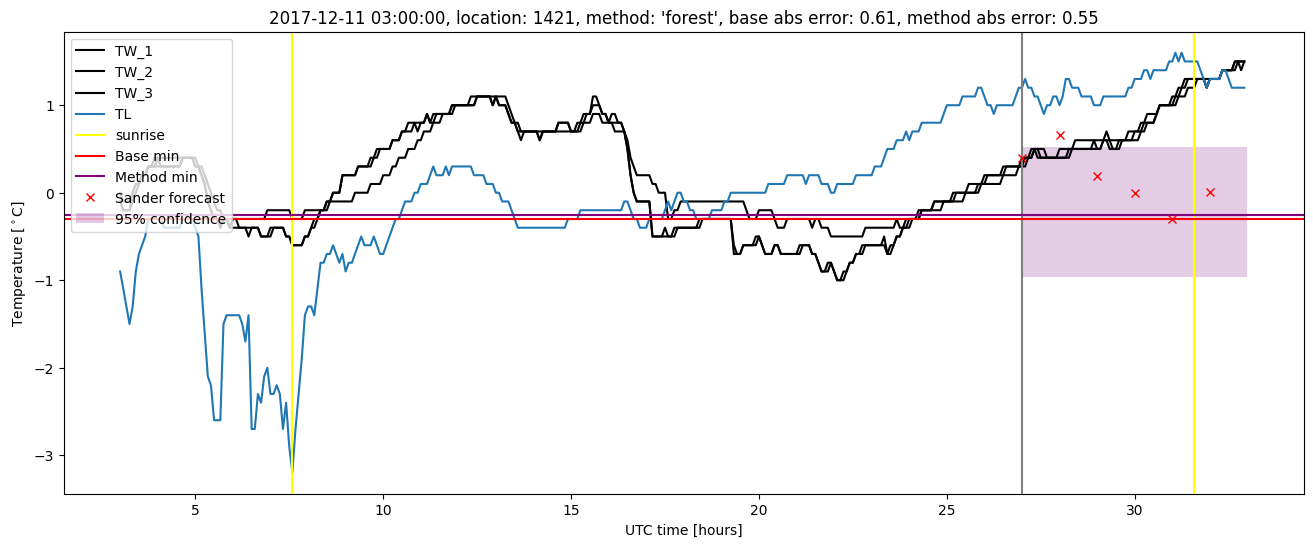
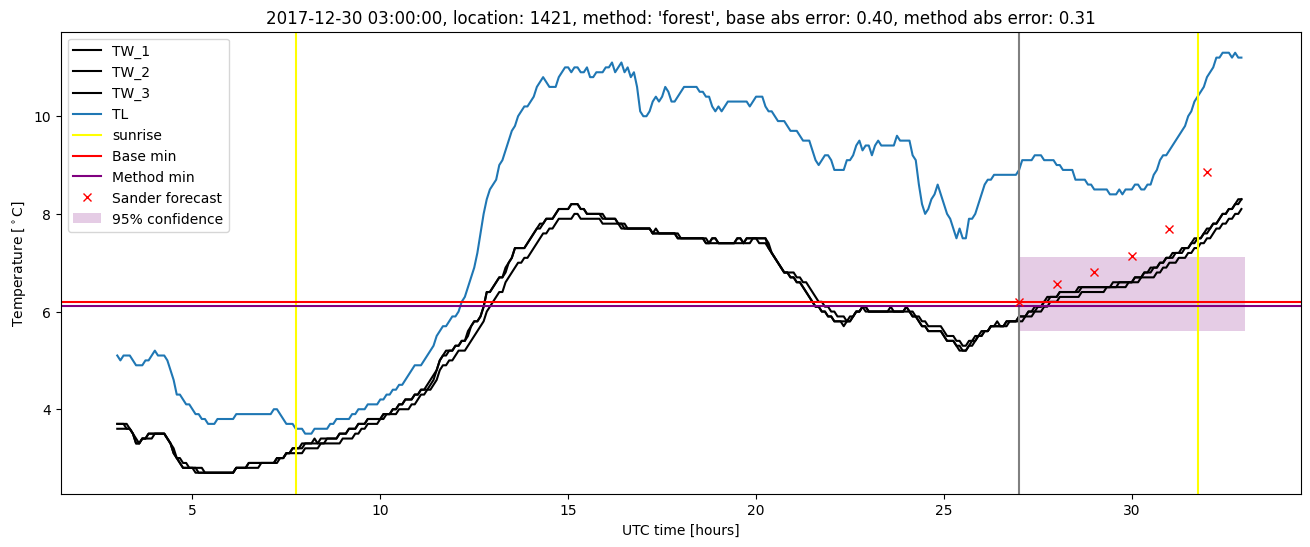
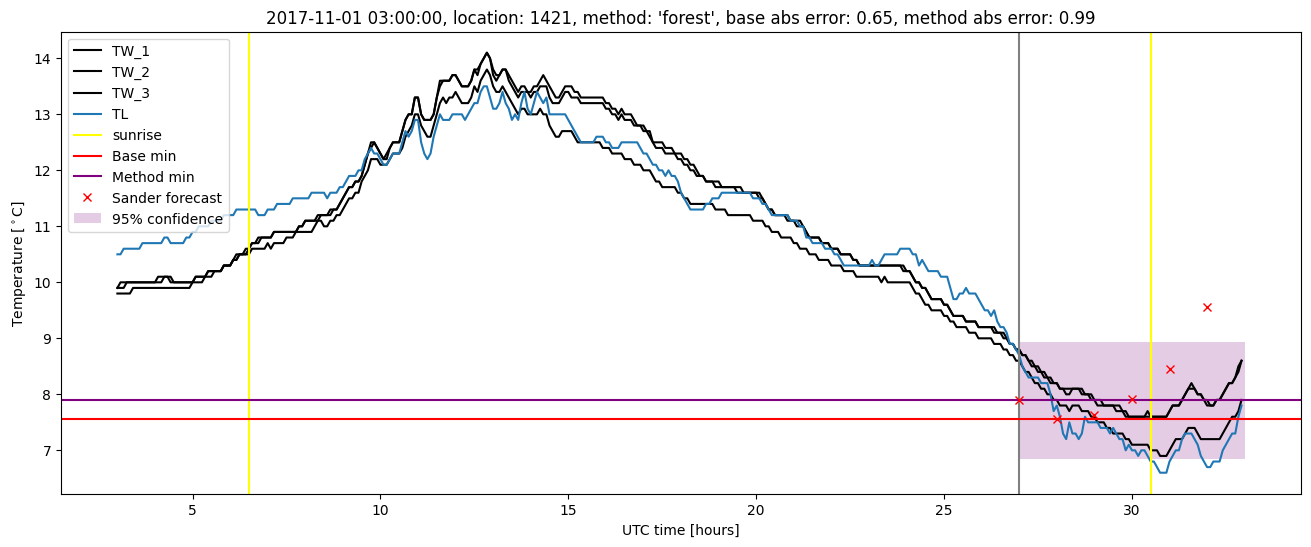
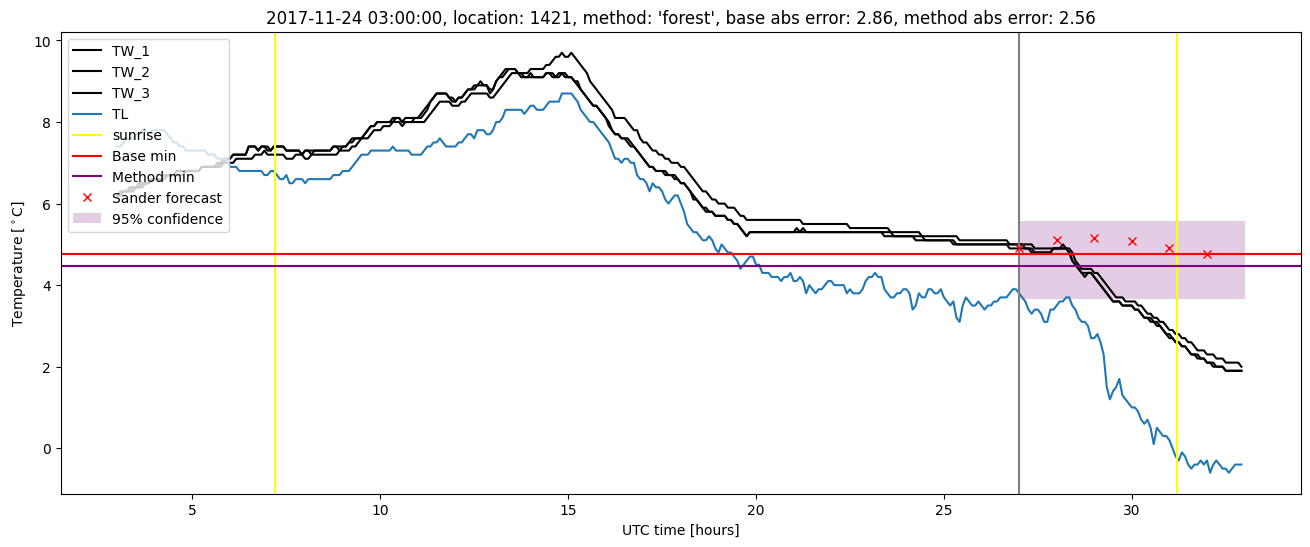
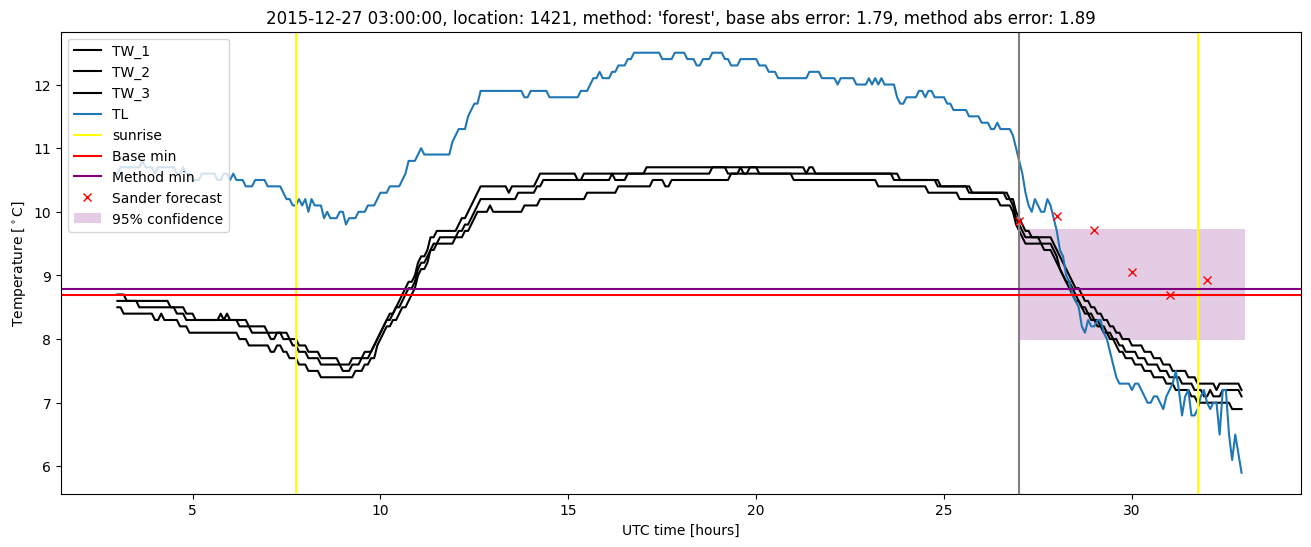
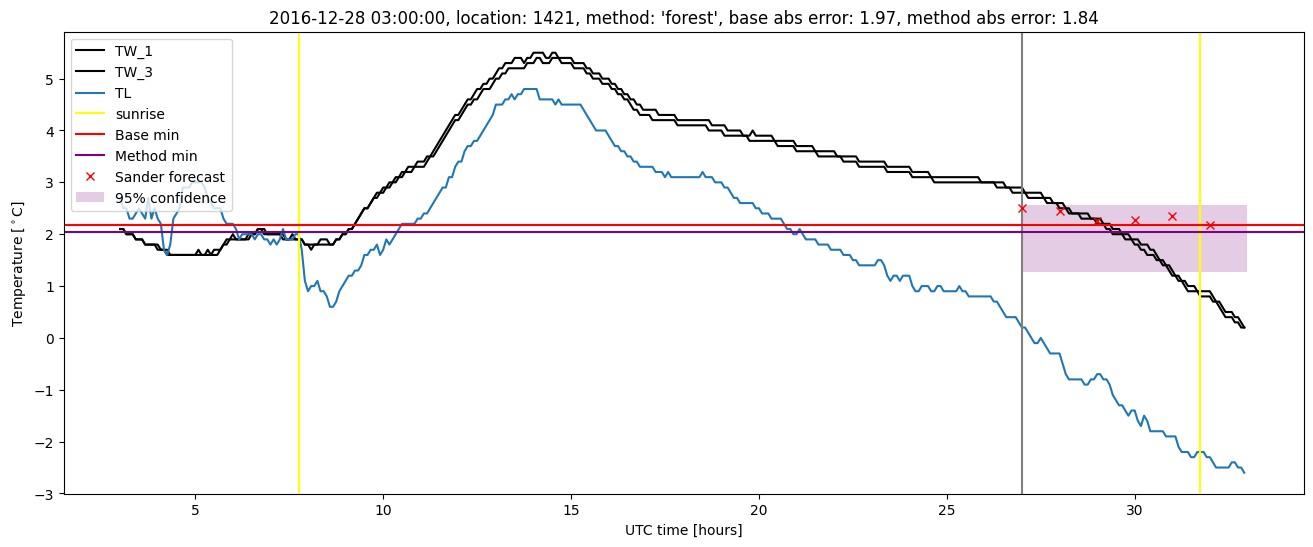
Random forest plots
Extended logistic regression results
| names |
period |
power |
significance |
meanSquareError |
absError |
maxError |
CRPS |
IGN |
| baseline |
winter 2016 |
0.983 |
0.000e+00 |
0.377 |
0.449 |
2.015 |
NaN |
NaN |
| elr |
winter 2016 |
0.989 |
0.000e+00 |
0.287 |
0.397 |
1.876 |
0.501 |
3.904 |
| baseline |
winter 2017 |
0.990 |
0.000e+00 |
0.536 |
0.518 |
2.420 |
NaN |
NaN |
| elr |
winter 2017 |
1.000 |
0.000e+00 |
0.308 |
0.418 |
1.823 |
0.487 |
3.727 |
| baseline |
winter 2018 |
0.980 |
0.056 |
0.376 |
0.444 |
2.860 |
NaN |
NaN |
| elr |
winter 2018 |
0.980 |
0.028 |
0.291 |
0.374 |
3.062 |
0.489 |
3.629 |
| baseline |
winter 2019 |
0.993 |
0.000e+00 |
0.452 |
0.500 |
2.259 |
NaN |
NaN |
| elr |
winter 2019 |
1.000 |
0.000e+00 |
0.375 |
0.472 |
1.922 |
0.537 |
4.940 |
| baseline |
all |
0.986 |
0.017 |
0.427 |
0.474 |
2.860 |
NaN |
NaN |
| elr |
all |
0.991 |
8.500e-03 |
0.312 |
0.413 |
3.062 |
0.503 |
4.032 |
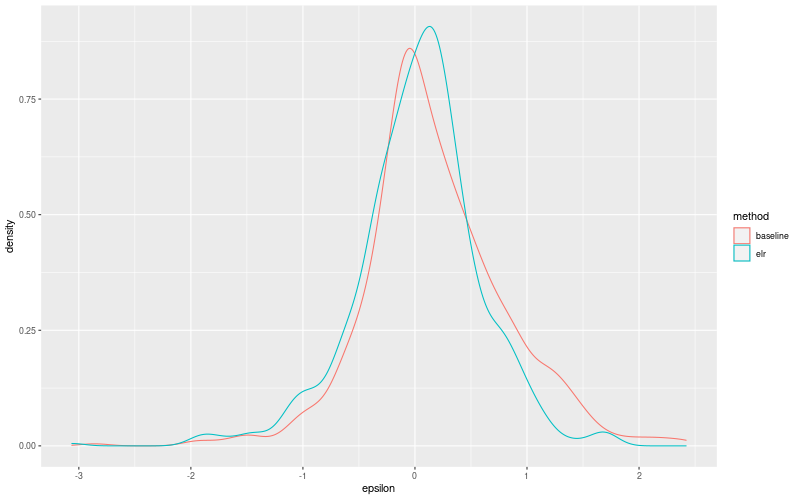
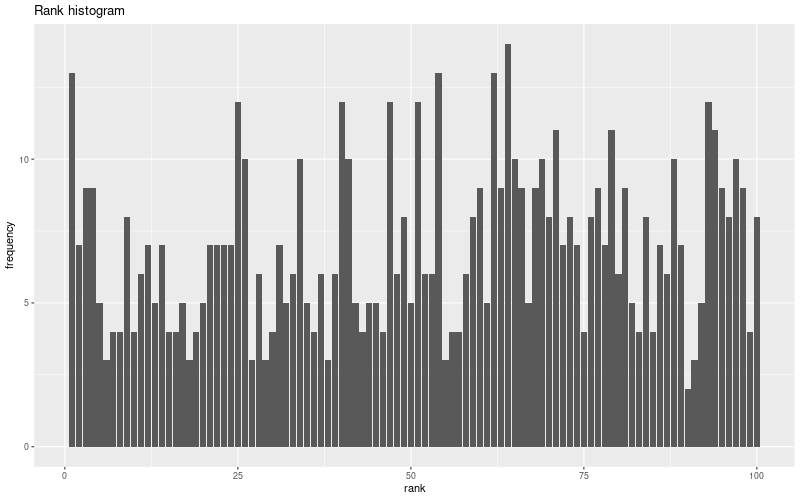
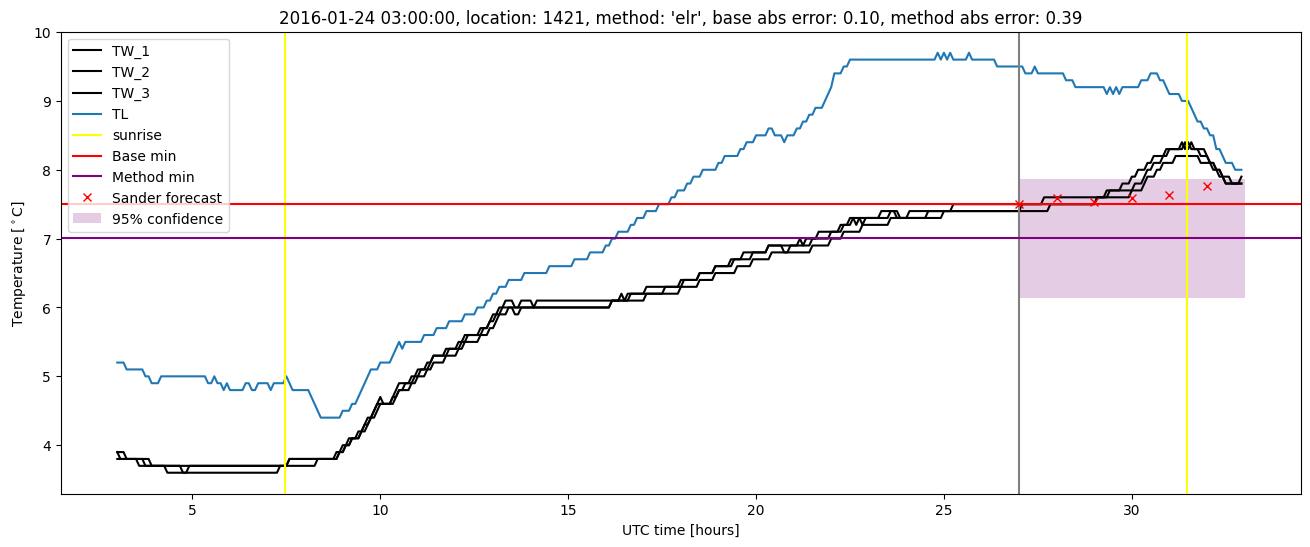
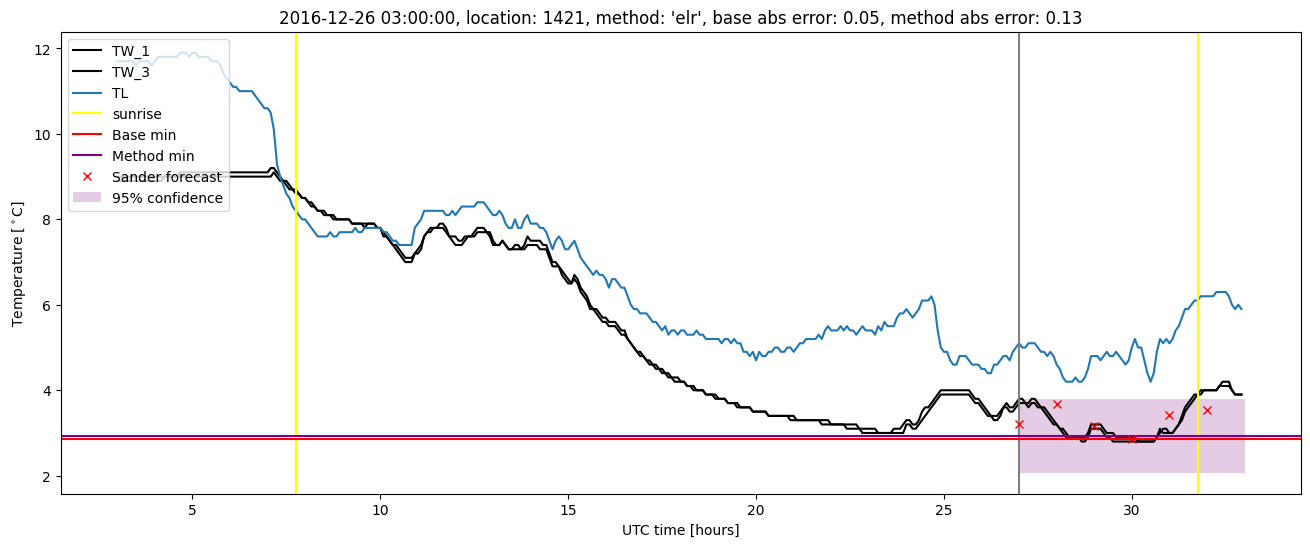
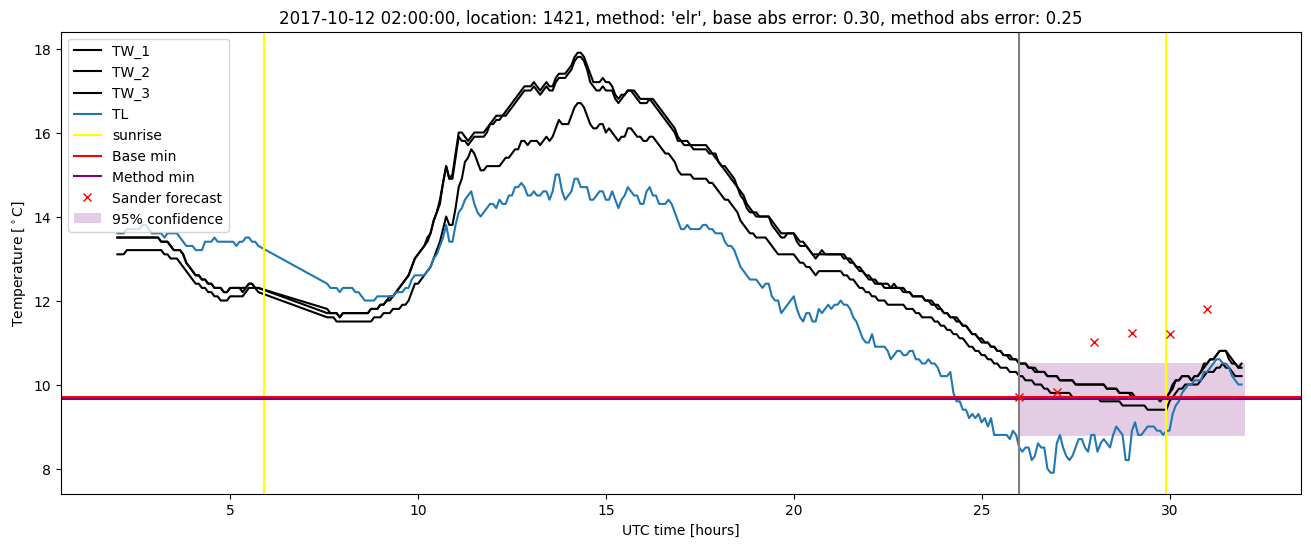
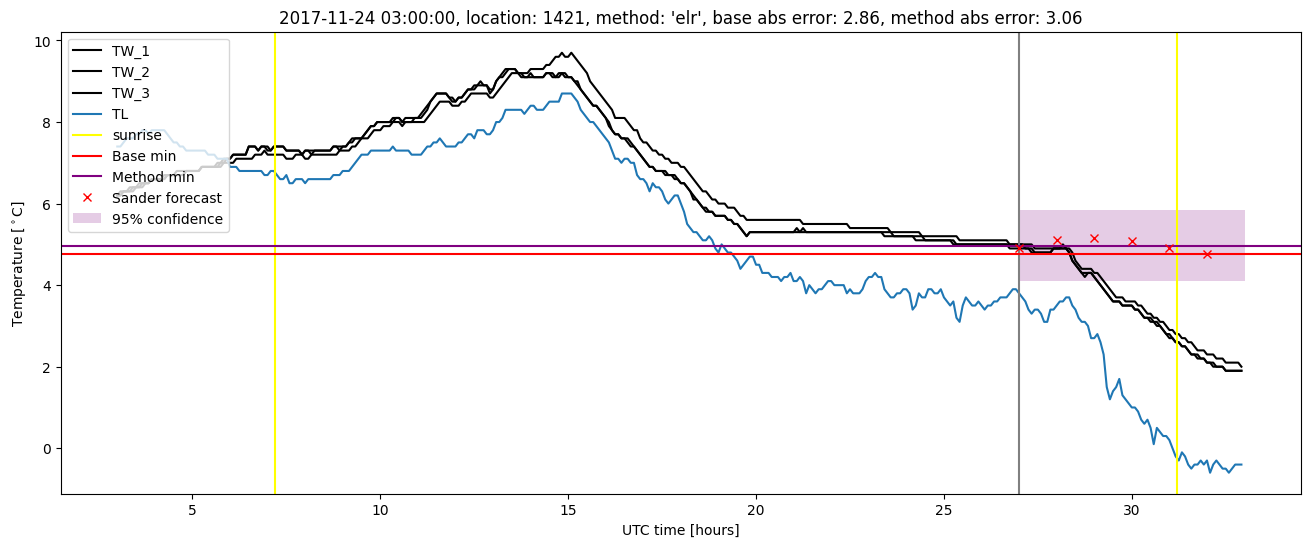
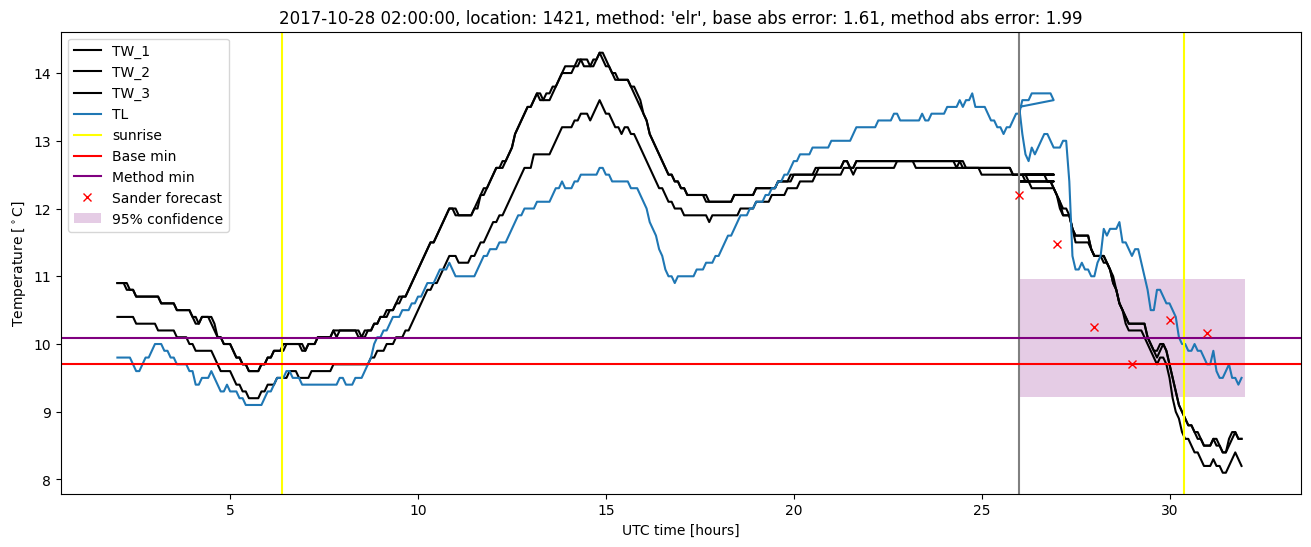
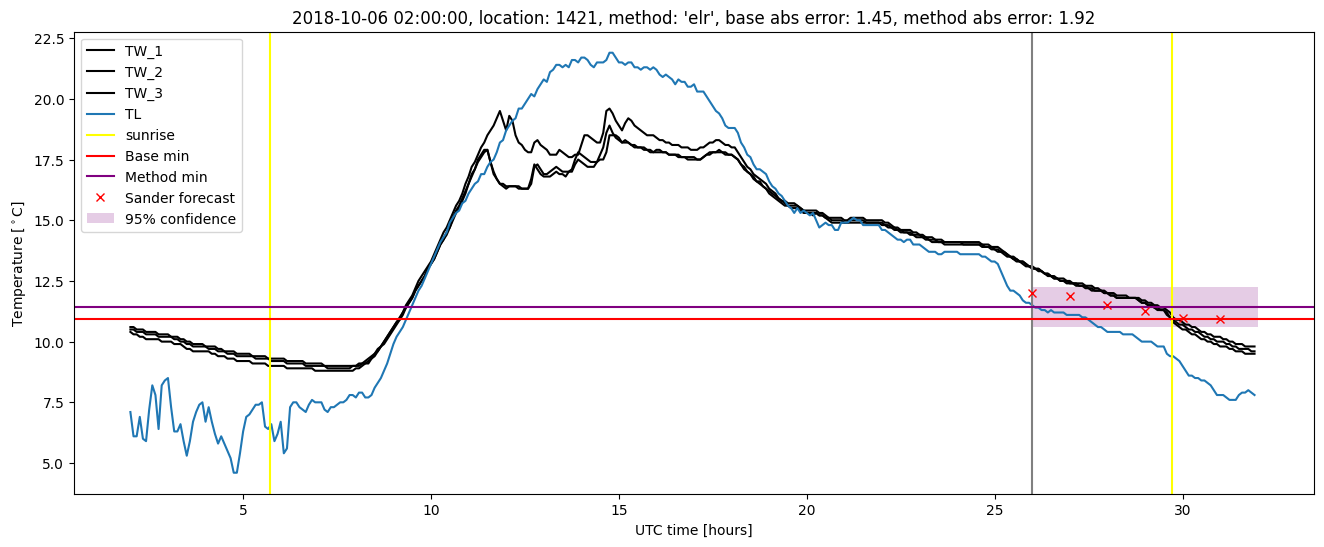
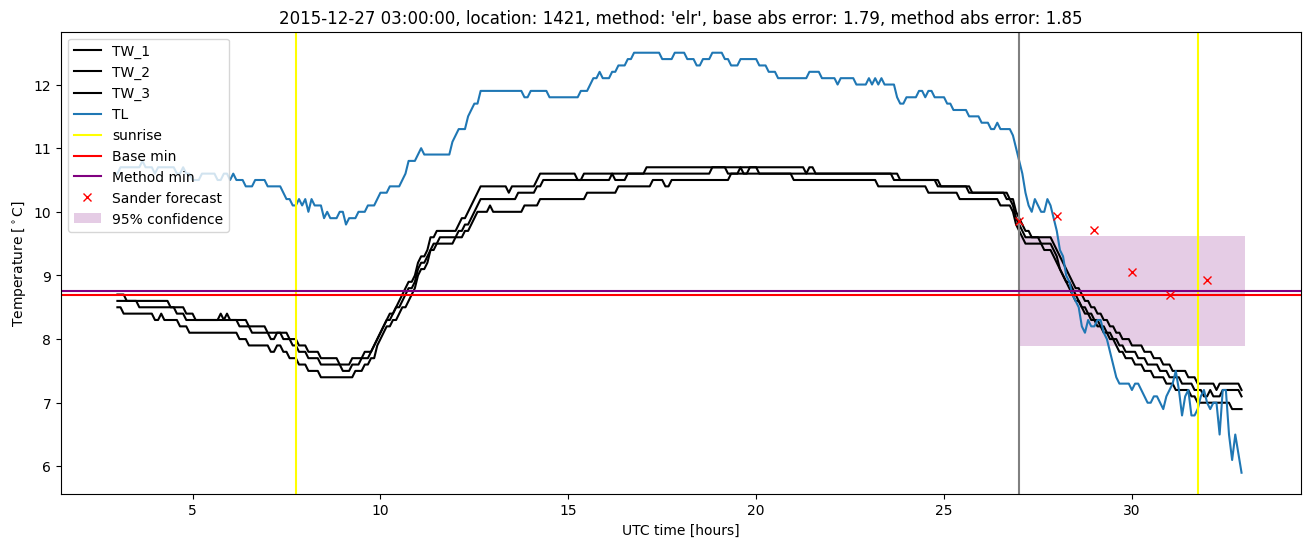
Extended logistic regression plots