GMS location: 1420
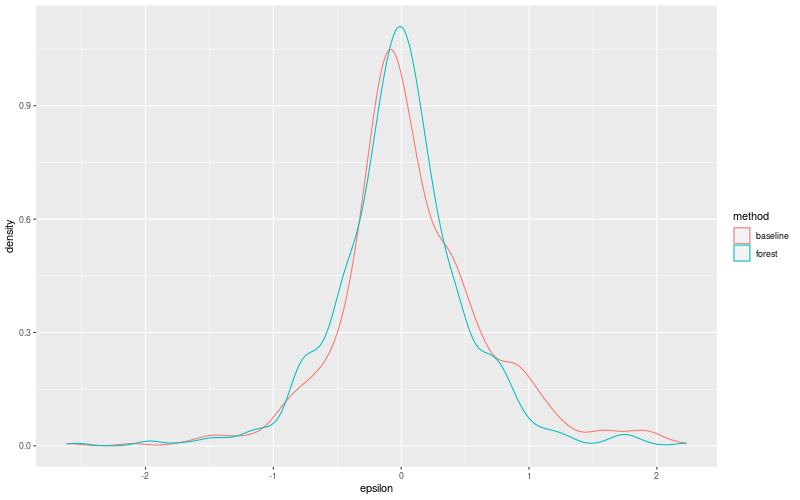
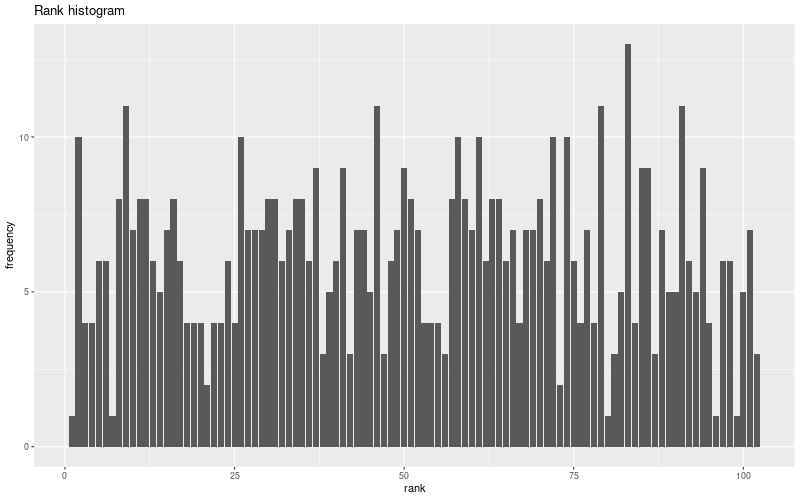
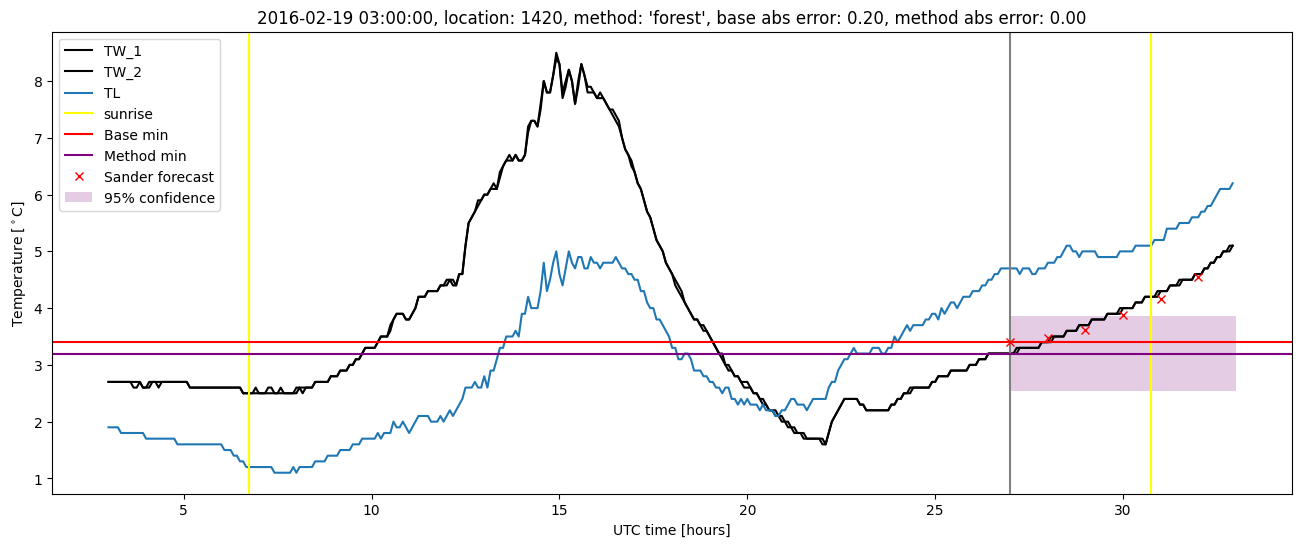
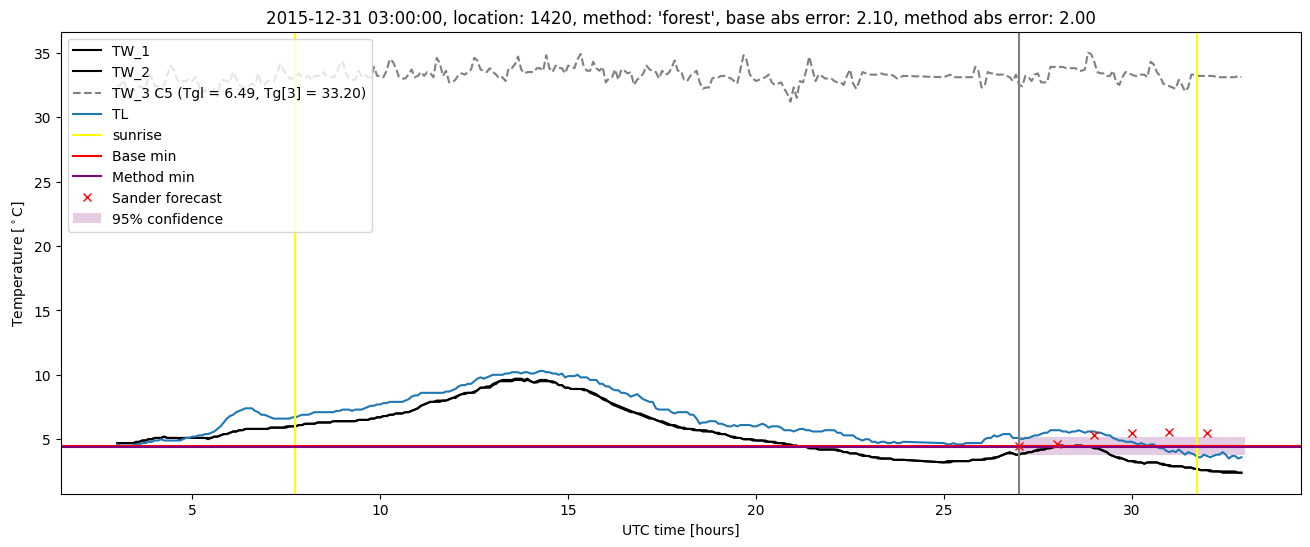
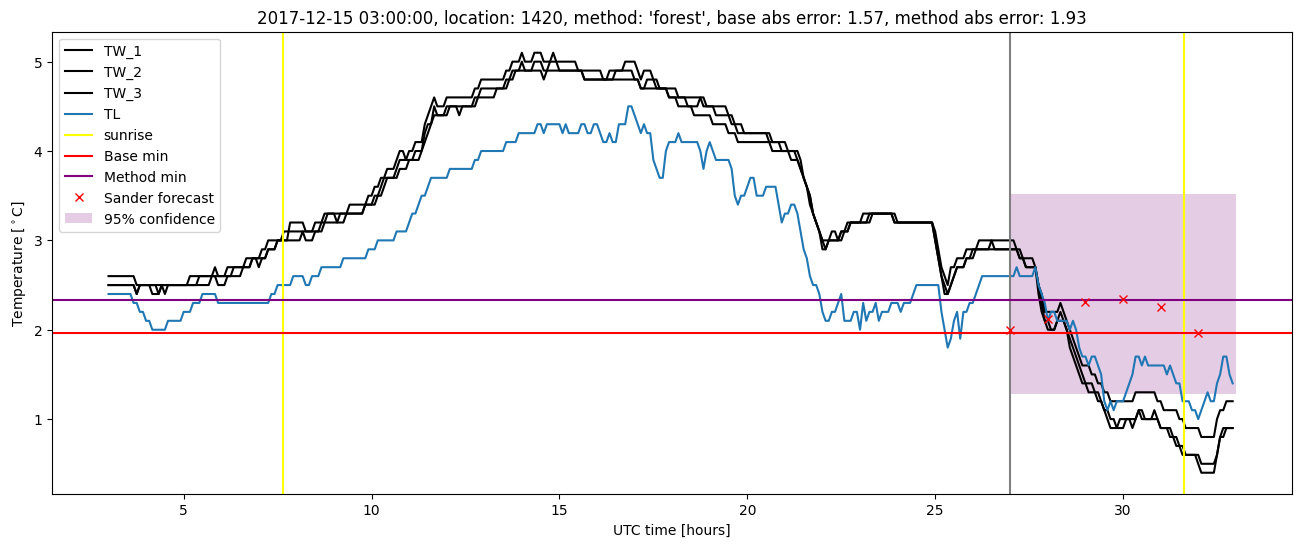
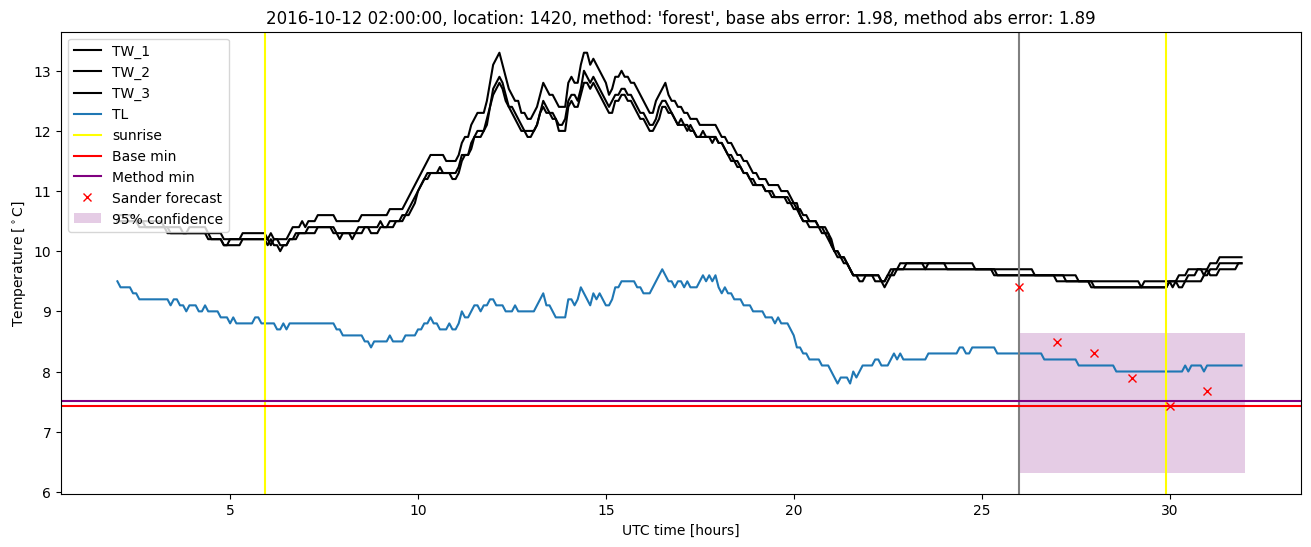
Random forest results
| names |
period |
power |
significance |
meanSquareError |
absError |
maxError |
CRPS |
IGN |
| baseline |
winter 2016 |
0.983 |
0.000e+00 |
0.291 |
0.400 |
2.098 |
NaN |
NaN |
| forest |
winter 2016 |
0.978 |
0.053 |
0.238 |
0.353 |
2.002 |
0.461 |
3.782 |
| baseline |
winter 2017 |
0.991 |
0.077 |
0.374 |
0.416 |
2.613 |
NaN |
NaN |
| forest |
winter 2017 |
0.991 |
0.103 |
0.281 |
0.361 |
2.537 |
0.448 |
3.162 |
| baseline |
winter 2018 |
0.985 |
0.114 |
0.409 |
0.448 |
2.180 |
NaN |
NaN |
| forest |
winter 2018 |
1.000 |
0.143 |
0.292 |
0.371 |
2.227 |
0.444 |
3.472 |
| baseline |
winter 2019 |
1.000 |
0.077 |
0.337 |
0.416 |
2.011 |
NaN |
NaN |
| forest |
winter 2019 |
1.000 |
0.077 |
0.246 |
0.372 |
1.601 |
0.445 |
3.224 |
| baseline |
all |
0.991 |
0.075 |
0.343 |
0.416 |
2.613 |
NaN |
NaN |
| forest |
all |
0.991 |
0.104 |
0.259 |
0.363 |
2.537 |
0.451 |
3.425 |
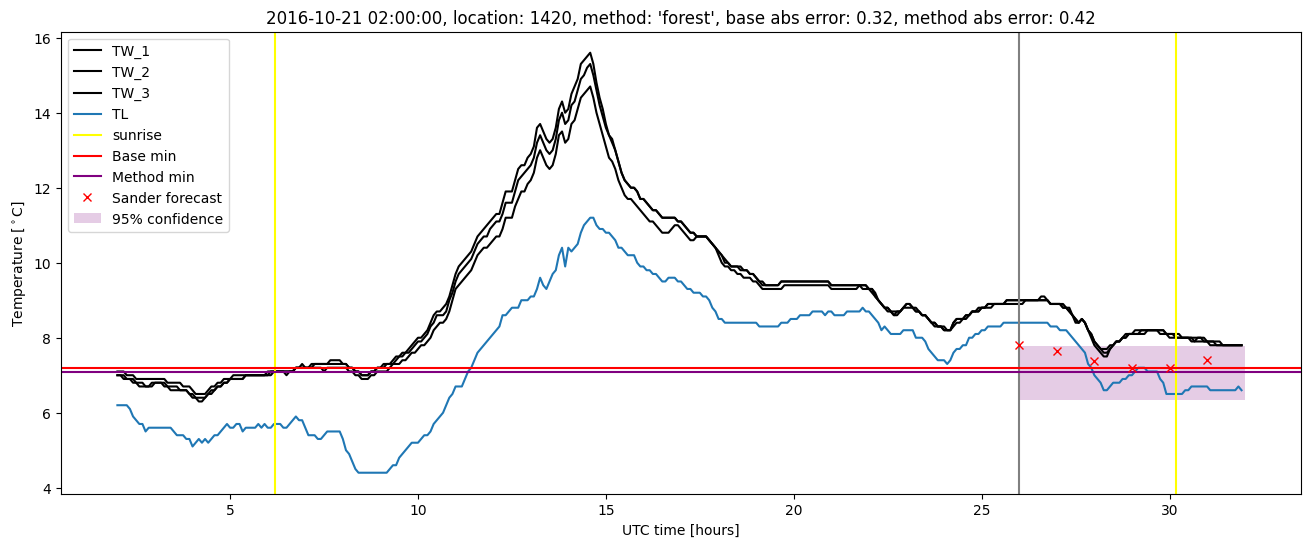
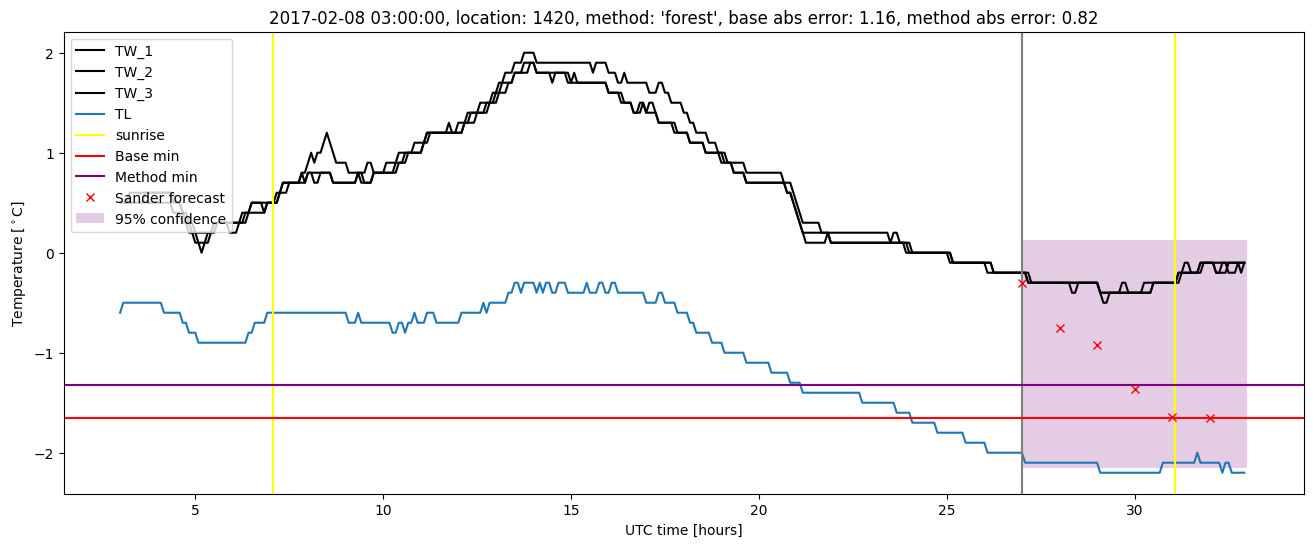
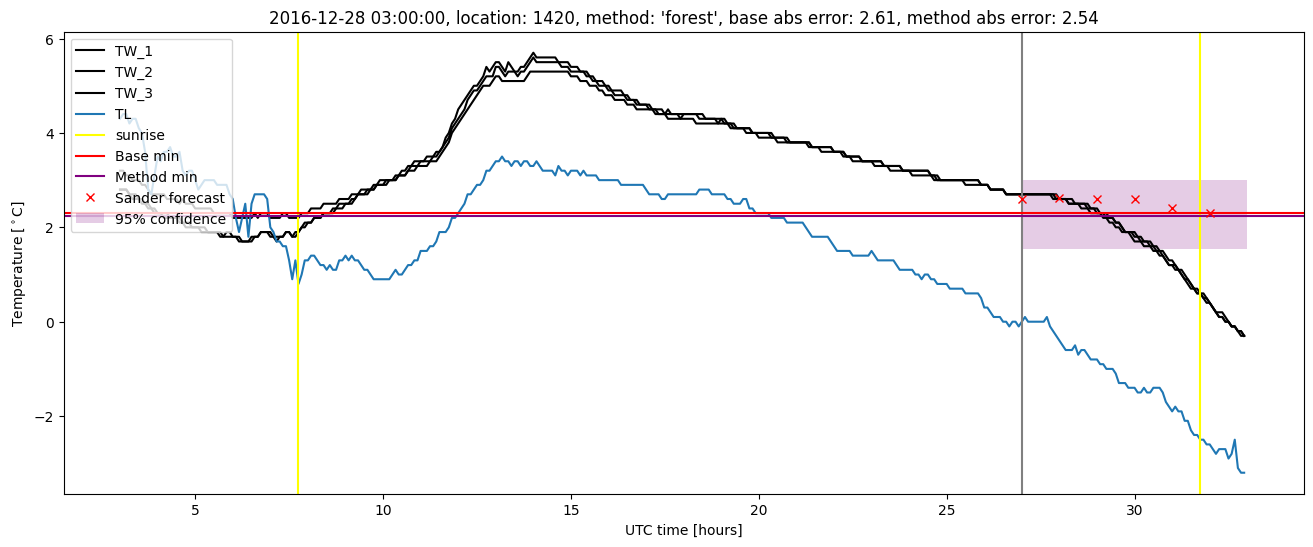
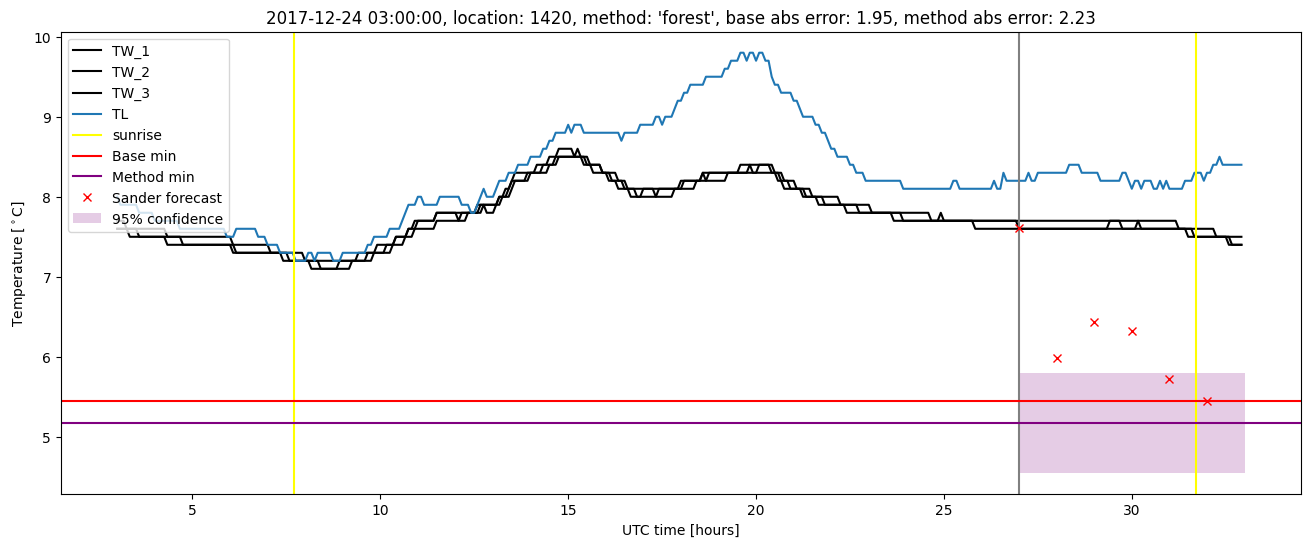
Random forest plots
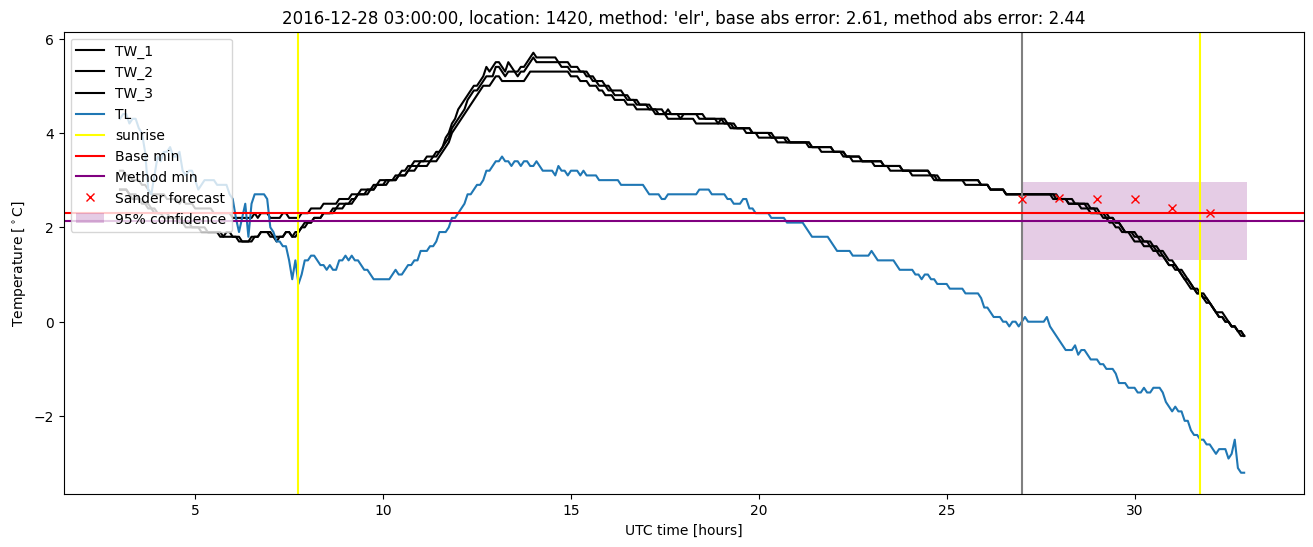
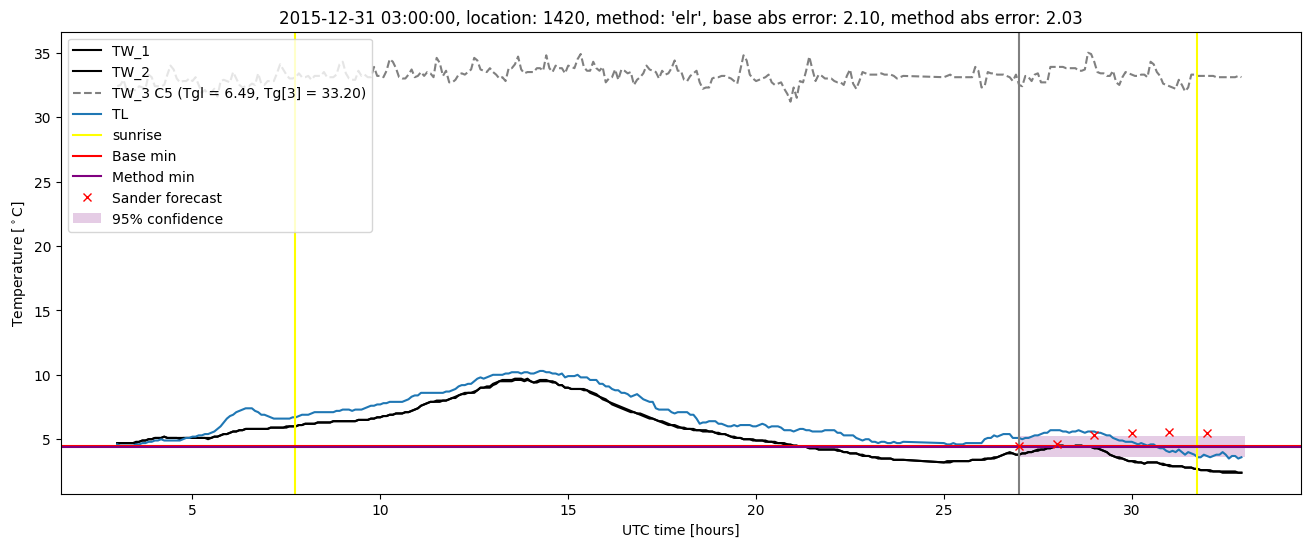
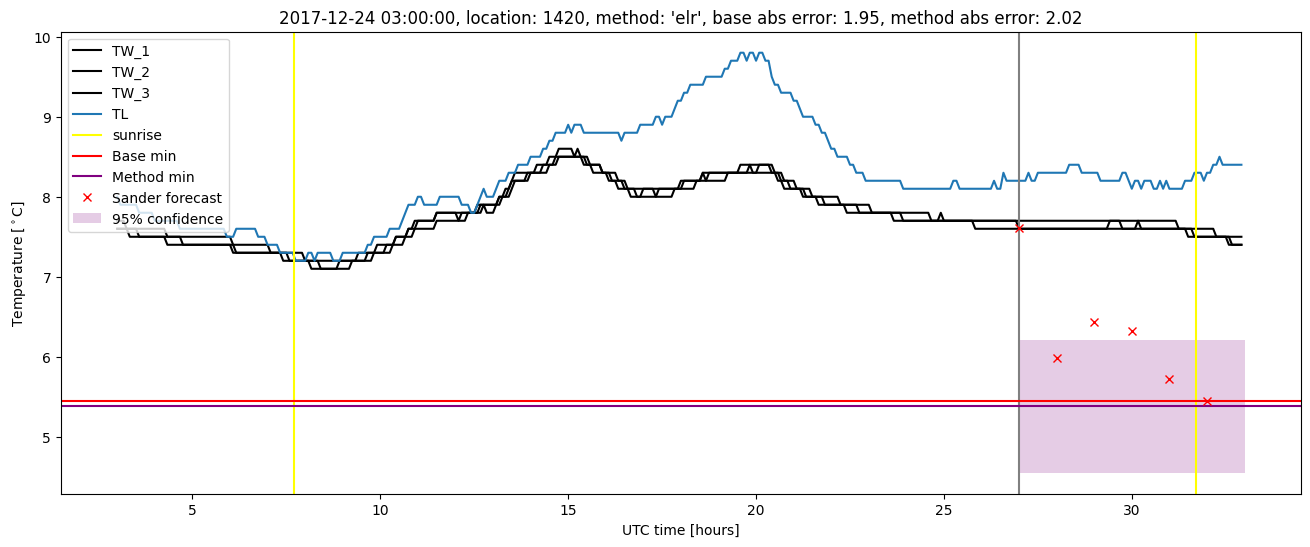
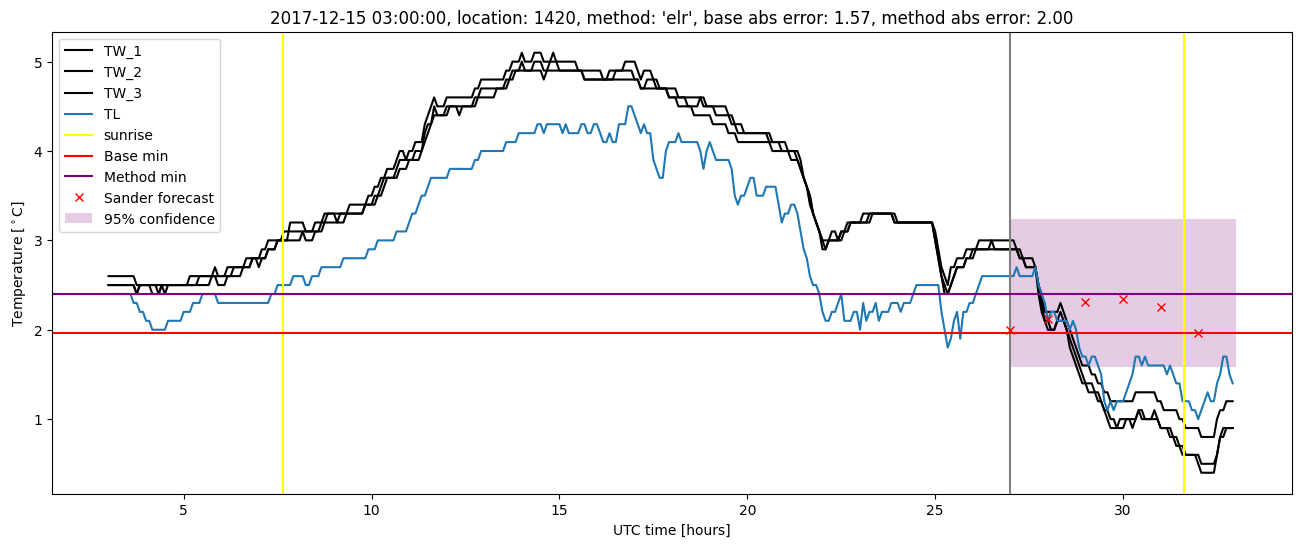
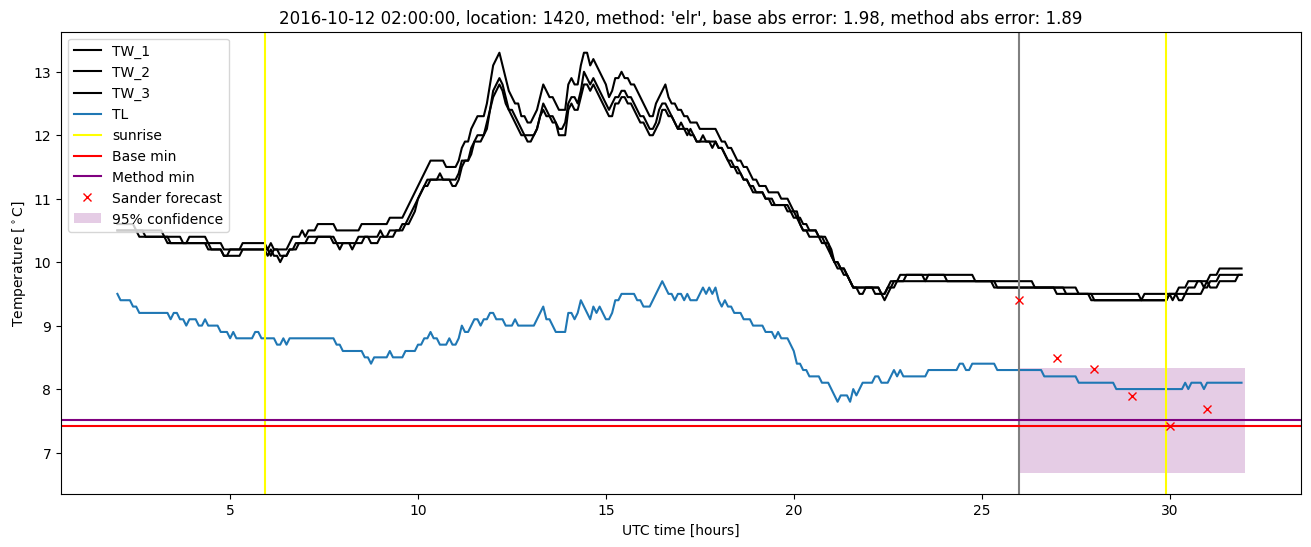
Extended logistic regression results
| names |
period |
power |
significance |
meanSquareError |
absError |
maxError |
CRPS |
IGN |
| baseline |
winter 2016 |
0.983 |
0.000e+00 |
0.291 |
0.400 |
2.098 |
NaN |
NaN |
| elr |
winter 2016 |
0.978 |
0.000e+00 |
0.267 |
0.379 |
2.028 |
0.524 |
4.862 |
| baseline |
winter 2017 |
0.991 |
0.077 |
0.374 |
0.416 |
2.613 |
NaN |
NaN |
| elr |
winter 2017 |
0.991 |
0.128 |
0.317 |
0.382 |
2.439 |
0.503 |
4.708 |
| baseline |
winter 2018 |
0.985 |
0.114 |
0.409 |
0.448 |
2.180 |
NaN |
NaN |
| elr |
winter 2018 |
1.000 |
0.171 |
0.289 |
0.380 |
2.019 |
0.492 |
4.344 |
| baseline |
winter 2019 |
1.000 |
0.077 |
0.337 |
0.416 |
2.011 |
NaN |
NaN |
| elr |
winter 2019 |
1.000 |
0.077 |
0.298 |
0.421 |
1.715 |
0.502 |
5.002 |
| baseline |
all |
0.991 |
0.075 |
0.343 |
0.416 |
2.613 |
NaN |
NaN |
| elr |
all |
0.991 |
0.113 |
0.291 |
0.392 |
2.439 |
0.508 |
4.780 |
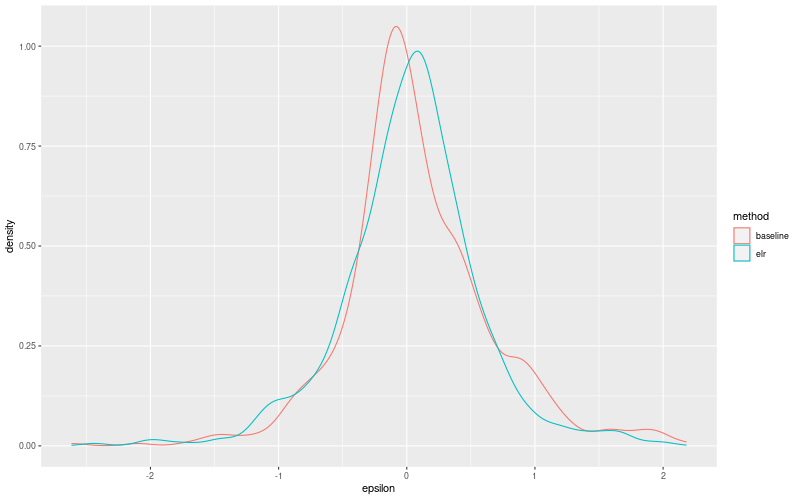
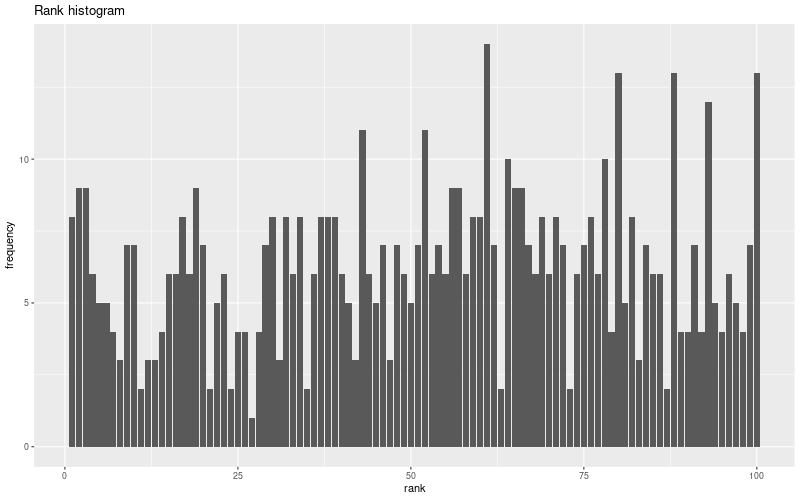
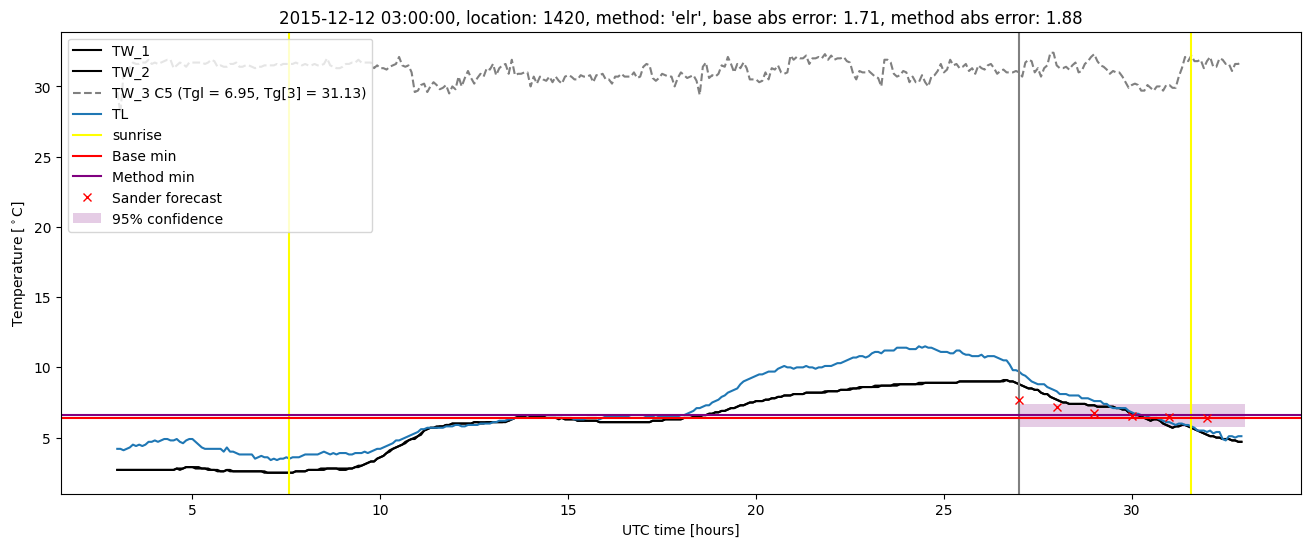
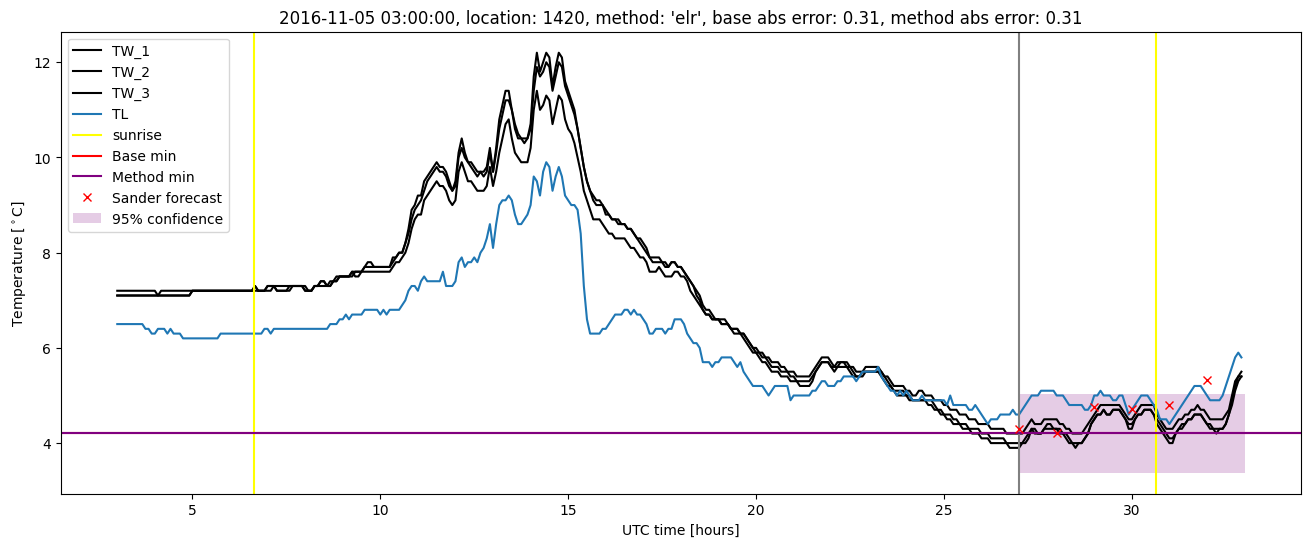
Extended logistic regression plots