GMS location: 1419
Random forest results
| names |
period |
power |
significance |
meanSquareError |
absError |
maxError |
CRPS |
IGN |
| baseline |
winter 2016 |
0.976 |
0.043 |
0.279 |
0.396 |
2.448 |
NaN |
NaN |
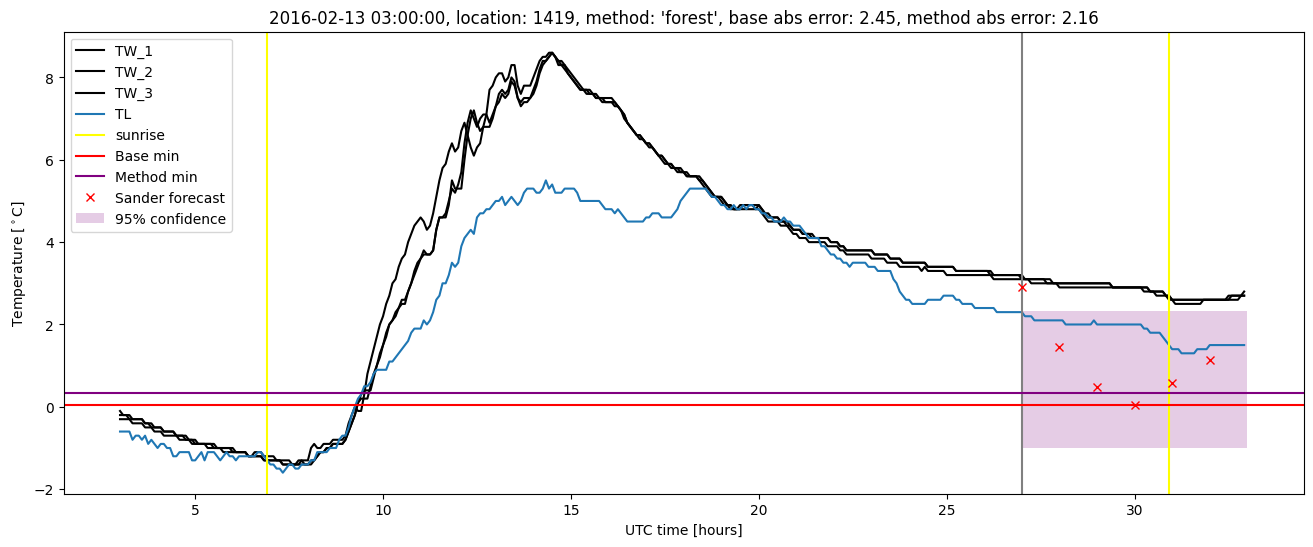
| forest |
winter 2016 |
0.976 |
0.043 |
0.229 |
0.348 |
2.156 |
0.454 |
2.202 |
| baseline |
winter 2017 |
0.982 |
0.048 |
0.460 |
0.475 |
2.731 |
NaN |
NaN |
| forest |
winter 2017 |
0.991 |
0.048 |
0.352 |
0.433 |
2.021 |
0.455 |
2.577 |
| baseline |
winter 2018 |
0.978 |
0.111 |
0.374 |
0.417 |
2.995 |
NaN |
NaN |
| forest |
winter 2018 |
0.985 |
0.111 |
0.345 |
0.391 |
3.035 |
0.469 |
2.992 |
| baseline |
winter 2019 |
0.991 |
0.000e+00 |
0.394 |
0.445 |
2.187 |
NaN |
NaN |
| forest |
winter 2019 |
0.991 |
0.154 |
0.328 |
0.428 |
1.515 |
0.468 |
2.693 |
| baseline |
all |
0.981 |
0.061 |
0.370 |
0.430 |
2.995 |
NaN |
NaN |
| forest |
all |
0.985 |
0.079 |
0.309 |
0.395 |
3.035 |
0.461 |
2.598 |
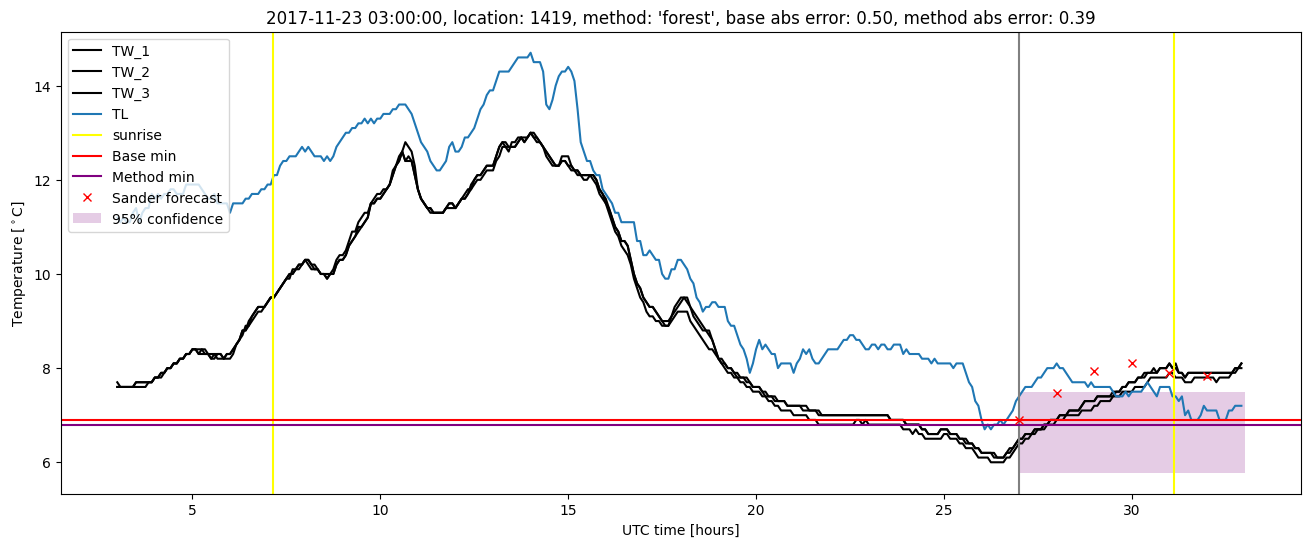
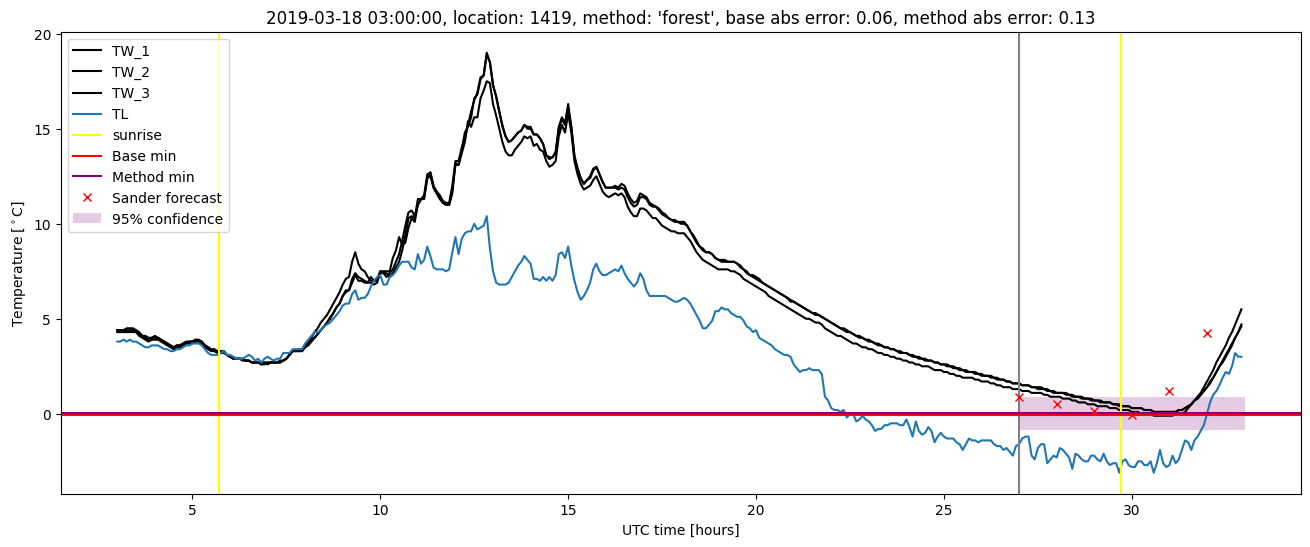
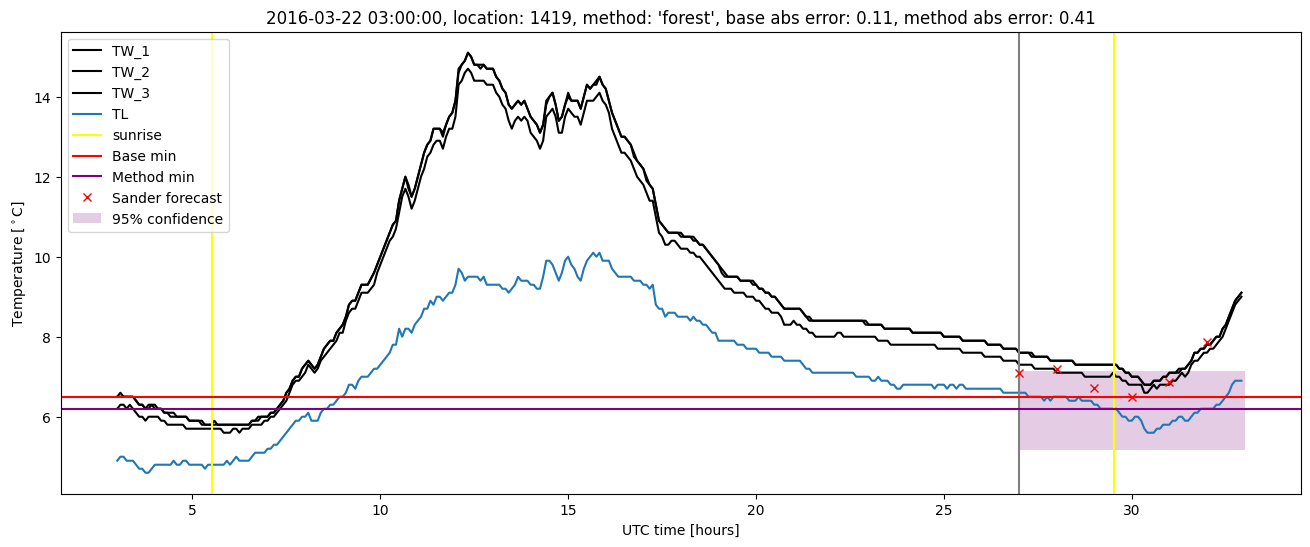
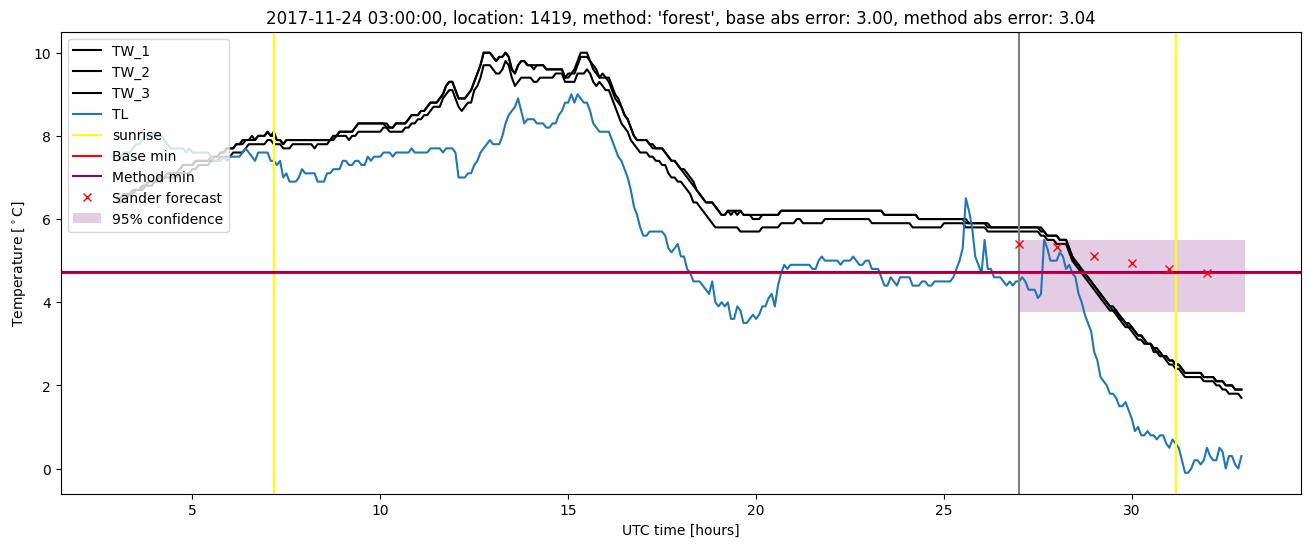
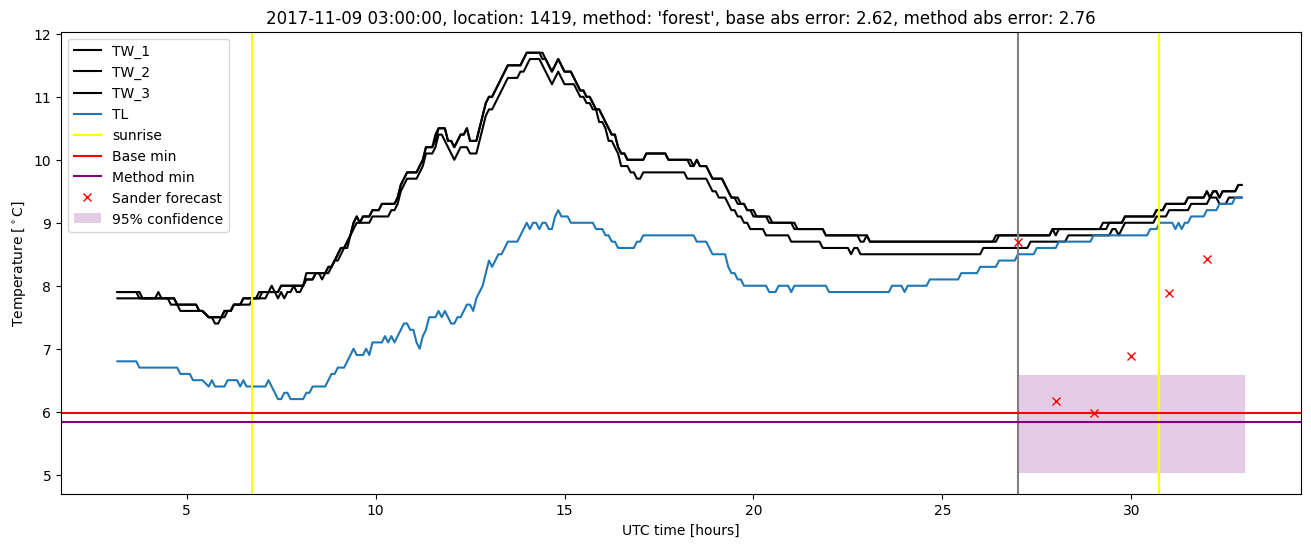
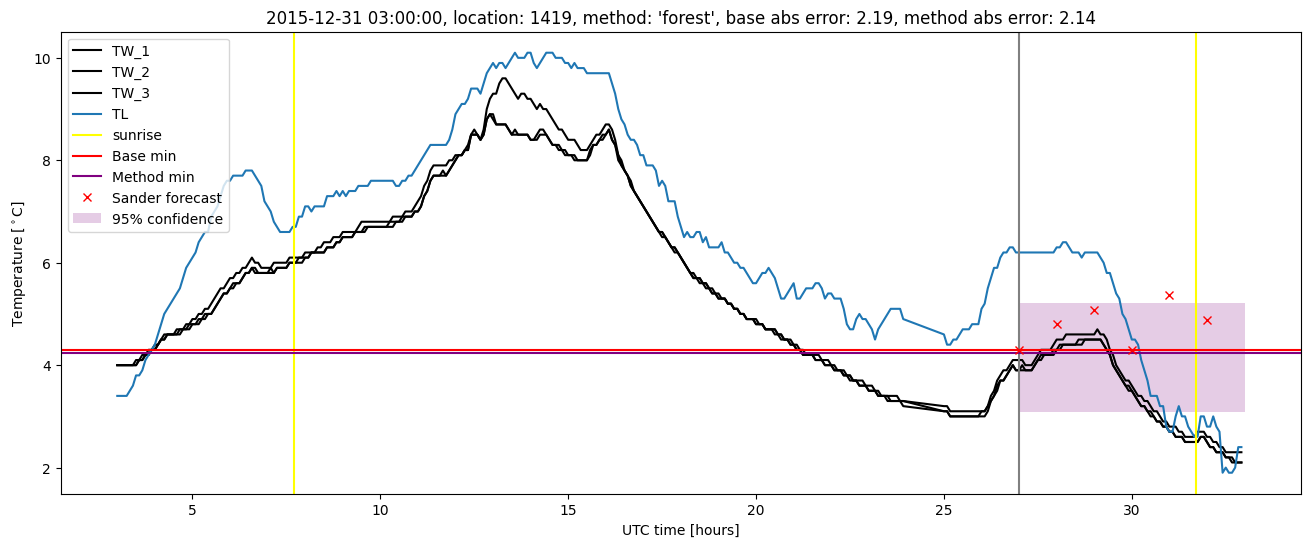
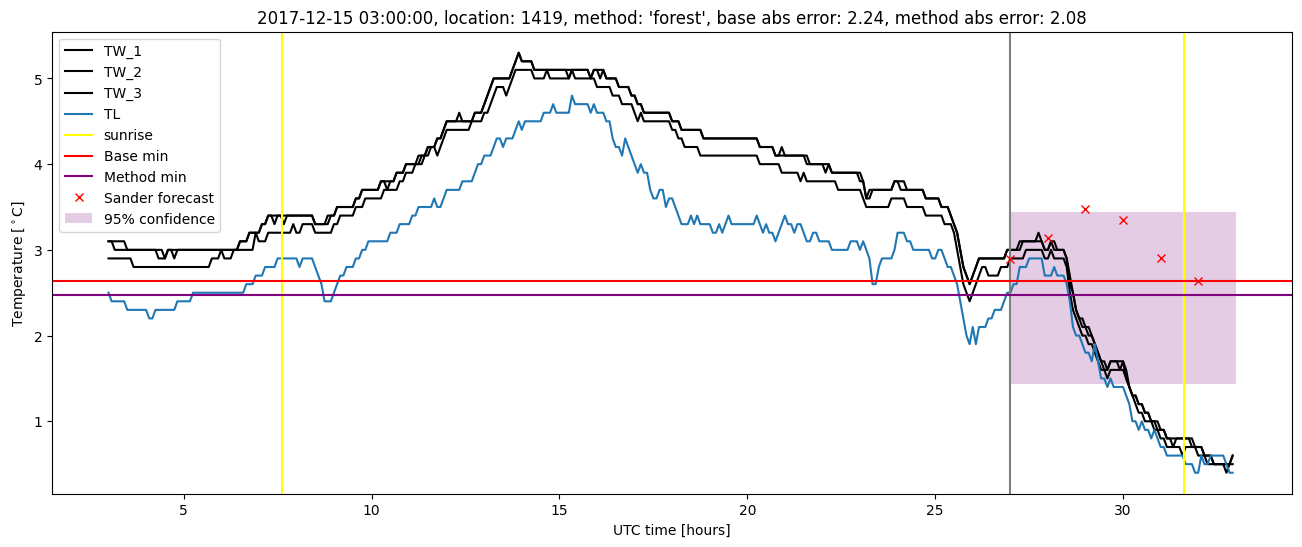
Random forest plots
Extended logistic regression results
| names |
period |
power |
significance |
meanSquareError |
absError |
maxError |
CRPS |
IGN |
| baseline |
winter 2016 |
0.976 |
0.043 |
0.279 |
0.396 |
2.448 |
NaN |
NaN |
| elr |
winter 2016 |
0.976 |
0.043 |
0.253 |
0.391 |
2.021 |
0.551 |
3.425 |
| baseline |
winter 2017 |
0.982 |
0.048 |
0.460 |
0.475 |
2.731 |
NaN |
NaN |
| elr |
winter 2017 |
0.955 |
0.048 |
0.453 |
0.481 |
2.449 |
0.531 |
3.820 |
| baseline |
winter 2018 |
0.978 |
0.111 |
0.374 |
0.417 |
2.995 |
NaN |
NaN |
| elr |
winter 2018 |
0.993 |
0.083 |
0.350 |
0.399 |
2.971 |
0.535 |
3.903 |
| baseline |
winter 2019 |
0.991 |
0.000e+00 |
0.394 |
0.445 |
2.187 |
NaN |
NaN |
| elr |
winter 2019 |
0.991 |
0.154 |
0.349 |
0.449 |
1.634 |
0.547 |
4.345 |
| baseline |
all |
0.981 |
0.061 |
0.370 |
0.430 |
2.995 |
NaN |
NaN |
| elr |
all |
0.979 |
0.070 |
0.345 |
0.426 |
2.971 |
0.541 |
3.825 |
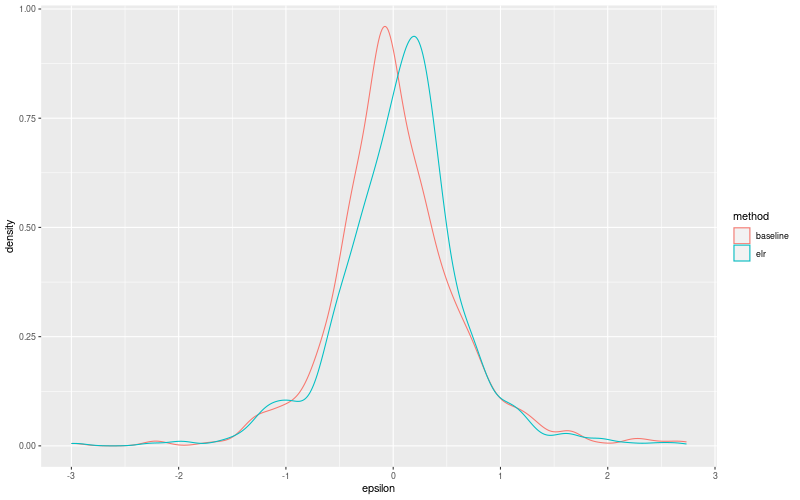
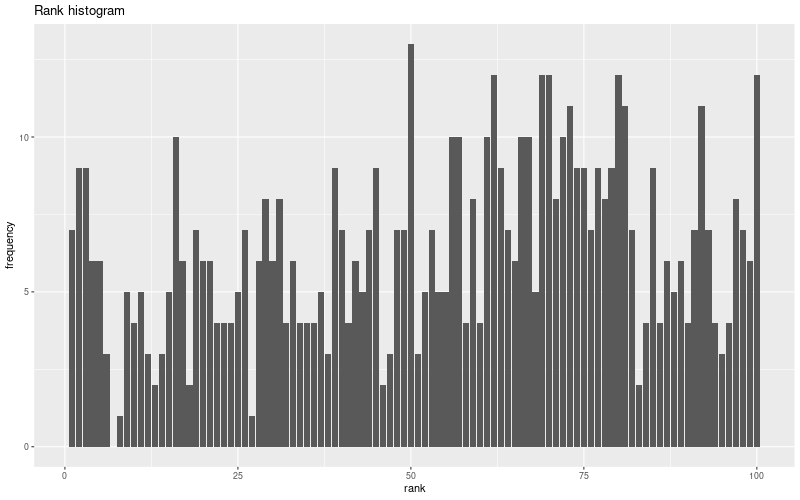
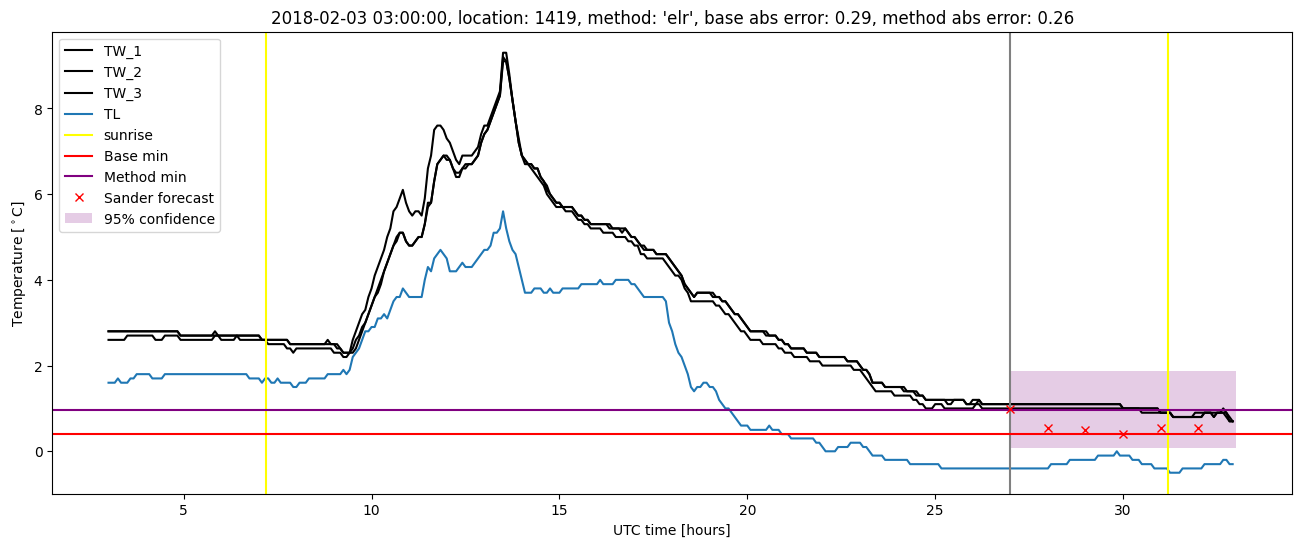
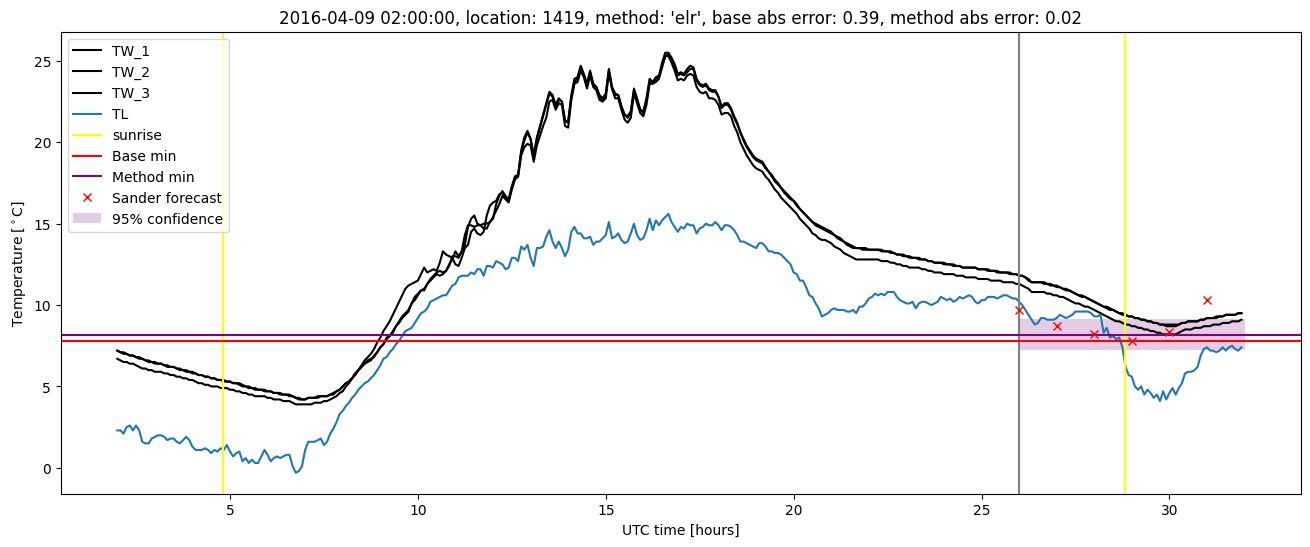
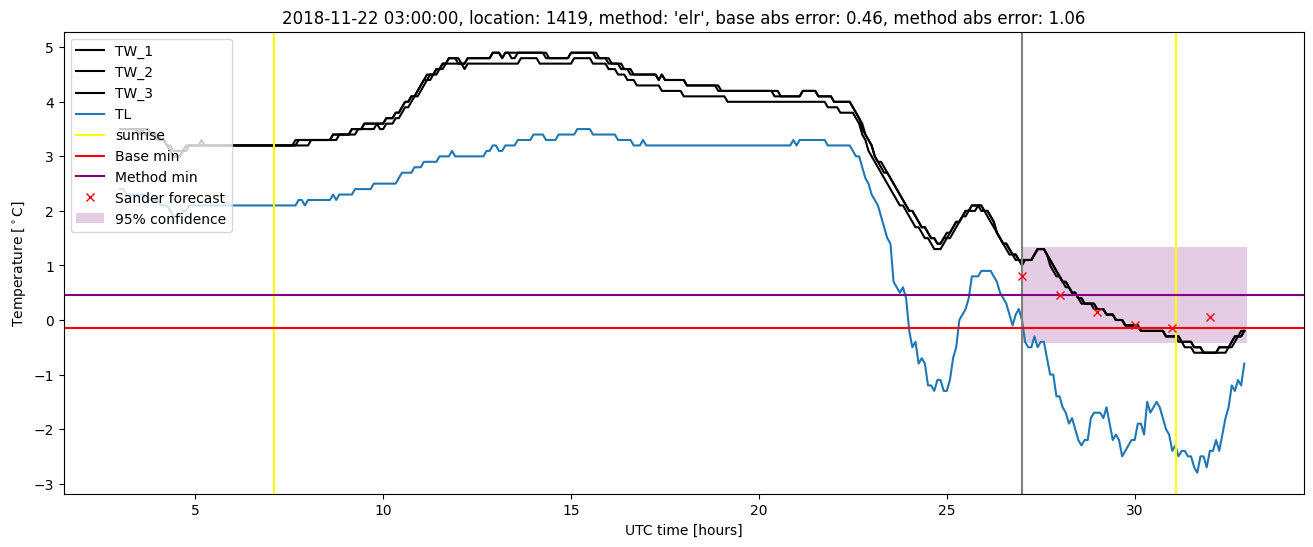
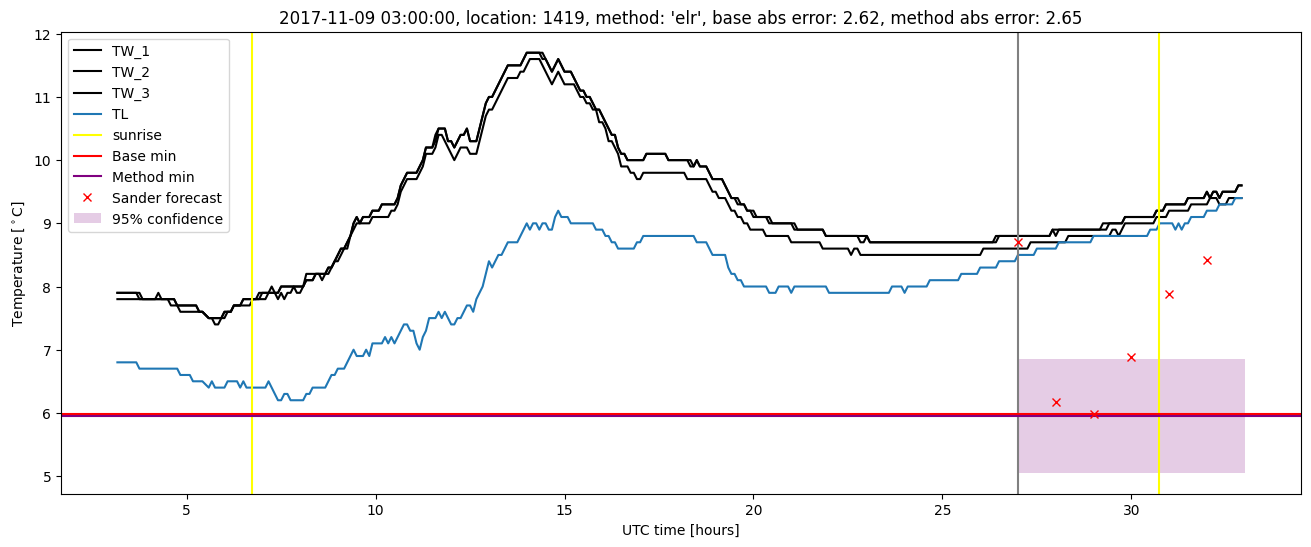
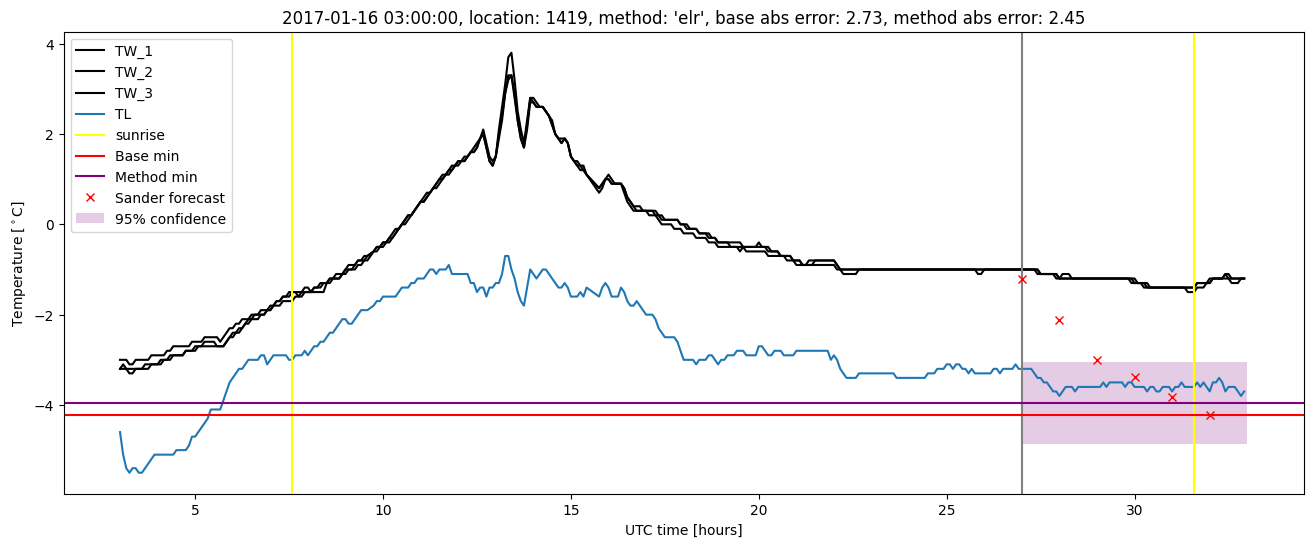
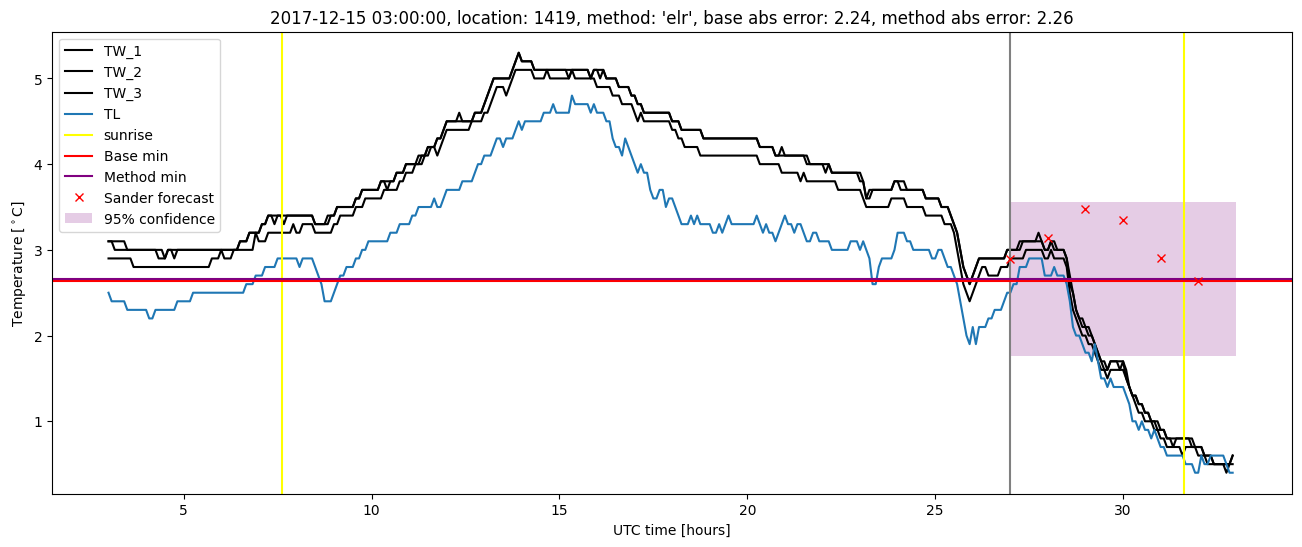
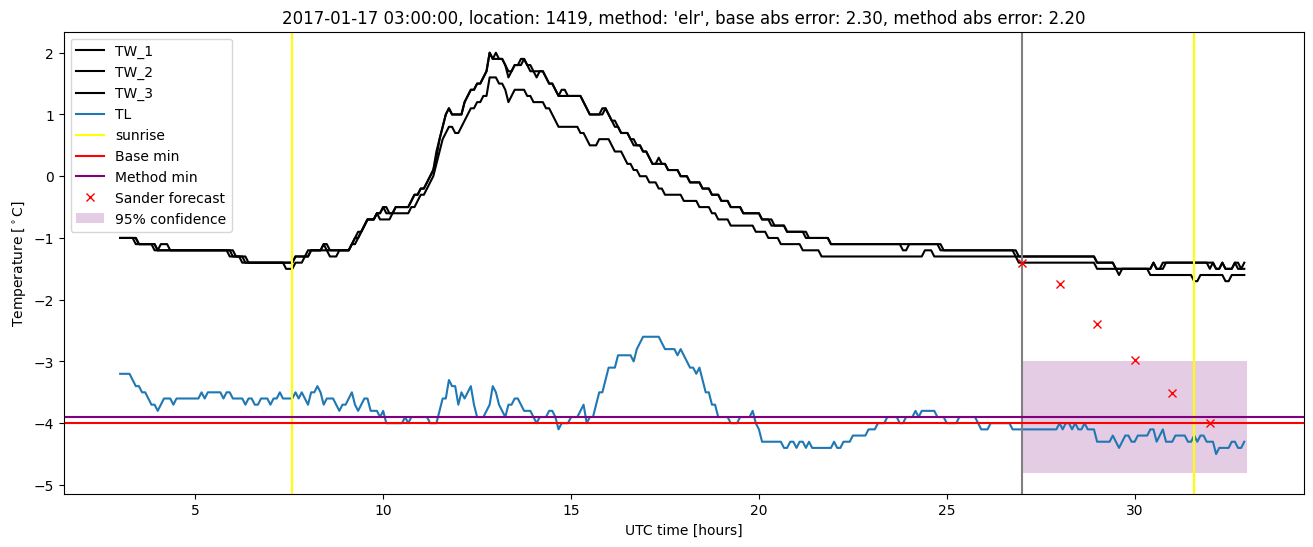
Extended logistic regression plots