GMS location: 1418
Random forest results
| names |
period |
power |
significance |
meanSquareError |
absError |
maxError |
CRPS |
IGN |
| baseline |
winter 2016 |
1.000 |
0.031 |
0.499 |
0.519 |
3.316 |
NaN |
NaN |
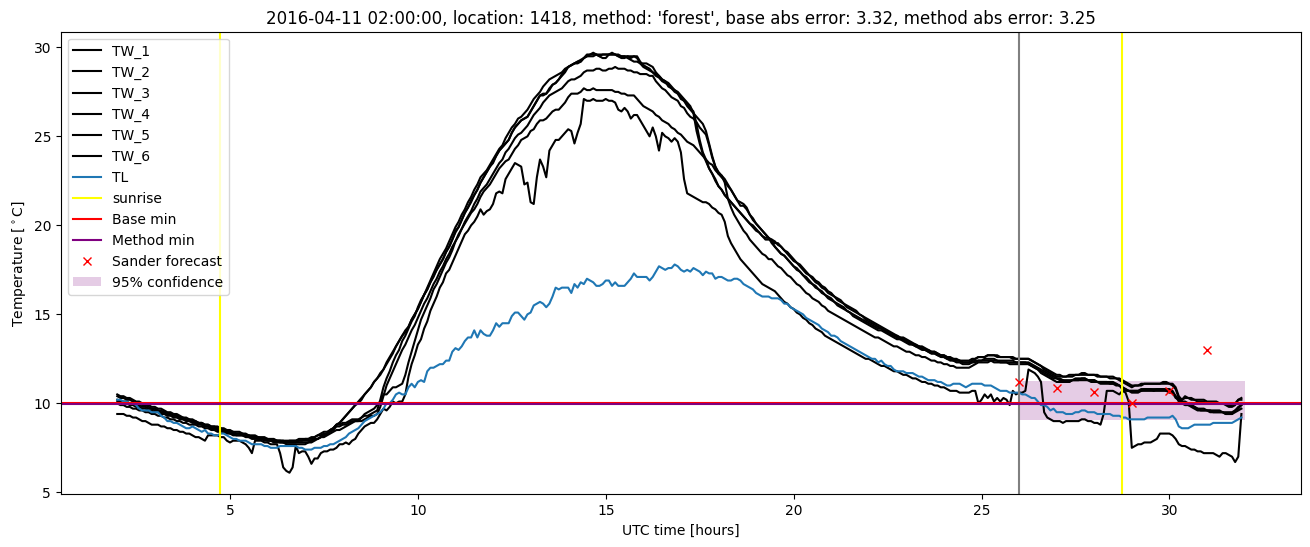
| forest |
winter 2016 |
0.987 |
0.031 |
0.429 |
0.470 |
3.255 |
0.501 |
3.654 |
| baseline |
winter 2017 |
0.981 |
0.089 |
0.290 |
0.382 |
2.312 |
NaN |
NaN |
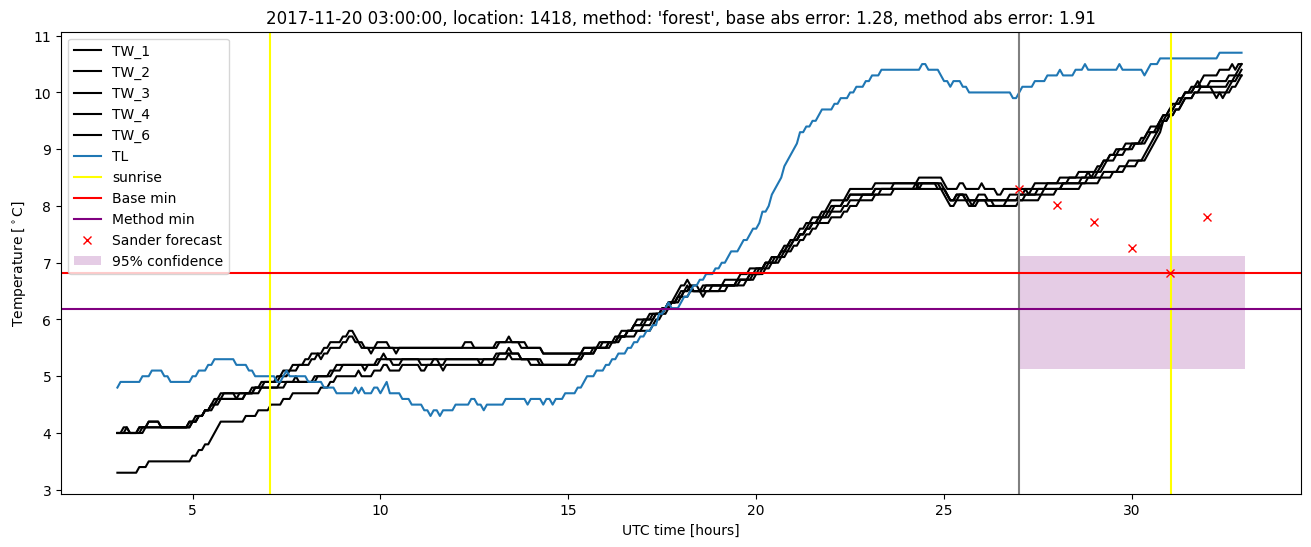
| forest |
winter 2017 |
0.981 |
0.067 |
0.282 |
0.391 |
2.047 |
0.534 |
2.681 |
| baseline |
winter 2018 |
0.993 |
0.075 |
0.422 |
0.430 |
3.503 |
NaN |
NaN |
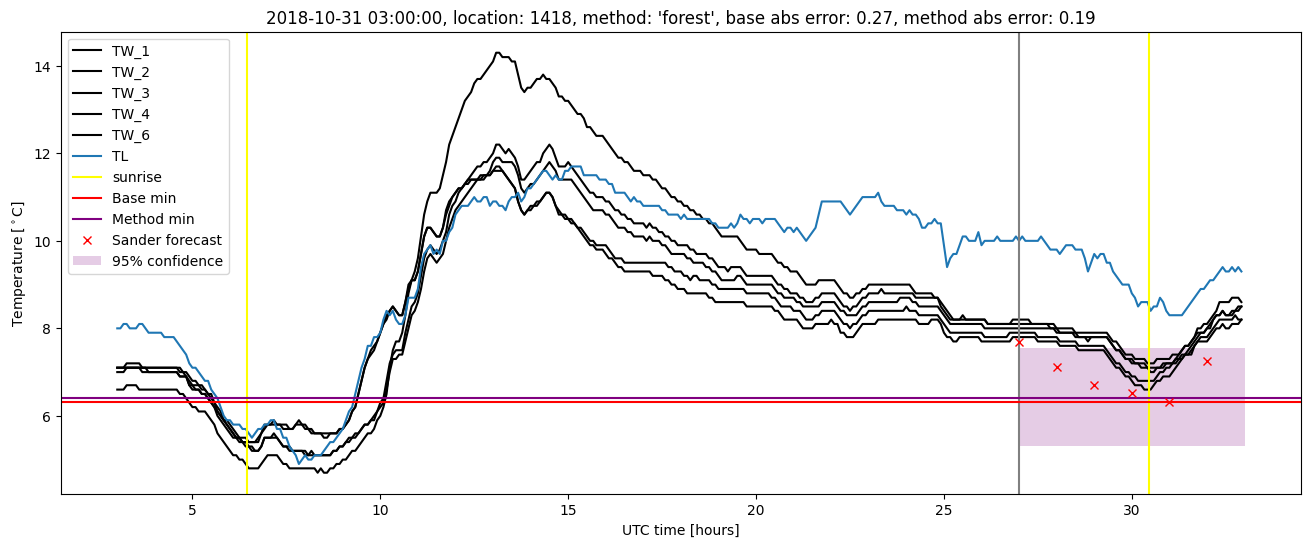
| forest |
winter 2018 |
0.970 |
0.025 |
0.418 |
0.438 |
3.160 |
0.564 |
3.262 |
| baseline |
winter 2019 |
0.992 |
0.125 |
0.378 |
0.464 |
2.006 |
NaN |
NaN |
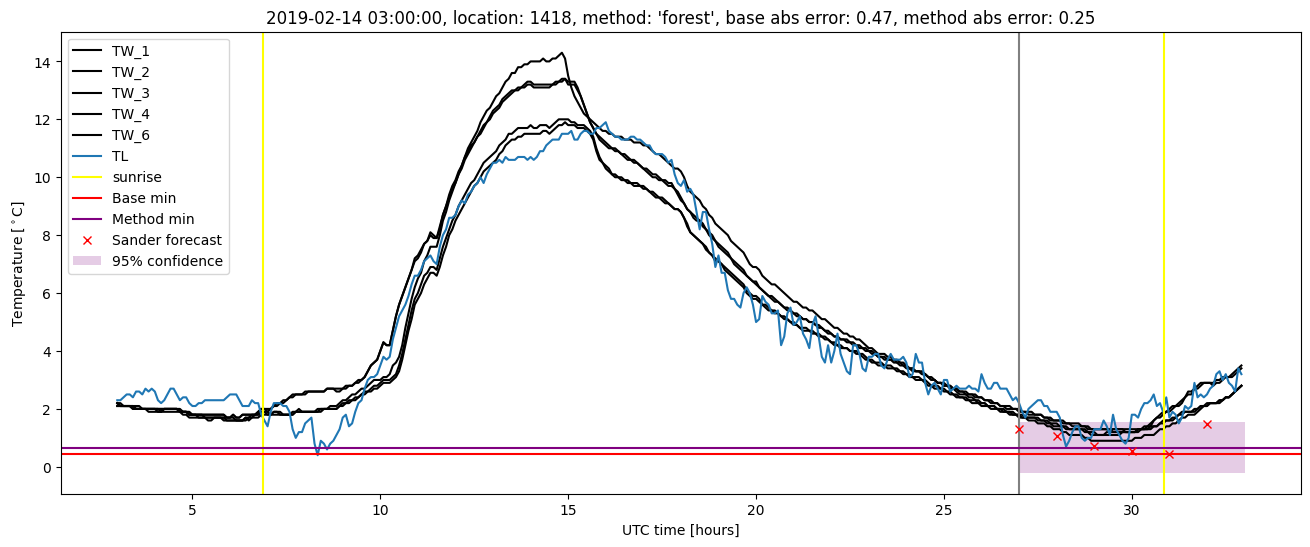
| forest |
winter 2019 |
0.992 |
0.125 |
0.333 |
0.438 |
1.933 |
0.517 |
2.356 |
| baseline |
all |
0.992 |
0.075 |
0.404 |
0.452 |
3.503 |
NaN |
NaN |
| forest |
all |
0.983 |
0.053 |
0.371 |
0.436 |
3.255 |
0.529 |
3.045 |
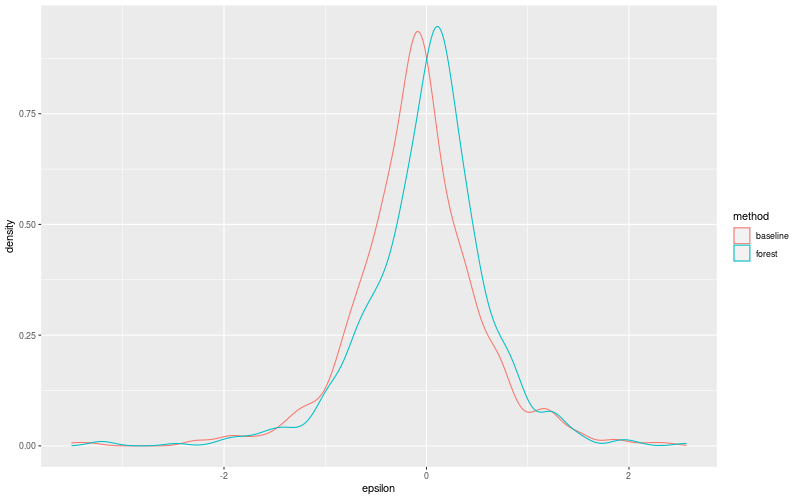
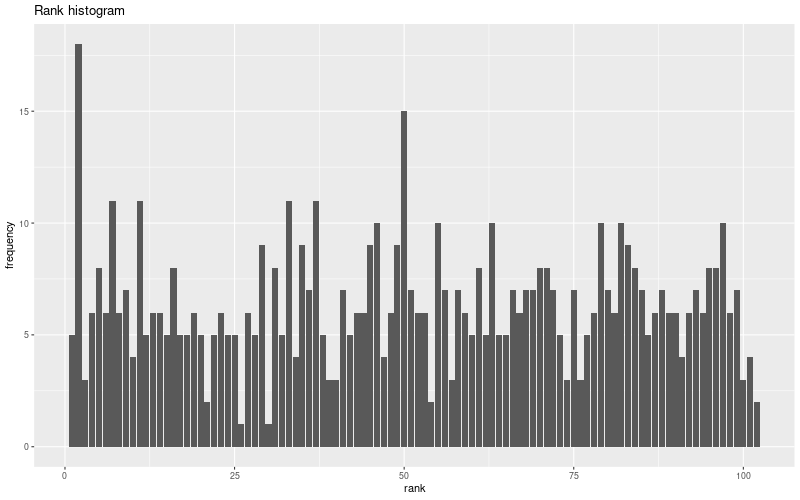
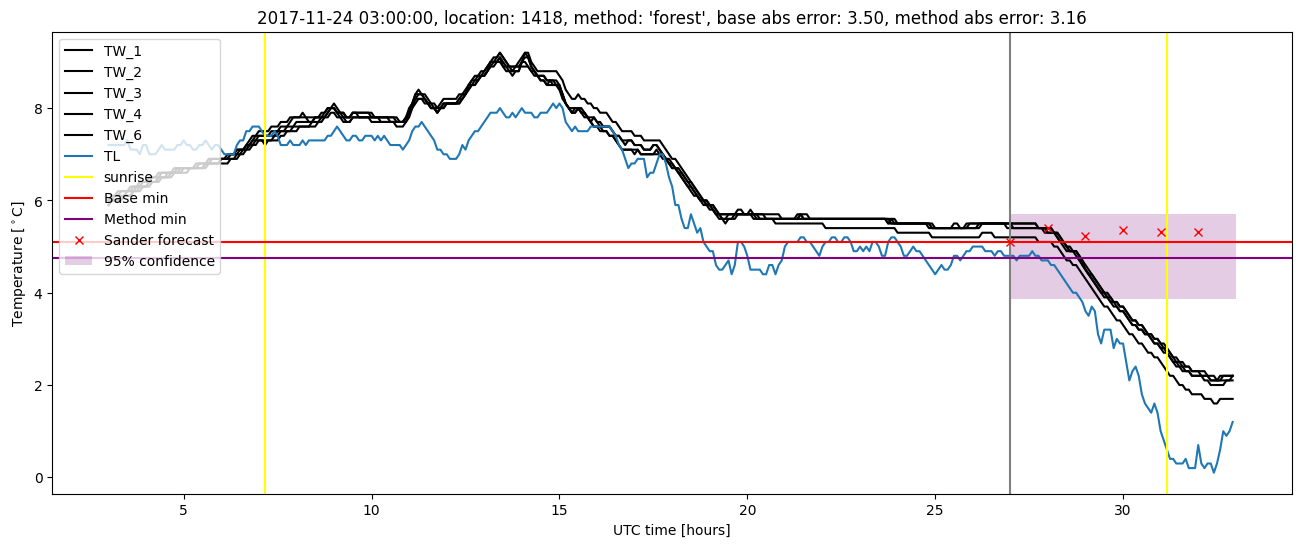
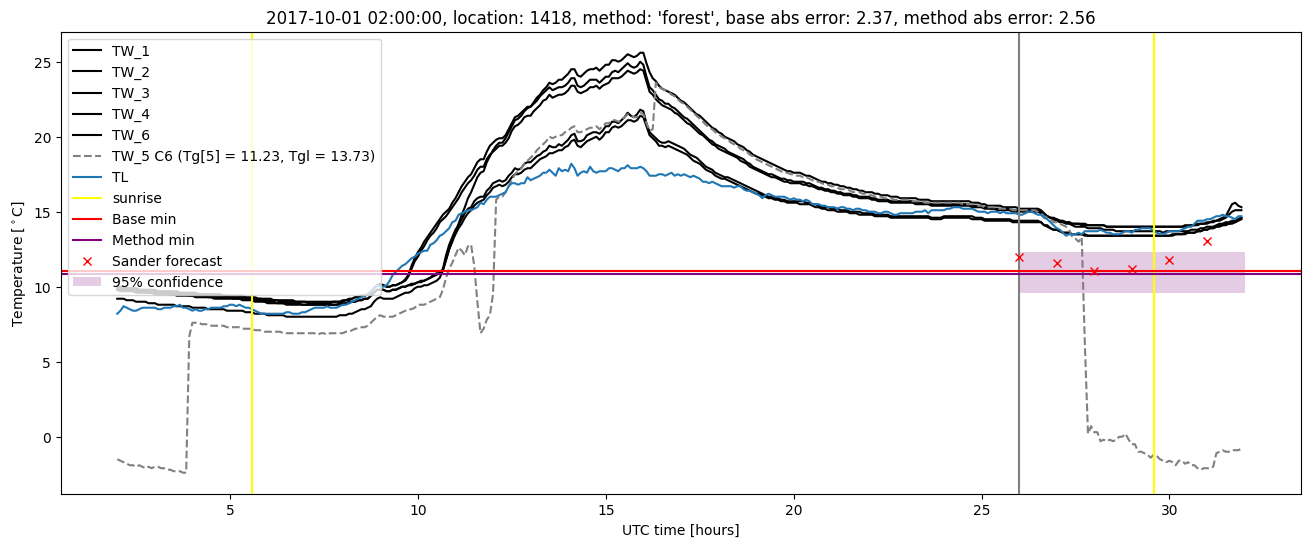
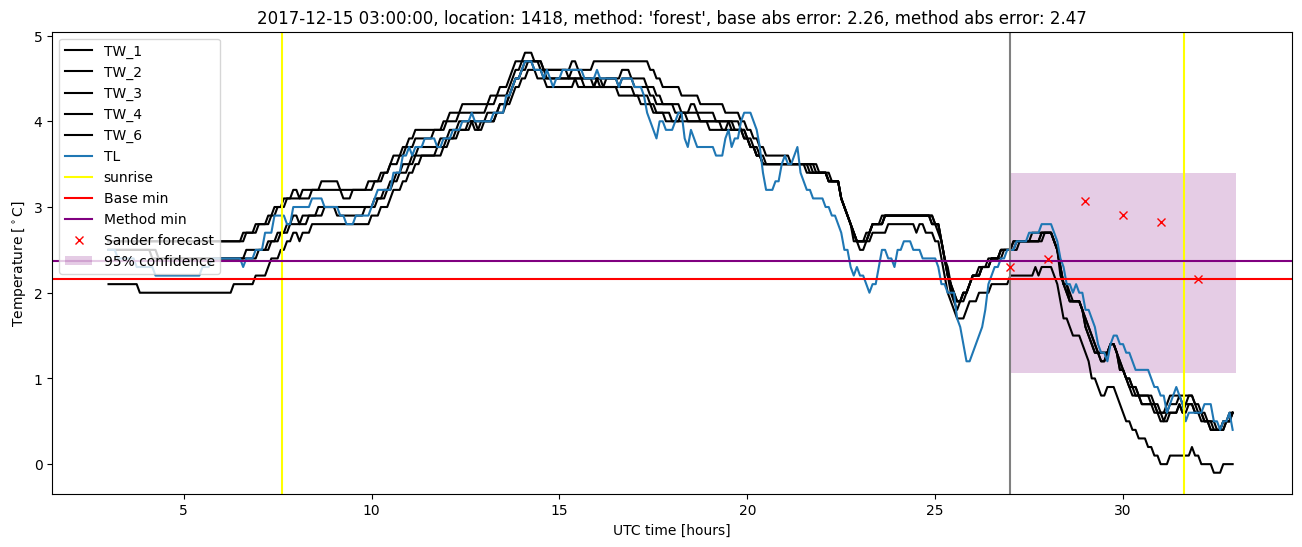
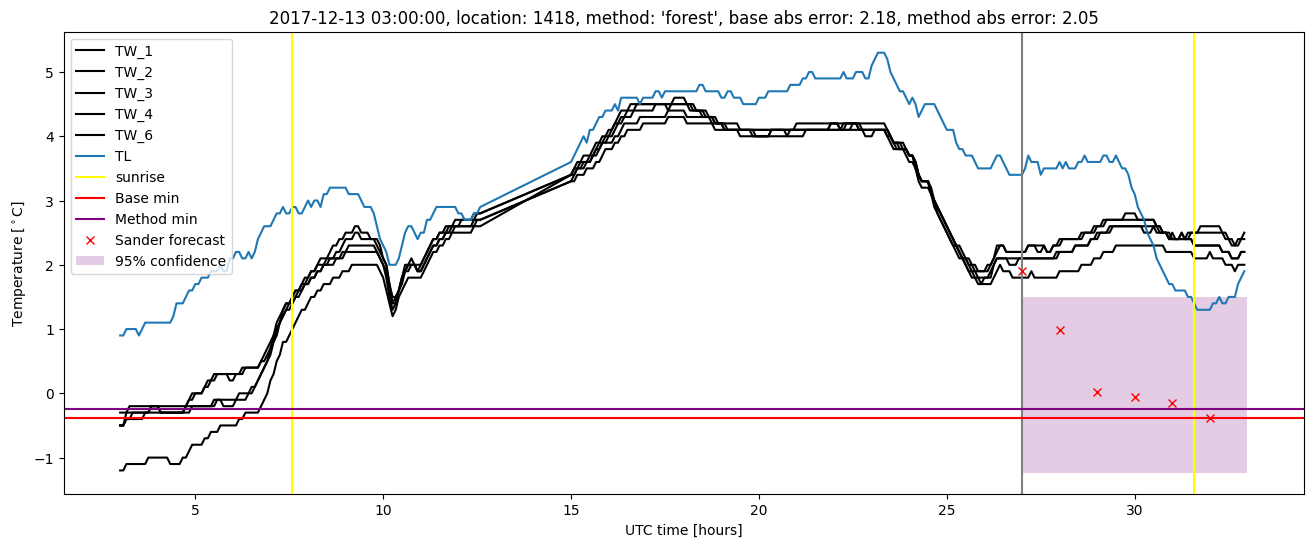
Random forest plots
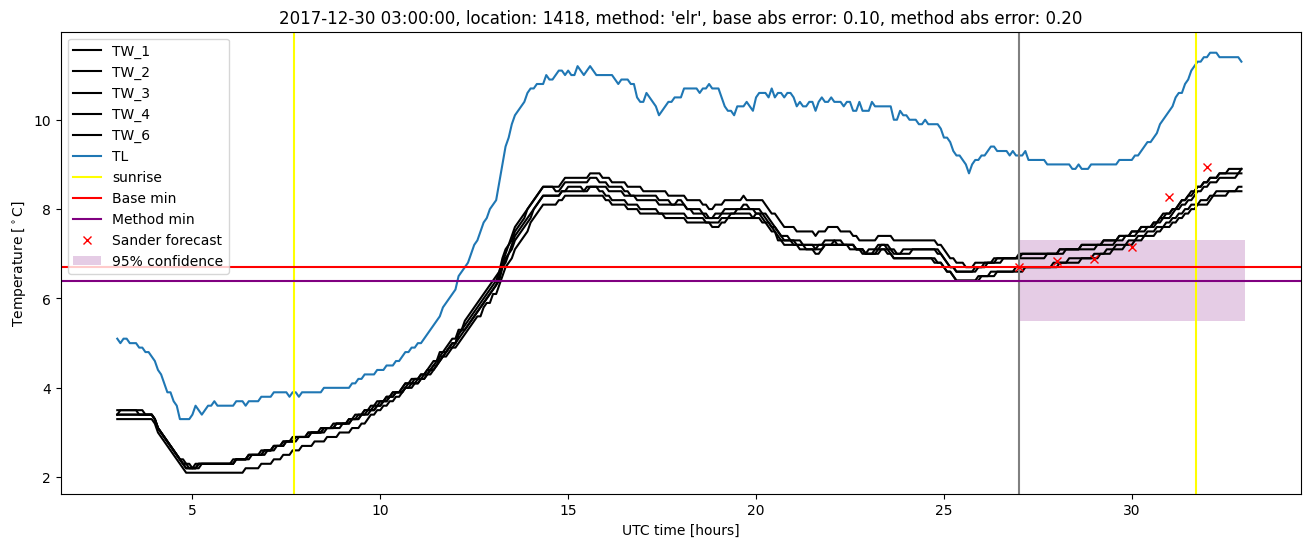
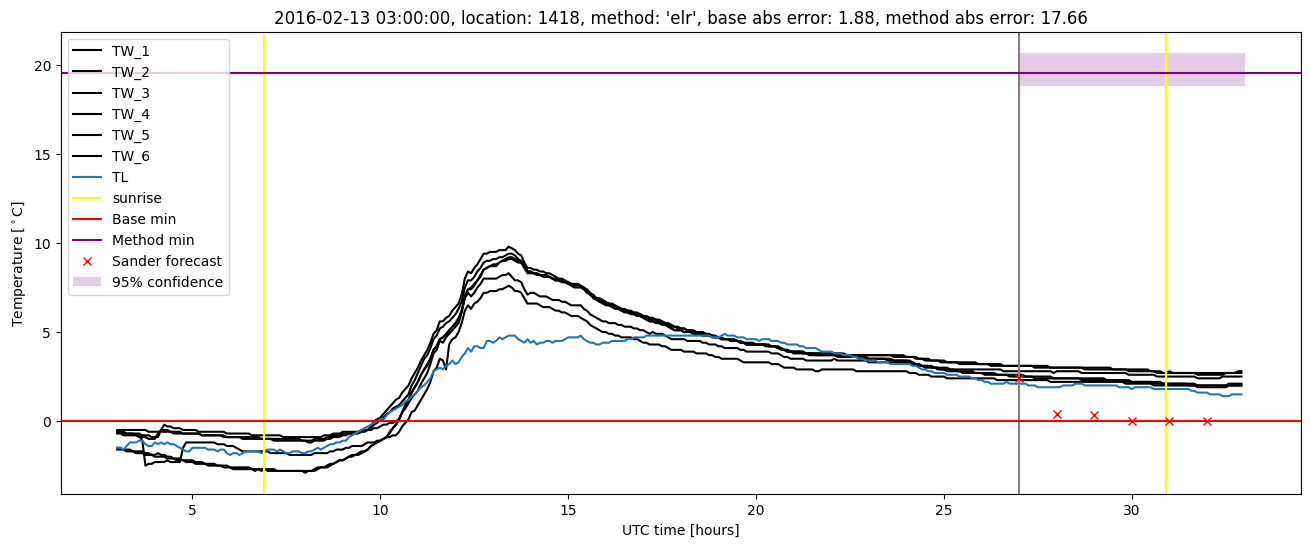
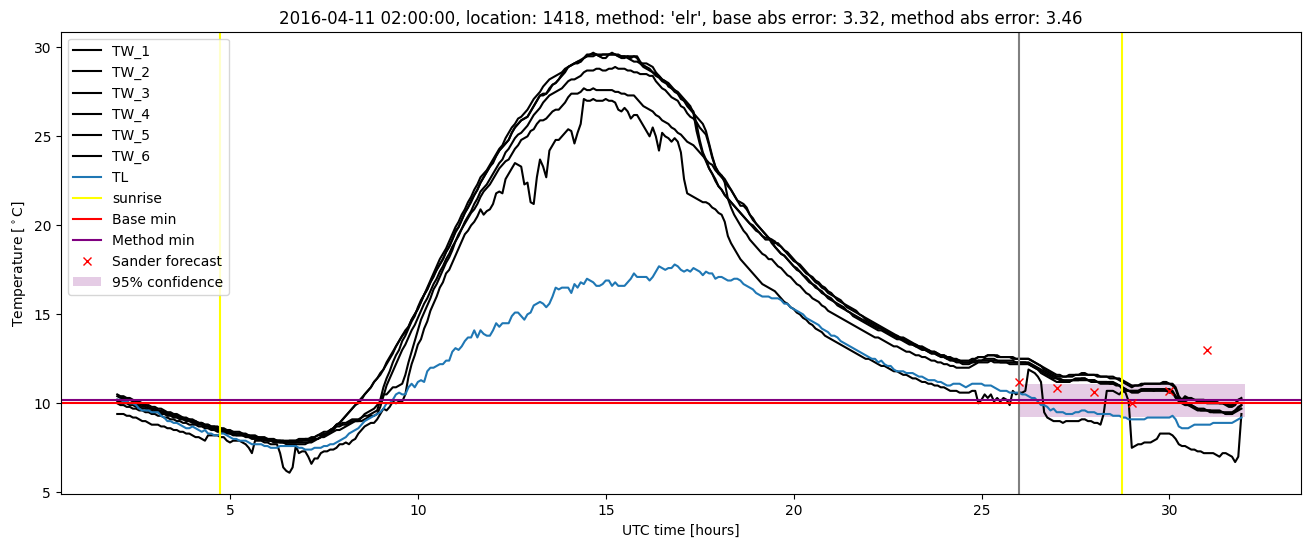
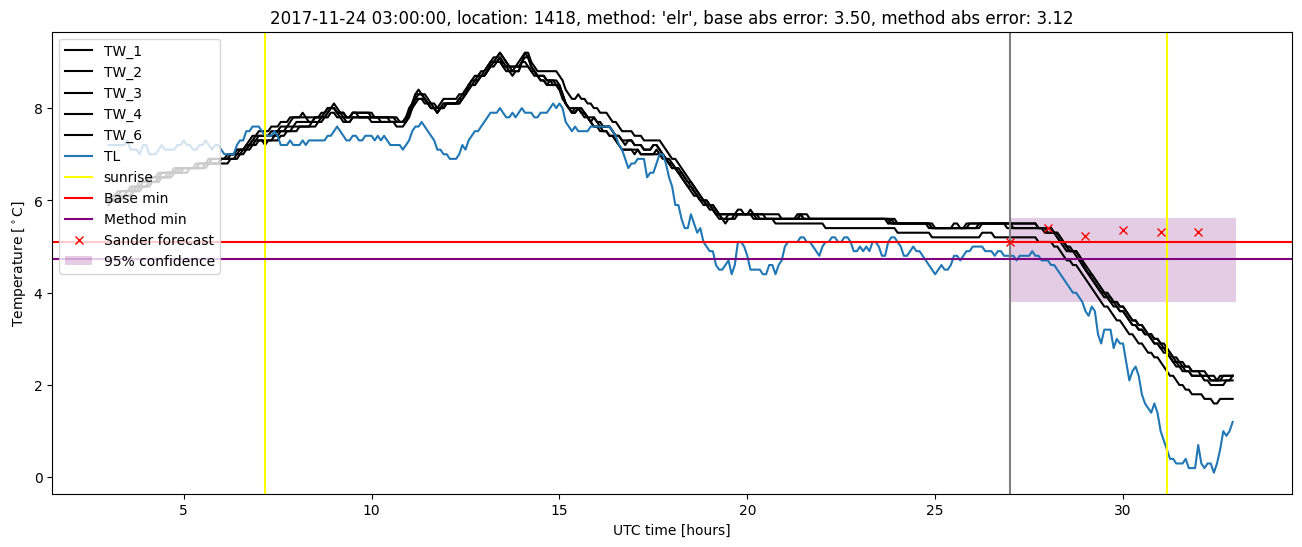
Extended logistic regression results
| names |
period |
power |
significance |
meanSquareError |
absError |
maxError |
CRPS |
IGN |
| baseline |
winter 2016 |
1.000 |
0.031 |
0.499 |
0.519 |
3.316 |
NaN |
NaN |
| elr |
winter 2016 |
0.994 |
0.031 |
2.039 |
0.540 |
1.766e+01 |
0.647 |
1.554e+01 |
| baseline |
winter 2017 |
0.981 |
0.089 |
0.290 |
0.382 |
2.312 |
NaN |
NaN |
| elr |
winter 2017 |
0.972 |
0.067 |
0.331 |
0.434 |
2.160 |
0.607 |
4.139 |
| baseline |
winter 2018 |
0.993 |
0.075 |
0.422 |
0.430 |
3.503 |
NaN |
NaN |
| elr |
winter 2018 |
0.970 |
0.050 |
0.410 |
0.459 |
3.122 |
0.643 |
5.136 |
| baseline |
winter 2019 |
0.992 |
0.125 |
0.378 |
0.464 |
2.006 |
NaN |
NaN |
| elr |
winter 2019 |
0.992 |
0.125 |
0.357 |
0.454 |
1.877 |
0.564 |
3.591 |
| baseline |
all |
0.992 |
0.075 |
0.404 |
0.452 |
3.503 |
NaN |
NaN |
| elr |
all |
0.983 |
0.060 |
0.849 |
0.476 |
1.766e+01 |
0.619 |
7.567 |
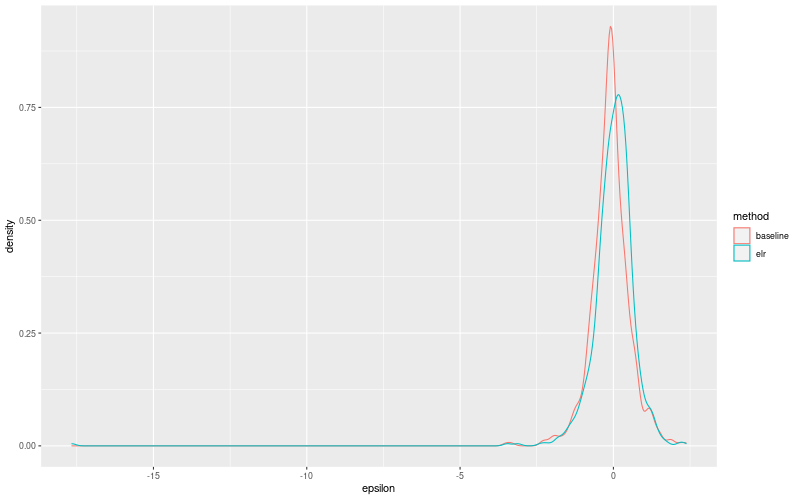
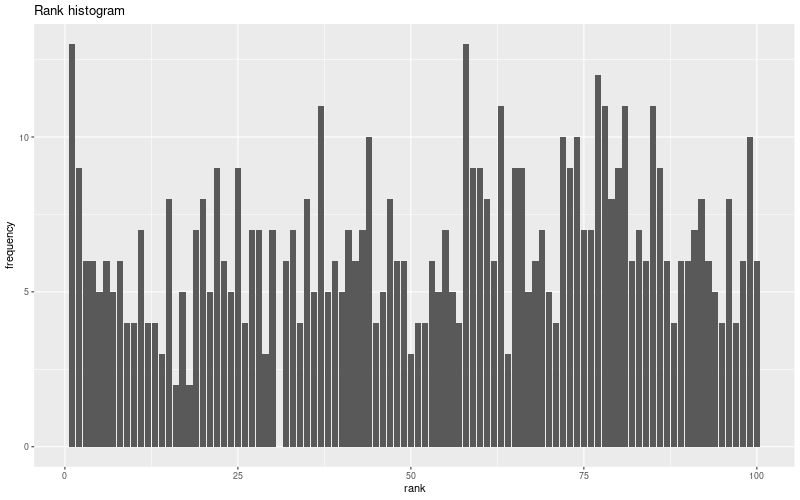
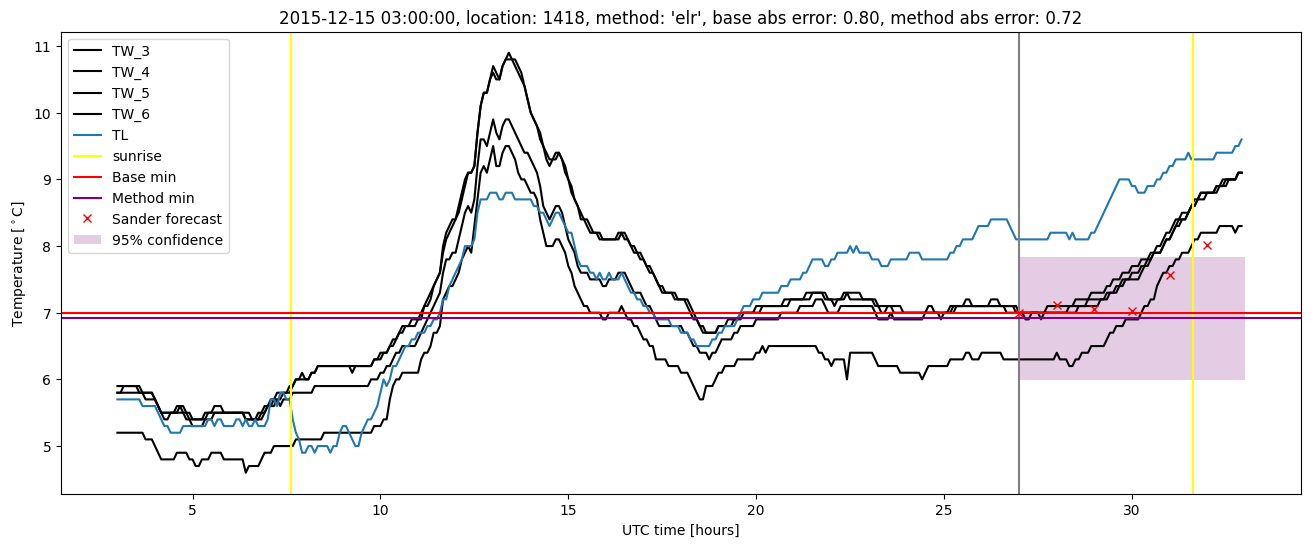
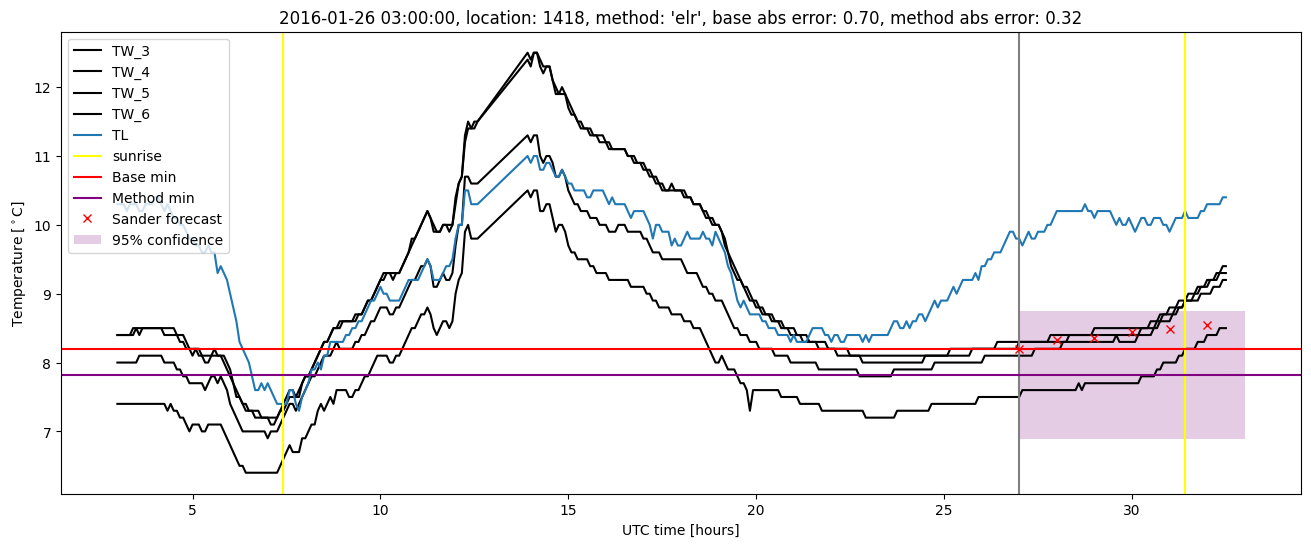
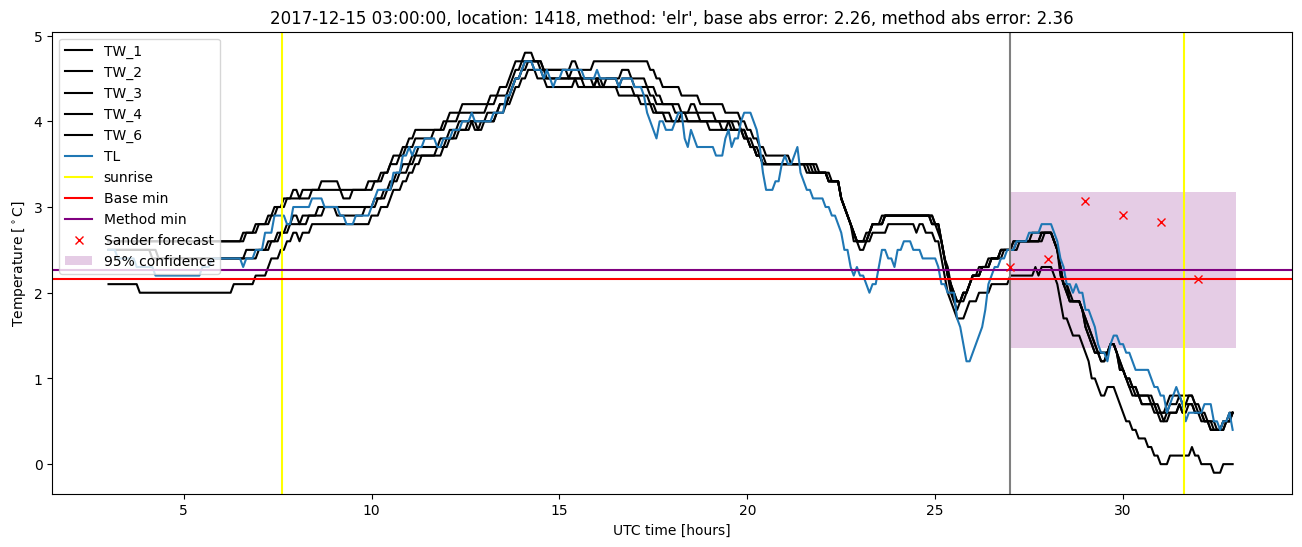
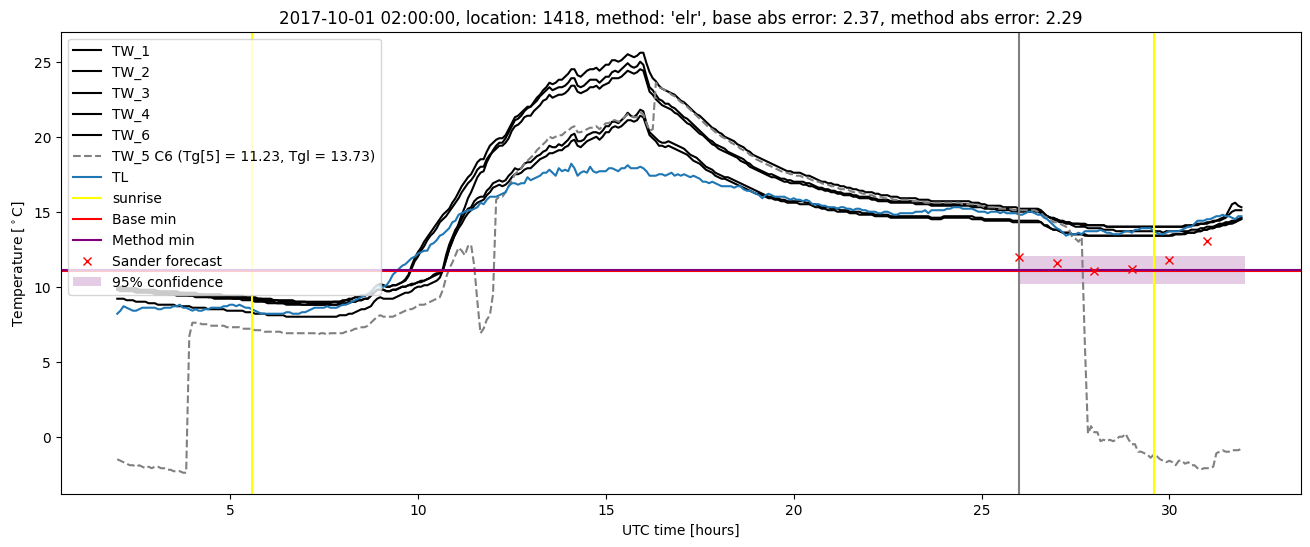
Extended logistic regression plots